


記住我
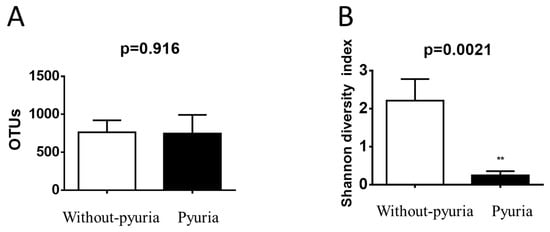


Figure 1. Comparison between the without-pyuria and pyuria groups for the number of OTUs (A) and the Shannon diversity index (B) in T2D patients treated with SGLT2 inhibitor. ** p < 0.01.
Figure 2. A stacked histogram showing the relative abundance of 16S metagenomic sequences in the urine of T2D patients treated with SGLT2 inhibitors.
Figure 3. Pearson correlation coefficient heat map of mutual analysis between bacteria (genus or species) and clinical characteristics of 11 kinds. The magnitude of the R-value of the correlation analysis is displayed by color difference. * p < 0.05.
Table 1. Clinical characteristics of T2D patients treated with SGLT2 inhibitor.
Table 1. Clinical characteristics of T2D patients treated with SGLT2 inhibitor.
Without Pyuria (n = 4)Pyuria (n = 3)p ValueDuration of diabetes (y)9.75 ± 6.1214.33 ± 5.890.614Age (y)59 ± 5.759.66 ± 6.50.942Gender (female, n)13 Urine WBC > 1 cell (%)0%100%0.008 **eGFR (mL/min/1.73 m2) stage II (n)25%100%0.047 *UACR > 30 mg/g (%)0%33.3%0.212HbA1c (%)7.15 ± 0.26.7 ± 0.30.336FPG (mg/dL)141 ± 13.1116.33 ± 7.80.174TC (mg/dL)189.55 ± 24.9130.33 ± 4.40.097TG (mg/dL)137.25 ± 23.4130.33 ± 4.40.097HDL-C (mg/dL)49.5 ± 3.4243 ± 3.210.226LDL-C (mg/dL)122 ± 22.8477 ± 7.370.142Hypertension (%)50%66%0.723Insulin use (%)0%66%0.062Urinary tract infection history (%)0%66%0.062Table 2. Bacteria identified in the urine of SGLT2-inhibitor-treated T2D patients using 16S metagenomics.
Table 2. Bacteria identified in the urine of SGLT2-inhibitor-treated T2D patients using 16S metagenomics.
GroupSample IDShannon
留言 (0)