


記住我
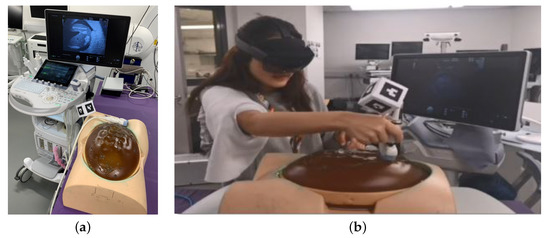


Figure 1. Three-dimensional ultrasound imaging of the specimen. A holder is used to keep the probe at the desired position. The height of the probe front-face in relation to the specimen surface is adjusted using the yellow elongators.
Figure 2. Slicing of the specimen using a specific device that allows for thin and parallel cutting.
Figure 3. An example of the correlation between slices for gross pathology assessment and corresponding imaging. (a) Specimen slice, (b) corresponding slice on 3D ultrasound image, (c) corresponding slice on CT image, (d) corresponding slice on segmentation, and (e) 3D segmentation of the animal model.
Figure 3. An example of the correlation between slices for gross pathology assessment and corresponding imaging. (a) Specimen slice, (b) corresponding slice on 3D ultrasound image, (c) corresponding slice on CT image, (d) corresponding slice on segmentation, and (e) 3D segmentation of the animal model.
Figure 4. Area measurement at parallel equally distanced planes corresponding to the pathological slices. The dashed blue line is the result of the pathological assessment, and the shaded gray area is the standard deviation of the three measurements. (a) 3D ultrasound results compared to the pathological assessment. The solid red line is the mean area at each slice obtained by 3D ultrasound. (b) CT results compared to the pathological assessment. The solid purple line is the mean area at each slice measured by CT.
Figure 5. Paired t-test for statistical evaluation of the CT and 3D ultrasound compared to gross pathology. ns stands for non-significant, and * stands for significant.
Table 1. Mean area (A_mean ± S) in mm2 measured on each slice by CT, 3D ultrasound, and gross pathology. The mean results are calculated by averaging over three different delineation sessions.
Table 1. Mean area (A_mean ± S) in mm2 measured on each slice by CT, 3D ultrasound, and gross pathology. The mean results are calculated by averaging over three different delineation sessions.
Slice NumberCT3D UltrasoundGross Pathology122.0 ± 6.319.6 ± 8.829.3239.1 ± 5.138.7 ± 11.451.5353.8 ± 2.856.9 ± 5.358.8451.6 ± 10.264.4 ± 5.667.1565.4 ± 2.362.2 ± 6.063.6669.1 ± 7.065.9 ± 1.766.9767.4 ± 14.264.5 ± 2.464.9854.6 ± 17.764.6 ± 4.658.1945.6 ± 3.049.6 ± 13.455.7
留言 (0)