
Remember me


Diabetes increases the risk of cardiovascular complications. However, the precise mechanisms contributing to the condition referred to as diabetic cardiomyopathy (Diabetic Cardiomyopathy) have remained elusive. Modifiable risk factors include uncontrolled hyperglycemia, dyslipidemia and sedentary lifestyle. Nonmodifiable risk factors include some genetic susceptibilities such as aldehyde dehydrogenase and glucosidase gene polymorphism [1–3]. The main inducer of diabetic cardiomyopathy is ischemia resulting from microvascular dysfunction. The current insight into coronary artery disease puts emphasis on microcirculatory dysfunction. An extensive body of literature exists on the impaired coronary microcirculation in diabetics, without epicardial arteries lesions, but depending on the endothelium impairment and its remodeling. This coronary remodeling is the result of microvascular dysfunction; this microvascular dysfunction is also manifested as microalbuminuria and autonomic neuropathy [4]. Cardiac autonomic neuropathy (CAN) is defined as the impairment of cardiovascular autonomic control in patients with established diabetes following the exclusion of other causes. CAN, especially at the early stages, can be subclinical, and thus as the disease progresses, it becomes clinically evident [5]. There is evidence that CAN is an independent predictor of microvascular dysfunction, and might precede other forms of microvascular involvement such as microalbuminuria or coronary dysfunction [6]. As CAN reflects microvascular dysfunction, and this microvascular dysfunction induces progressive myocardial remodeling resulting in diabetic cardiomyopathy, we can therefore hypothesize that CAN severity can be used, as an independent predictor of myocardial dysfunction in the context of diabetes; to date, there is no single report linking the two pathologies together. Early detection of diabetic cardiomyopathy (DCM) and treatment of modifiable risk factors have been found to alter the course of diabetic cardiomyopathy [7].
Detection of CAN might help in this issue. Tissue Doppler also offers itself as a reliable early detector of early cardiomyopathic changes, tissue Doppler imaging (TDI) can detect subclinical cardiomyopathic changes earlier than conventional echocardiographic parameters such as fractional shortening and ejection fraction.
The primary outcome parameter of this study is to detect changes in heart rate variability and tissue Doppler indices in type 1 diabetic patients (T1DM). Secondary outcome parameters include correlation between such indices and glycated hemoglobin as a measure of diabetic control and low-density lipoprotein (LDL) as a measure of dyslipidemia to determine which of those parameters is a more reliable inducer of CAN. Finally, yet importantly we aim to set a cutoff value for one of the CAN indices to, best, predict the occurrence of myocardial dysfunction.
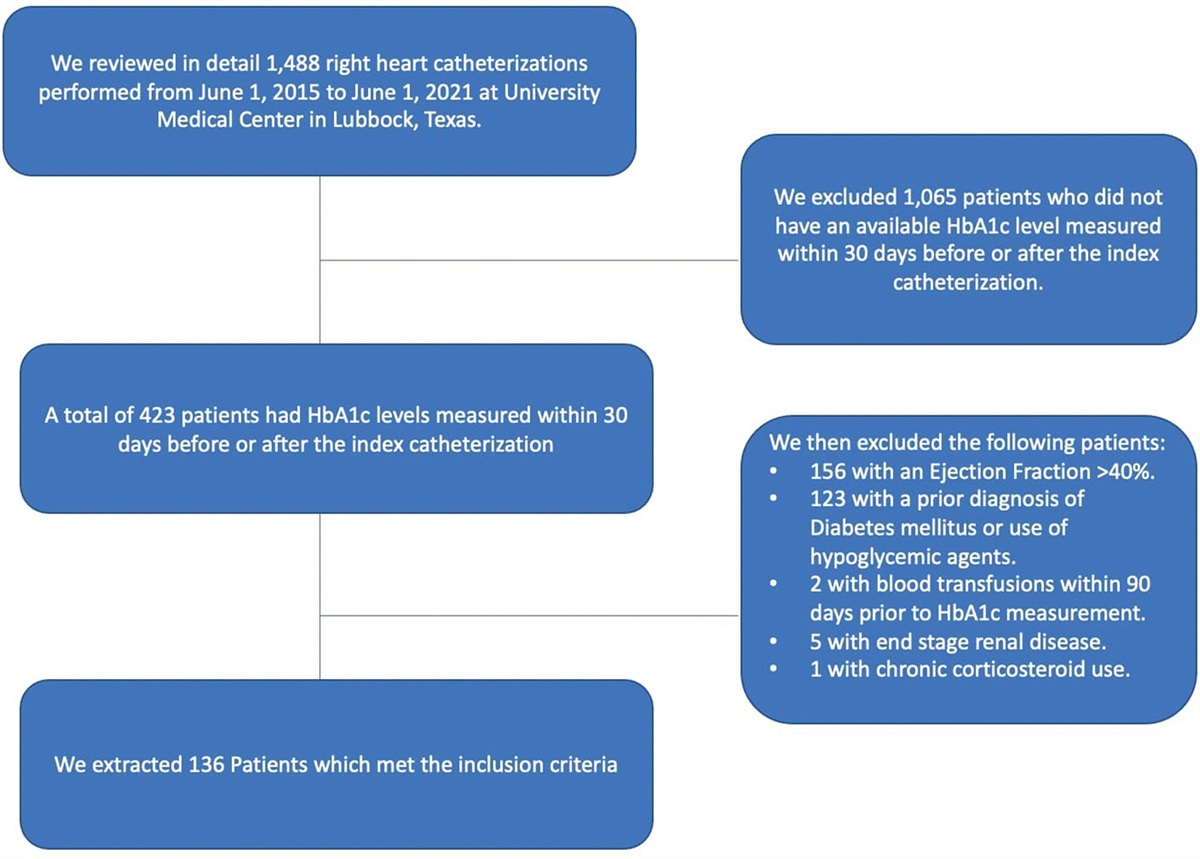
Patients and methods Study subjects:This cross-sectional study included 78 adolescents (12–18 years old) with T1D diagnosis following criteria of the Diabetes, Endocrine and Metabolism Pediatric Unit, at the Cairo University Children Hospital [Glycated Hemoglobin (Hb1Ac) >7.5% and fasting glucose> 126 mg/dL]. Patients with type-2 diabetes or monogenic diabetes, congenital heart diseases or arrhythmias, acute or chronic systemic disease that can affect cardiac function (i.e. hypertension and renal failure) and patients under medications known to affect cardiac physiology (i.e. beta-blockers, angiotensin-converting enzyme inhibitors, diuretics and anti-arrhythmic) were excluded from the study. This study included as well 75 age and sex-matched controls.
The study protocol was approved by the ethical committee of the pediatrics’ Department of Cairo University.
Study methods History taking and physical examinationPatients were subjected to a full clinical history including data from age, sex, onset of diabetes, diabetes duration, daily insulin requirements and blood and urine readings. Physical examination by an endocrinologist included a blood pressure assessment anthropometric data were collected including weight, height and body surface area.
Laboratory assessmentBlood samples were collected from T1DM girls and boys. Blood-EDTA was immediately centrifugated (20 min, 2500 rpm, 4 °C), and plasma was stored at −80 °C until use. The fasting blood glucose, HbA1c, total cholesterol and LDL cholesterol were evaluated in the Clinical Pathology Department at the Cairo University Children Hospital. Urine samples were also collected for quantification of the albumin to creatinine ratio (A/C). The presence of microalbuminuria or macro-albuminuria was diagnosed in patients when A/C was 30–299 mg/g or ≥300 mg/g, respectively.
Heart rate variabilityAll measurements of heart rate variability (HRV) were conducted in the morning between 9 and 11 a.m. in a room with a stable room temperature while the participant was lying in the resting supine position for 10 min and breathing at a normal pace. HRV was measured by computerized analysis of short-term heart rate samples (1024 beats) using schiller Cardiovit AT 60 in which the software autocratically calculates all heart rate indices in a comprehensive and accurate form using hanging window type; 1024 beat analysis by the fast Fourier transformation method [8]. Short-term electrocardiogram (ECG) recording was used to derive the statistical parameters of the normal R-R intervals (NN intervals) of the ECG and computes several time and frequency domain HRV indices. The time domain indices of HRV are the SD of the NN intervals (SDNN), the root mean square differences of successive NN intervals (RMSSD) and PNN50 (percentage of adjacent RRIs that differ by more than 50 ms). The frequency domain indices of HRV are the low frequency (LF: 0.04–0.15 Hz) and high frequency (HF: 0.15–0.40 Hz) spectral components were used, as well as the (LF/HF ratio). SDNN is a measure of overall HRV, so lower SDNN levels indicate reduced overall HRV. RMSSD and HF power represent the parasympathetic component of the HRV, and thus parasympathetic loss is quantified by the reduction in the RMSSD and HF power. The LF power is indicative of the sympathetic control of the cardiac function, and an increased LF/HF ratio denotes the increased sympathy-ovagal balance. Combined parasympathetic and sympathetic loss is indicated by a reduction in all the above HRV parameters including the LF/HF ratio.
Echocardiography:Echocardiography was performed in girls and boys at the end of the study by using conventional trans-thoracic two-dimensional (2D) Echo/Doppler (M-mode) and TDI with the General Electric Vivid 7 Ultrasound System (Vingmed model N-3190, Horten, Norway) according to the guidelines of the American Society of Echocardiography.
M-mode measurements were performed at the tips of the mitral valve leaflets in the parasternal long axis view. Left ventricular (LV) dimensions were examined in systole and diastole, and then, fractional shortening and ejection fraction were estimated. Also, the left ventricular end-diastolic volume index (LVEDVI) was calculated by dividing LVEDV by body surface area.
By combined Conventional and Tissue Doppler Imaging
(1) The ratio of early transmitral velocity to average early diastolic mitral annular and basal septal velocities (LV E/E’) was assessed.
(2) Deceleration time was calculated from transmitral doppler
(3) Using 2D echocardiography, Left Atrial Volume Index was calculated by the mean volumes obtained by the Simpson method at 2- and 4-chamber apical views, considering maximum atrial area before ventricular systole and mitral opening, and excluding left atrial appendage and pulmonary vein confluency [9].
Statistical analysisData were analyzed using IBM (International Business Machines) SPSS (The Statistical Package for the Social Sciences) Statistics version 23 (Armonk, New York, USA). Normally distributed numerical variables were presented as mean and SD and inter-group differences were compared using the unpaired t-test.
Univariate analysis was performed between LF/HF ratio and LV E/E’ ratio on one hand and each of the following metabolic indices on the other hand: HbA1c, cholesterol, high density lipoprotein, LDL, triglycerides and Alb/Cr ratio.
A Scatter plot was performed to illustrate the relationship between heart rate variability as expressed by LF/HF ratio and LV diastolic function as expressed by LV E/E’ ratio, deceleration time and left atrium volume index
Receiver operating characteristic analysis to determine the diagnostic accuracy and cutoffs of LF/HF ratio in the prediction of LV diastolic dysfunction was illustrated in the form of an interactive dot diagram. (LV E/E’ ratio ≥8 was considered diagnostic of LV diastolic dysfunction as a classification variable) [10]
P value <0.05 was considered statistically significant
ResultsTable 1 shows a comparison of the demographic and clinical parameters between cases and controls; cases were matched for age and body surface area for controls. The mean age of patients was 12 ± 2 years with no statistical difference compared to the control arm 11 ± 2. BMI was comparable between the two study groups 20 ± 3 in patients and 20 ± 1
Table 1 - Demographic and clinical parameters of cases vs. controls Parameters PatientsHR, heart rate.
*P < 0.05 = significant.
Table 2 is a comparison of HRV data between cases and controls, LF/HF ratio was significantly higher in cases compared to controls (1.9 ± 0.6 vs. 0.9 ± 0.14, respectively) reflecting cardiac autonomic dysfunction in diabetic patients compared to the control arm.
Table 2 - Comparison between heart rate variability data in patients and controls Parameters Patients Controls P value Mean ±SD Mean ±SD Average RR (ms) 683.85 71.96 641.60 83.79 0.008 SDNN (ms) 43.86 18.98 93.85 27.58 0.04 PNN50% 14.7 16.06 17.97 14.77 0.311 RMSSD (ms) 39.13 24.69 62.34 30.82 *0.03 LF/HF 1.95 0.6 0.92 0.14 *0.000Average RR, normal R- R intervals; HF, high frequency 0.15–0.40 Hz, LF/HF ratio; LF, low frequency 0.04–0.15 Hz., PNN50%, the number of instances per hour in which two consecutive R-R intervals differ by more than 50 ms; RMSSD, root mean square of the difference of successive R-R intervals; SDNN, SD of all normal R- R intervals.
*P < 0.05 = significant.
Table 3 compares the Echocardiographic data between cases and controls, M-Mode derived parameters showed no statistically significant difference between patients and control groups (fractional shortening: 37 ± 6 vs. 38 ± 5 respectively). LV diastolic function parameters showed the most statistically significant difference between diabetics and controls. Deceleration time was higher in patients compared to controls (182 ± 11 vs. 150 ± 7). Left atrium volume index was significantly higher in cases compared to controls (37 ± 2 vs. 31 ± 1). Finally, LV E/E’ ratio was higher in diabetics compared to controls (9 ± 3 vs. 7 ± 0.8), respectively.
Table 3 - Comparison between M-mode echocardiography data of patients and controls Parameters Patients Controls P value Mean ±SD Mean ±SD MM derived FS% 37.91 6.05 38.65 5.60 0.55 MM derived EF% 75.46 7.82 74.94 8.06 0.752 MM derived LVEDVI 71.66 4.53 69.74 4.73 0.67 TAPSE (mm) 19.40 3.16 20.05 3.74 *0.055 E/E’ Tricuspid annular 8.2 0.51 6.2 0.32 *0.04 LV E/E’ 9.11 3.94 7.08 0.88 *0.000 Deceleration time 182 11 150 7 0.000 LA volume index 37 2 31 1 0.000EF, ejection fraction; FS%, fractional shortening; LA, left atrium; LVEDVI, left ventricular end-diastolic volume index; LV E/E’, ratio of transmitral early inflow velocity to average early diastolic basal septal and mitral annular velocities; MM, motion mode; TAPSE, tricuspid annular plane systolic excursion, Tricuspid annular E/E’, Ratio of early tricuspid inflow velocity to early diastolic tricuspid annular velocity.
*P < 0.05 = significant.
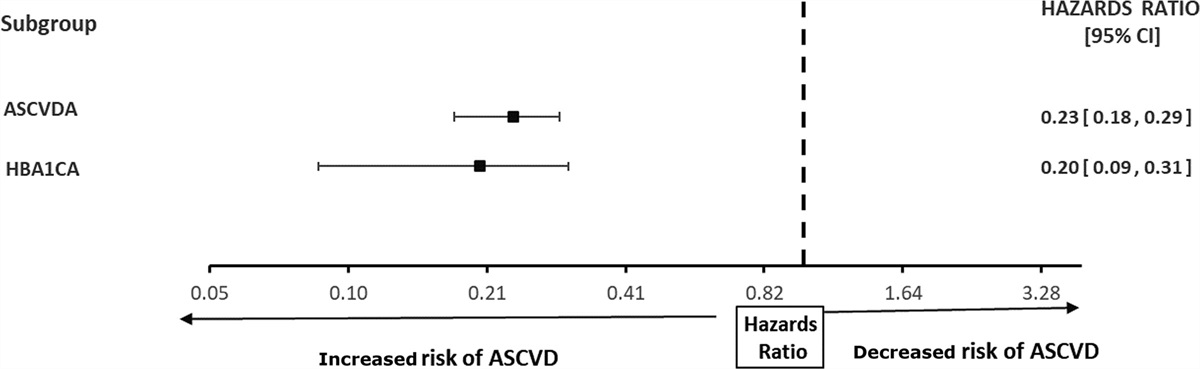
Table 4 is a regression analysis between relevant echocardiographic and HRV indices and biochemical parameters. It is noticeable that biochemical parameters were significantly correlated with LF: HF ratio, the correlation coefficient was highest between LF/HF and HbA1c (0.6), followed by LDL (0.52), cholesterol and triglycerides (0.46 and 0.42, respectively).
Table 4 - Correlation between laboratory data and echocardiographic data (tissue Doppler imaging) and most relevant heart rate variability data in diabetic patients. Parameters E/E’ (tricuspid annular) LV E/E’ Deceleration Time LA volume LF/HF r P value r P value R P value r P value r P value HbA1C% −0.177 0.129 0.247 0.06 0.28 0.063 0.18 0.08 0.602 0.000* Cholesterol (mg/dl) −0.325 0.06 0.235 0.08 0.22 0.07 0.26 0.23 0.422 0.000* LDL (mg/dl) −0.281 0.07 0.233 0.06 0.13 0.08 0.16 0.43 0.528 0.000* HDL (mg/dl) −0.215 0.064 0.091 0.435 0.19 0.12 0.23 0.07 0.208 0.073 TG (mg/dl) −0.359 0.08 0.229 0.07 0.25 0.09 0.33 0.06 0.467 0.000* Alb/cr ratio −0.166 0.155 0.267 0.08 0.22 0.19 0.27 0.26 0.378 0.04*HbA1c, glycosylated hemoglobin; HDL, high density lipoprotein; HF, high frequency 0.15–0.40 Hz, LDL, low density lipoprotein; LF, low frequency 0.04–0.15 Hz; LF/HF, ratio of LF and HF; LV E/E’, ratio of transmitral early inflow velocity to average early diastolic basal septal and mitral annular velocities; TG, triglycerides; mg/dl, milligram per deciliter; Tricuspid annular E/E’, ratio of early tricuspid inflow velocity to early diastolic tricuspid annular velocity.
*P < 0.05 = significant.
Figure 1 is a regression analysis showing a tight correlation between LV diastolic function as expressed by LV E/E’ ratio and LF: HF ratio with a P < 0.001 and r = 0.91.
 Fig. 1:
 Scatter plot showing the relationship between LF/HF ratio and LV E/E’ ratio. HF, high frequency; LF, low frequency; LV E/E’, Ratio of early transmitral inflow and average early diastolic mitral annular and basal septal velocities.
Figure 2 is a regression analysis showing a tight correlation between LV diastolic function as expressed by DT and LF: HF ratio with a P < 0.00; r = 0.94.
 Fig. 2:
 Scatter plot showing the relationship between LF/HF ratio and LV DT. HF, high frequency; LF, low frequency; LV DT, deceleration time.
Figure 3 is a regression analysis showing a tight correlation between LV diastolic function as expressed by left atrium volume index ratio and LF: HF ratio with a P < 0.001; r = 0.92.
 Fig. 3:
 Scatter plot showing the relationship between LF/HF ratio and LA volume index. HF, high frequency; LF, low frequency; LA, left atrium.
Figure 4 is an interactive dot diagram showing the best cutoff level of LF: HF ratio to predict LV diastolic dysfunction, a cutoff of 1.89 was predictive of the likelihood of diastolic dysfunction with a sensitivity of 96 % and specificity of 100%.
 Fig. 4:
 Interactive dot diagram showing the predictive value of LF/HF ratio in predicting LV diastolic dysfunction as expressed by LV E/E’ ratio. HF, high frequency; LF, low frequency; LV E/E’, Ratio of early transmitral inflow and average early diastolic mitral annular and basal septal velocities. 0. No diastolic dysfunction, 1, diastolic dysfunction.
DiscussionCardiovascular disease is the most common cause of death in diabetic patients and is currently one of the leading causes of death overall in the industrialized world. While ischemic events range highest in the list of diabetic cardiovascular complications, diabetic patients also develop heart failure in the absence of arterial hypertension and myocardial ischemia [11,12].
Changes in patterns of HRV provide a sensitive and early indicator of impaired microvascular function. High HRV is a sign of good adaptation, characterizing a healthy individual with efficient autonomic mechanisms. Inversely, low HRV is generally an indicator of abnormal and insufficient adaptation of the autonomic nervous system, which may indicate the presence of physiological malfunction in the individual [13].
Our patients were 75 diabetic children with a mean duration of diabetes 3.75
Our findings indicate that individuals with type1 diabetes have altered HRV, characterized by a reduction in HF power and RMSSD, reflecting lower parasympathetic modulation, and overall variability SDNN. In addition, we found that the LF/HF ratio and LF are increased significantly in the type 1 diabetes group as compared with healthy controls, which suggests an impaired balance of cardiac autonomic modulation (CAM) towards a sympathetic overflow and reduced parasympathetic modulation in diabetic children.
The present study shows that in, T1DM children, SDNN and RMSSD were significantly lower indicating a decrease in overall HRV. It also shows that T1DM children have higher LF and LF/HF ratio components of frequency domain indices which mainly measure the sympatho-vagal balance to the heart reflecting an increase in sympathetic nerve activity in these persons. The LF/HF ratio has been proposed to be an accurate measure of the overall sympatho-vagal balance of the autonomic nervous system in which higher values indicate a more sympathetically driven cardiovascular system. The LF/HF ratio showed the highest statistically significant difference between cases and controls [14].
The guidelines for screening diabetic CAN suggest the screening of CAN at the time of diagnosis in type-2 diabetics but after a minimum of 5 years in type 1 diabetics Our study goes in contradiction with such guidelines, as there is evidence in our series of earlier onset of CAN before the 5-year interval signaled in the guidelines [15]. The early occurrence of CAN in our study group warrants the need for earlier screening of Type 1 diabetic patients for CAN by heart variability tools.
Our patients were also subjected to the evaluation of cardiac function by M-mode, conventional and tissue Doppler echocardiography. The main findings regarding diastolic dysfunction were 14 (18.7%) patients with ventricular diastolic dysfunction. Criteria for diagnosis of diastolic dysfunction depended on the combination of both conventional and tissue Doppler parameters so there is an additional role of tissue Doppler in identifying and early diagnosis of diastolic dysfunction. With conventional and tissue doppler echocardiography, normal systolic function and impaired diastolic dysfunction of both ventricles were demonstrated in our T1DM patients. This was also reported by Khattab et al. [16].
HRV indices were significantly correlated with indices of diabetic control and dyslipidemia; in contrast, the diastolic dysfunction observed was not significantly correlated with any of the metabolic indices measured. These findings go in agreement with the description offered by Hegazy et al. [17] regarding the progress of diabetes-induced myocardial injury. He described two stages of DCM; a latent subclinical period, during which cellular structural insults and abnormalities occur initially leading to diastolic dysfunction and progressing to degenerative changes, which the myocardium is unable to repair, with subsequent irreversible pathological remodeling. It seems that CAN represents the reversible stage where reversing modifiable risk factors can help to halt the occurrence of DCM; whereas diastolic dysfunction, previously considered a reversible stage seems to develop independently of the modifiable metabolic risk factor [17].
Moreover, LV diastolic function was significantly positively correlated with LF/HF ratio, this finding was accompanied by a significant correlation between microalbuminuria and LF/HF ratio. The latter two findings go in agreement with Faulkner et al. [18] who stated that HRV is an early predictor of microvascular dysfunction responsible for renal damage in diabetes. Our study is by far the first, to highlight the potential of HRV to predict LV diastolic dysfunction; this also might outline the pathogenesis of diabetic cardiomyopathy. The microvascular injury seems to play an important role in the observed diastolic dysfunction and might be early predictable through LF/HF ratio. Nevertheless, we determine the best predictive cutoff of LF/HF ratio >1.89 with a sensitivity of 96% and specificity of 100%.
Finally, yet importantly, HRV indices showed less interobserver variability than tissue Doppler parameters which reflects the reliability of its use for early detection of the earliest stages of cardiac involvement in diabetes.
ConclusionThis study is by far the earliest study to underline the relationship between CAN and the development of DCM. Such relationship reveals that microvascular involvement might be at the core of the development of DCM. The knowledge of that might help in the early screening of diabetic patients using LF: HF ratio and to reverse the modifiable risk factors to halt the development of DCM.
Acknowledgements Conflicts of interestThere are no conflicts of interest.
References 1. Boudina S, Abel ED. Diabetic cardiomyopathy revisited. Circulation 2007; 115:3213–3223. 2. Boudina S, Abel ED. Diabetic cardiomyopathy, causes and effects. Rev Endocr Metab Disord 2010; 11:31–39. 3. Lee MMY, McMurray JJV, Lorenzo-Almorós A, Kristensen SL, Sattar N, Jhund PS, Petrie MC. Diabetic cardiomyopathy. Heart 2019; 105:337–345. 4. Beijers HJ, Ferreira I, Bravenboer B, Dekker JM, Nijpels G, Heine RJ, Stehouwer CD. Microalbuminuria and cardiovascular autonomic dysfunction are independently associated with cardiovascular mortality: evidence for distinct pathways: the Hoorn Study. Diabetes Care 2009; 32:1698–1703. 5. Pop-Busui R. Cardiac autonomic neuropathy in diabetes: a clinical perspective. Diabetes Care 2010; 33:434–441. 6. Vinik AI, Erbas T, Casellini CM. Diabetic cardiac autonomic neuropathy, inflammation and cardiovascular disease. J Diabetes Investig 2013; 4:4–18. 7. Giacco F, Brownlee M. Oxidative stress and diabetic complications. Circ Res 2010; 107:1058–1070. 8. Routledge HC, Chowdhary S, Townend JN. Heart rate variability–a therapeutic target? J Clin Pharm Ther 2002; 27:85–92. 9. El Aouar LMM, Meyerfreud D, Magalhães P, et al. Relationship between left atrial volume and diastolic dysfunction in 500 Brazilian patients. Arq Bras Cardiol 2013; 101:52–58. 10. Nagueh SF, Smiseth OA, Appleton CP, Byrd BF 3rd, Dokainish H, Edvardsen T, et al. Recommendations for the evaluation of left ventricular diastolic function by echocardiography: an update from the American Society of Echocardiography and the European Association of Cardiovascular Imaging. J Am Soc Echocardiogr 2016; 29:277–314. 11. Di Angelantonio E, Kaptoge S, Wormser D, et al. Association of cardiometabolic multimorbidity with mortality. JAMA 2015; 314:52–60. 12. Stevens G. Global Health Risks: mortality and burden of disease attributable to selected major risks. Bull World Health Organ 2009; 87:646. 13. Goldkorn R, Naimushin A, Shlomo N, Dan A, Oieru D, Moalem I, et al. Comparison of the usefulness of heart rate variability versus exercise stress testing for the detection of myocardial ischemia in patients without known coronary artery disease. Am J Cardiol 2015; 115:1518–1522. 14. von Rosenberg W, Chanwimalueang T, Adjei T, Jaffer U, Goverdovsky V, Mandic DP. Resolving ambiguities in the LF/HF ratio: LF-HF scatter plots for the categorization of mental and physical stress from HRV. Front Physiol 2017; 8:360. 15. Serhiyenko VA, Serhiyenko AA. Cardiac autonomic neuropathy: risk factors, diagnosis and treatment. World J Diabetes 2018; 9:1–24. 16. Khattab AA, Soliman MA. Biventricular function and glycemic load in type 1 diabetic children: doppler tissue-imaging study. Pediatr Cardiol 2015; 36:423–431. 17. Hegazy SK, Tolba OA, Mostafa TM, Eid MA, El-Afify DR. Alpha-lipoic acid improves subclinical left ventricular dysfunction in asymptomatic patients with type 1 diabetes. Rev Diabet Stud 2013; 10:58–67. 18. Faulkner MS, Quinn L, Fritschi C. Microalbuminuria and heart rate variability in adolescents with diabetes. J Pediatr Health Care 2010; 24:34–41.
Comments (0)