
記住我

The prevalence of lifestyle-associated disorders such as obesity is a key issue facing many individuals both within Germany [1] and across the globe [2]. The WHO recommends that adults between the age of 18–64 should do at least 150–300 min of moderate-intensity aerobic physical activity or at least 75–150 min of vigorous-intensity aerobic physical activity per week [3]. Despite these guidelines, approximately 31% of adults falling within this category do not achieve sufficient levels of recommended physical activity, resulting in a pandemic of physical inactivity phenomenon [4], with a 2016 publication estimating that physical inactivity costs global healthcare systems approximately $53.8 billion annually [5].
Increased levels of physical exercise alongside reduced energy intake are two of the most common behavioral changes adopted by those aiming to reduce their body weight [6], alongside other behavioral changes including self-monitoring [7,8] and a reduction in alcohol consumption [9]. Existing data suggest that an increase in physical activity and improvement in dietary habits can encourage weight loss for an individual looking to reduce their BMI [4,6,10,11].
With many individuals experiencing a drop in physical activity levels due to the ongoing COVID-19 pandemic [12], fitness apps have gained more popularity than ever before. A growing body of evidence suggests that these interventions might be more effective in helping users reach their weight loss goals when compared with traditional forms of counseling [13]. Self-monitoring, although a relatively recent development, has been increasingly integrated into behavioral weight loss apps [14]. The relative ease with which users can incorporate dietary and lifestyle guidance into their day-to-day lives appears to be an appealing aspect of such mobile apps, along with a perceived ‘gamification’ of an individual’s approach to their health [15,16]. Existing data suggest that users are drawn to the achievement-related features (such as goal setting or monitoring) used in fitness apps, which might be seen as difficult to measure or mimic in nonapp-based approaches to weight loss [16], alongside the potential social factors found to be associated with continued and consistent use of such apps [15], offering an additional form of motivation, which might not be present in traditional forms of physical activity.
In the current retrospective real-world observational pilot study, we focused specifically on users of Waya, a Germany-based digital companion app that aims to help users reach their goal weight by self-monitoring their current lifestyle habits, whereas it also offers nutritional and physical activity guidance and advice. We aimed to determine whether Waya functions as intended in terms of reducing the weight of its users while analyzing the implications of age and sex. Assessing improvements in nutritional habits and activity levels using standardized questionnaires, we also aimed to study if these factors were associated with weight loss.
Methods Data sourceWaya is a smartphone application that guides users to lose weight in a healthy manner. It is a collection of 10 interactive course units (modules) with dietary suggestions from experienced nutritionists alongside relevant educational content [17]. As users follow the course, they can monitor their progress by setting personalized goals, such as drinking 2 l of water per day, exercising for at least 15 min each day, or creating any other goal or challenge of their choice and regularly answering questionnaires.
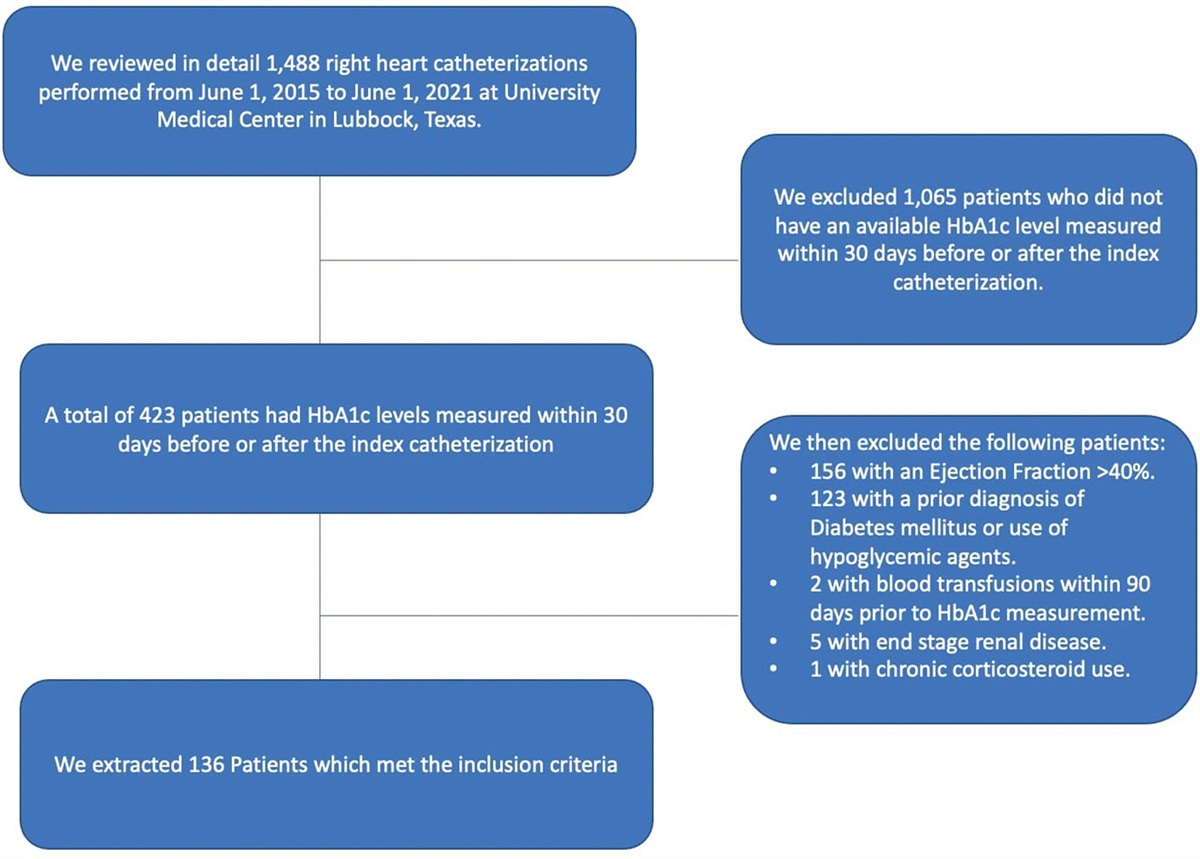
Study design and participantsThis observational pilot study included Waya users who registered between 1 May 2020 and 12 October 2021 and who provided their consent for use of their demographic and health-related data for scientific purposes were considered for our study. Due to the retrospective nature of analysis, ethical approval was waivered for this study. The basic inclusion criteria for participants were as follows:
(1) Age 18–85 years (2) Consent for health data usage and scientific evaluationFurther selection criteria were defined based on each part of the data analysis.
Data collectionDuring the initial onboarding phase before the course content was shown, demographic data (such as weight, height, and age) of participants were collected via a chatbot, a software application that initiates a human-like text conversation. The nutrition and physical activity questionnaires (see ‘Eating self-efficacy measurement’ and ‘Measurement of physical activity’ sections) were alternatively displayed every 7 days as a series of multiple-choice questions. Each participant could choose one response per question. The corresponding response, question, and time stamp were recorded. All data were collected, stored, and processed in a general data protection regulation-compliant manner. In case a participant answered a questionnaire more than once during module 1 of the course content, the earliest response was shortlisted. On the other hand, if a participant answered a questionnaire more than once during module 10 (the last module of the course), the latest response was shortlisted and used for analysis.
Eating self-efficacy measurementThe short form of Weight Efficacy Lifestyle Questionnaire (WEL-SF) was used to measure eating self-efficacy. It is a subset of eight items from the original 20-item questionnaire designed to measure self-confidence for controlling eating behavior in different situations [18,19]. Each item is rated on a scale of 0–9, where 0 indicates ‘not confident at all that I can resist overeating’ and 9 indicates ‘very confident that I can resist overeating’. Each study participant receives a total score between 0 and 72, with higher scores representing a greater capability of controlling eating behavior.
Measurement of physical activityThe extent of physical activity was measured using the short form of International Physical Activity Questionnaire (IPAQ-SF) [20]. It assesses the time spent on vigorous activities (like heavy lifting, digging, aerobics, or fast cycling), moderate activities (like carrying light loads or cycling at a regular pace), walking, and sitting in the last 7 days, using a set of seven questions. The standard IPAQ Research Committee guidelines were followed to process, clean, and truncate data [21]. In summation, they were as follows:
(1) Any activity value less than10 mins/day was recoded to ‘zero’ (2) Total activity (sum of walking, moderate and vigorous activities) greater than 960 mins/day (>16 h) was excluded from analysis (3) Any activity values greater than 180 mins/day (>3 h) were recoded to 180 minAfter processing the responses, the metabolic equivalent task (MET) for each type of activity and the total physical activity score were calculated based on the following formulae:
(1) Walking MET (mins/week) = 3.3 × walking minutes × walking days (2) Moderate MET (mins/week) = 4 × moderate-intensity activity minutes × moderate-intensity activity days (3) Vigorous MET (mins/week) = 8 × vigorous-intensity activity minutes × vigorous-intensity activity daysTotal physical activity MET (mins/week) = Walking MET + Moderate MET + Vigorous MET
One MET is equal to the energy consumed during rest (3.5 ml O2 kg−1 min−1) [22]. As the values suggest, higher activity minutes indicate a good level of physical activity. The sitting minutes were separately assessed.
Data processing and analysisData processing and analysis were performed using R [version 4.0.3, Boston, Massachusetts, USA (2020-10-10)]. We divided our analysis into three parts. In the first part, we evaluated the change in nutrition score, physical activity minutes, and weight, between the start and end of the course. In the second part, we further studied the age and sex-based differences in these values, and finally, we assessed probable correlations between weight loss and nutrition, and weight loss and physical activity. To appropriately evaluate weight differences in our study, the BMI of each participant was calculated using the formula:
BMI=bodyweight(kg)height^2(m2)
This parameter was used for all weight-related analyses in our study.
Part 1: nutritional behavior, physical activity, and BMI changes among participantsIn order to evaluate changes in nutritional behavior, physical activity, and weight of participants between the start and end of the course, we compared corresponding values before the completion of the first module (baseline values) with values during the course of the 10th module. The inclusion criteria for participants were as follows:
(1) Completed nine modules and started the last module (2) Height information is provided at least once during the course and weight information is provided before the start or during module 1, and during module 10 or after module 10. Participants with a baseline BMI ≥ 18.5 were considered for the study (OR) (3) Each questionnaire (nutrition or physical activity) was duly completed at least once within a 7-day time period before the start or during module 1 and during module 10 or after module 10. Participants with skipped entries were excludedThe difference in BMI, total nutrition score, and total physical activity and sitting minutes between module 1 and module 10, and their corresponding medians were calculated.
The overview of the study participants is shown in Table 1.
Table 1 - Overview over study participants Study focus Total number of users Average age Male users Female users Nutritional behavior 58 51 11 47 Physical activity 341 48 53 288 BMI changes 123 49 21 102To analyze age-based differences in nutritional behavior, physical activity, BMI at baseline and the end (during module 10) of the program, increase in total nutrition score, and total physical activity minutes, as well as decrease in BMI for every participant, were calculated. A scattered plot of these parameters with respect to age was then plotted and analyzed. For sex-based studies, participants were grouped based on sex. The mean increase in total nutrition score and total physical activity minutes, as well as mean decrease in BMI per group, was calculated, and their effect was further analyzed.
Part 3: correlation analysisTo analyze the correlation between weight and nutrition as well as weight and physical activity, decrease in BMI, increase in total nutrition score, and total physical activity minutes of chosen participants between module 1 and module 10 were used, respectively. Participants were considered for analysis only if they reported the corresponding parameters of study before the completion of the first module and during the course of the 10th module.
Statistical methodologyStatistical analysis was performed using R [version 4.0.3 (2020-10-10)]. Reliability of questionnaires was evaluated using Cronbach’s alpha. All variables in part 1 of the analysis were represented as median with 95% confidence interval (CI). The normality of these variables was tested using Shapiro–Wilk’s test. Wilcoxon signed-rank test was used to calculate differences between module 1 and module 10 for variables that were not normally distributed. The correlations between weight and nutrition, weight and physical activity, and correlations between age and all aforementioned parameters were determined using Kendall’s rank correlation. Kendall’s τb coefficient can assume a value between −1 and +1 [23]. A value close to −1 suggests a negative correlation, +1 suggests a positive correlation, and 0 indicates no correlation was observed. To identify significant sex-based differences, Welch one-way analysis of variance (ANOVA) was performed [24,25]. In each case, the F-score, degrees of freedom (df), and P-value were computed. Finally, a multivariate linear regression model was used to identify any significant impact between physical activity and nutrition combination and weight. A CI of 95% was utilized throughout the study; therefore, a P-value < 0.05 was considered to be statistically significant.
ResultsWe divided our analysis into three parts. First, we examined any perceived change in nutritional behavior, physical activity levels, and BMI of study participants; second, we assessed age and sex-based differences in these effects; and finally, we examined the potential correlation between nutritional behavior, physical activity, and weight.
Nutritional behavior, physical activity, and BMI changes among participantsTo identify if the app yielded the desired outcome, we first compared nutritional behavior, physical activity, and BMI at the beginning of module 1 with the corresponding values of module 10.
Nutritional behaviorThe WEL-SF eating self-efficacy questionnaire demonstrated good internal consistency (Cronbach’s alpha = 0.81 during module 1 and 0.94 during module 10). A total of 58 participants, 47 (81.03%) females and 11 (18.97%) males answered the entire questionnaire at least once before the completion of module 1 (baseline) and once after the beginning of module 10. On average, they took 67.5 days from the start of module 1 to begin the last module. At baseline, the median total nutrition score was 34.5. During module 10, this score significantly increased to 54 (P < 0.0001; Fig. 1). As a result, the nutritional behavior of participants (i.e. their urge to overeat) improved over the course of 10 modules.
 Fig. 1:
 Improvement in nutritional behavior among Waya participants. The bar graph above depicts difference in the median total nutrition score before/during module 1 (baseline) and module 10 (n = 58; ****P < 0.0001).
Physical activityThe short form of the physical activity questionnaire demonstrated acceptable internal consistency (Cronbach’s alpha = 0.511 during module 1 and 0.595 during module 10). A total of 341 participants, 288 (84.46%) females and 53 (15.54%) males answered this questionnaire entirely, at least once before the completion of module 1 and once after beginning module 10. On average, they took 71.67 days from the start of module 1 to begin the last module. At baseline, the median physical activity score was 2772 MET minutes per week. This value significantly increased to 3942 MET minutes per week, during module 10 (P < 0.0001; Fig. 2a). Simultaneously, we also observed a decrease in the median minutes per week spent sitting. As shown in Fig. 2b, the minutes per week spent sitting reduced from 420 to 300 at module 10 (P < 0.0001).
 Fig. 2:
 Increase in physical activity among Waya participants. (a) Difference in the median total physical activity minutes/week during module 1(baseline) and module 10 (n = 341; ****P < 0.0001) (b) Difference in the median sitting minutes/week during module 1 (baseline) and module 10 (n = 341; ****P < 0.0001).
We further examined individual activity domains – walking, moderate and vigorous activity as categorized by the questions. As shown in Fig. 3a, the median walking MET minutes per week remained unaltered from baseline (990 vs. 1056 at module 10; P = 0.117). However, a significant increase in the median moderate activity MET minutes per week from baseline to module 10 (480 vs. 960 at module 10; P < 0.0001; Fig. 3b) as well as an increase in the median vigorous activity MET minutes per week from baseline to module 10 (720 vs. 1200 at module 10; P < 0.0001; Fig. 3c) was observed. Overall, we observed considerable improvement in the physical activity levels as users spent more time in moderate and vigorous activities.
 Fig. 3:
 Change in individual activity domains. (a) Difference in the median walking minutes/week during module 1(baseline) and module 10 (n = 341; P = 0.117). (b) Difference in median moderate activity minutes/week during module 1(baseline) and module 10 (n = 341; ****P < 0.0001). (c) Difference in median vigorous activity minutes/week during module 1(baseline) and module 10 (n = 341; ****P < 0.0001).
BMIOne hundred and twenty-three participants, 102 (82.93%) females and 21 (17.07%) males updated their weight information at least once before the completion of module 1 and once during or after the completion of module 10. On average, they took 47.62 days from the start of module 1 to begin the last module. At baseline, 13 had a normal BMI, 66 were overweight, and 44 were obese. The median weight and BMI of participants were 82 kg and 28.69 kg/m2, respectively. During module 10, the median weight (Fig. 4a) and BMI (Fig. 4b) significantly decreased to 79 kg and 27.96 kg/m2, respectively (P < 0.0001). Therefore, we observed a considerable reduction in weight as well as BMI over the course of 10 modules.
 Fig. 4:
 Weight loss and BMI reduction among Waya participants. (a) The bar graph above shows differences in median weight during module 1(baseline) and module 10 (n = 123; ****P < 0.0001). (b) The bar graph above shows differences in median BMI during module 1(baseline) and module 10 (n = 123; ****P < 0.0001).
Differences in nutritional behavior, physical activity, and BMI based on age and sexWe further investigated whether these significant changes in nutritional behavior, physical activity, and BMI can be stratified based on age and sex.
Age-based differencesWe studied the correlation between age and nutritional behavior, physical activity, and BMI, using Kendall rank analysis. As shown in Fig. 5, the slope of the regression line indicated no clear or apparent correlation between age and nutrition score (τb = −0.028; P = 0.62).
 Fig. 5:
 Age-based differences in nutritional behavior. The scattered plot above illustrates the correlation between nutrition score and age. Each dot represents a participant (n = 58). The solid red line indicates the regression line (τ b = −0.028; P = 0.62).
Similarly, the slope of the regression line showed no clear or apparent correlation between age and physical activity score (τb = −0.0307; P = 0.2002; Fig. 6), and age and BMI (τb = 0.015; P = 0.399; Fig. 7).
 Fig. 6:
 Age-based differences in physical activity behavior. The scattered plot above illustrates the correlation between physical activity and age. Each dot represents a participant (n = 341). The solid red line indicates the regression line (τ b = −0.0307; P = 0.2002).
 Fig. 7:
 Age-based differences in BMI. The scattered plot above illustrates the correlation between BMI and age. Each dot represents a participant (n = 123). The solid red line indicates the regression line (τ b = 0.015; P = 0.399).
Sex-based differencesTo determine sex-based differences, we studied the correlation between sex and nutritional behavior, physical activity, and BMI, using Welch one-way ANOVA. As described from the sections ‘Nutritional behavior’ to ‘BMI’, we observed a high proportion of females using Waya in comparison to males. As shown in Fig. 8a–c, the improvement in the nutritional score (F = 0.04; df = 12.3; P = 0.84), physical activity (F = 0.9; df = 73.5; P = 0.345) as well as weight (F = 1.61; df = 22.4; P = 0.218) remained the same between females and males. Further large-scale studies may be required to validate the effect of sex.
 Fig. 8:
 Sex-based differences in (a) Nutritional behavior (F = 0.04; df = 12.3; P = 0.84). The bar graph above shows differences in average nutritional score between females (n = 47) and males (n = 11). (b) Physical activity (F = 0.9; df = 73.5; P = 0.345). The bar graph above shows differences in average physical activity levels between females (n = 288) and males (n = 53). (c) BMI (F = 1.61; df = 22.4; P = 0.218). The bar graph above shows differences in average BMI between females (n = 102) and males (n = 21).
Correlation analysisAlthough diet and physical activity are well-known contributing factors to weight, in the last part of our study, we sought to determine whether these factors are associated with weight loss using Kendall rank analysis. As shown in Fig. 9a, the slope of the regression line indicated a significant correlation between nutrition and BMI (τb = 0.294; P = 0.0042), in our cohort.
 Fig. 9:
 Correlation of BMI with (a) Nutrition (n = 40). The scattered plot above illustrates the correlation between nutrition score and BMI (τ b = 0.294; P = 0.0042). (b) Physical activity levels (n = 115). The scattered plot above illustrates the correlation between physical activity and BMI (τ b = 0.037; P = 0.2777). Each dot represents a participant. The solid red line indicates the regression line.
However, we did not observe any apparent correlation between physical activity and BMI (Fig. 9b; τb = 0.037; P = 0.2777), or physical activity and nutrition (Fig. 10; τb = 0.037; P = 0.3717). Furthermore, a multivariate model including weight, physical activity, and movement in turn did not show any significant effects (data not shown). As a result, it can be postulated that the weight loss observed in our cohort is more likely due to changes in nutritional behavior rather than physical activity.
 Fig. 10:
 Correlation between physical activity and nutrition. The scattered plot above illustrates the correlation between physical activity and BMI. Each dot represents a participant (n = 37; τ b = 0.037; P = 0.3717). The solid red line represents the regression line.
DiscussionOver the past decades, the prevalence of overweight and obesity has increased rapidly worldwide [26–28]. Lifestyle-associated disorders such as obesity are associated with increased prevalence of major health conditions, including cardiovascular disease, diabetes, hypertension, as well as increased cardiovascular mortality and incident diabetes risk [29–32]. In Germany, two-thirds of men (67%) and half of women (53%) are overweight [1], often resulting in major health conditions. This not only leads to a financial burden of the state but also increases the stress on the health system. Since self-monitoring health applications – like Waya are becoming increasingly more popular than traditional forms of counseling [13], it is important to understand whether these types of interventions can support patients on their path of losing weight and becoming healthier, thereby reducing their risk for major health conditions like cardiovascular disease.
In this pilot study, we aimed to assess if participants using Waya showed improvements in their nutritional behavior, physical activity levels, and, consequently, weight reduction. Among those who completed the course, we observed a significant improvement in resisting the urge to overeat and an increase in the physical activity levels. This was accompanied by significant weight reduction. These changes were independent of age and sex. In our cohort, weight loss was predominantly associated with a disciplined nutritional lifestyle rather than enhanced physical activity. These results suggest that Waya functions as intended in improving the lifestyle of its users.
Recently, several mobile applications have been developed for weight loss/management. Most focus on physical activity, nutrition, as well as behavioral changes (e.g. recording/monitoring of exercise, calorie intake, setting daily goals, etc.) [33]. Proof-of-concept and effectiveness studies of such applications presented promising results. A randomized control trial of SmartCare services (an app that remotely monitors physical activity levels and weight, and provides expert feedback on the kind of diet and exercises to be followed) showed significant weight reduction in participants with metabolic syndrome in the app group compared with control group [34]. A meta-analysis review of 12 different controlled studies (including general, overweight, and obese adults or children) showed that mobile apps with one or more of the aforementioned features were effective in reducing body weight and BMI, but were not effective in increasing physical activity levels [35]. Another systematic review of 39 digital behavioral weight loss studies found digital self-monitoring in overweight and obese patients to be linked to weight loss in 74% of cases [8]. Overall, these studies highlight the importance of physical activity, nutrition, and self-monitoring to successfully achieve weight reduction.
As with other apps, the Waya app analyzed as part of this pilot study focused on self-monitoring and behavioral changes in diet and physical activity. It provided knowledge from experts, monitored a participant’s urge to overeat and his/her activity levels, and regularly reminded users about their personally set diet and fitness goals. Similar to other studies discussed here, users of this app showed a significant weight loss even within a short period of time (an average of 1.5–2 months from the first to the last module). Of 123 participants who reported their weight, we observed clinically relevant weight reduction (3% or more reduction from the baseline [11,36]) in 63 participants (51%). We believe that a longer time period (at least 6 months) may be required to achieve a healthy and gradual weight reduction in most participants.
Even though nutrition and physical activity are two important factors modulating weight, we found it essential to study their interaction. In our cohort, nutrition (a disciplined eating behavior) was associated with weight loss; however, physical activity was not. These results partially agreed with existing literature. A preliminary study of a 28-day eating intervention app that targeted craving-related eating showed a significant reduction in self-reported overeating among 64 obese/overweight participants, who completed the intervention within a span of 3 months. This reduction in overeating was associated with weight loss [37]. A larger cross-sectional study in 2932 obese participants who completed an online survey about eating, food craving, as well as all other demographic parameters also recognized an association between controlled eating and weight loss [38]. Our results fall in line with previous findings in underpinning the role of restricted eating in weight loss.
In the case of physical activity and its correlation with weight loss, our observations seem to deviate from the literature. A number of historic randomized control trials have highlighted the role of physical activity on weight loss in overweight individuals. Most of these ranged between 4 and 16 months [39]. Extended periods of aerobic exercise alone (10 months) have also been proven to be appropriate to achieve clinically relevant weight loss [40]. A previous meta-analysis study analyzed the difference in weight loss between diet-only, physical activity-only, and combined behavioral weight management programs (BWMP) that included both. Pooled analysis of six studies showed similar weight loss within the diet-only and BWMP groups at 3–6 months. However, a greater weight loss in the BWMP group was observed at 12 months. Similar pooled analysis of five studies showed greater weight reduction in the BWMP group compared with the physical activity-only group even at 3–6 months. Therefore, ‘diet alone’ could be effective in promoting weight loss in the short term in overweight/obese participants, but ‘physical activity-alone’ may not [41]. Although we observed an improvement in physical activity levels, its contribution to weight reduction was not apparent within a span of 1.5–3 months. In combination with a restricted diet, we may require extended time periods to observe the benefits of physical activity on weight loss (an aspect that was not covered in our study protocol) as observed in previous studies. Additional long-term analysis with a larger sample size may be needed to further validate these effects in our cohort.
Physical inactivity is associated with an increased risk of type 2 diabetes [42], cardiovascular disease, and certain types of cancer [43,44]. On the contrary, physical activity reduces the risk of cardiovascular diseases and mortality [45], and has a positive long-term effect on weight gain, obesity, coronary heart disease, type 2 diabetes, as well as dementia, and Alzheimer’s disease [46]. Several studies have now shown that the pandemic restrictions have resulted in a disruption of physical activity [47]. A meta-analysis performed by Wunsch et al. [48] demonstrated that more than half of the analyzed studies reported an overall decrease in physical activity, but more importantly that most self-reported and all device-based measurement methods showed a reduction in physical activity. Although we were not able to show the direct effect of physical activity on weight loss itself, our cohort using the Waya app showed an increase in physical activity independent of age and sex, although pandemic restrictions were in order. This highlights the positive impact of a digital health companion.
The beneficial effects of Waya on nutritional behavior, physical activity, and weight loss were similar across age groups and sex. A recent study of obese individuals showed that age does not influence weight loss through lifestyle modifications, especially in a hospital-based service set-up [49]. Our pilot study further extends this idea to a mobile app-based lifestyle modification in healthy, overweight, and obese individuals. Furthermore, although the app was intended to be used by both men and women, a larger proportion of women used this digital companion in comparison with men. Keeping this bias in mind, our study showed similar effects in weight loss, and nutritional and physical activity behavior. Existing data might suggest that women are more proactive in terms of exploring and using self-care apps compared with men [50]. Sex stereotype pressure could be one of the reasons for this bias. Considering the self-monitoring nature of this app, it is unsurprising to observe more women using it than men.
Limitations of the studyAlthough our preliminary findings helped in identifying the characteristics of Waya users and the benefits of using this app, we did have certain limitations. First, the absence of a parallel control group restricted us from further confirming our findings. Second, as many participants were still in progress through the course modules and as some did not provide/complete the necessary parameters of interest, the number of participants included in this study was limited. Third, due to the retrospective nature, we also could not calculate effect size. Finally, we did not analyze other characteristics such as genotype, other preexisting conditions, medications, diet differences, and psychosocial factors that may influence weight loss.
Conclusion and OutlookOur pilot study highlighted the role of a self-monitoring digital companion such as Waya in bringing about significant weight reduction not just in overweight and obese individuals, but also in those with a normal BMI. Restricted eating (reducing the frequency of binge eating) may be promising to achieve weight loss within a short period of time. These findings show that digital health companions can indeed support users in making healthier choices regarding nutrition and exercise, thereby supporting the weight loss process. Improving and monitoring these factors will contribute to reducing cardiometabolic diseases and could, therefore, present a valuable addition to traditional counseling.
The heterogeneity between the study populations, type of diet and physical activity, and duration of study limits comparison across populations. This necessitates the need for further long-term studies in the direction of diet restriction, enhanced physical activity, and their combination. It would be very interesting to assess the long-term consequences of such self-monitoring apps not just in overweight and obese individuals but in the general population as well.
AcknowledgementsThe authors would like to thank Dr. Christian Kroiss for his valuable guidance during statistical evaluation.
The authors confirm that this manuscript has not been submitted nor published elsewhere in part or in whole.
Conflicts of interestThere are no conflicts of interest.
References 2. NCD Risk Factor Collaboration (NCD-RisC). Worldwide trends in body-mass index, underweight, overweight, and obesity from 1975 to 2016: a pooled analysis of 2416 population-based measurement studies in 128·9 million children, adolescents, and adults. Lancet 2017; 390:2627–42. 4. Kohl HW III, Craig CL, Lambert EV, Inoue S, Alkandari JR, Leetongin G, Kahlmeier S; Lancet Physical Activity Series Working Group. The pandemic of physical inactivity: global action for public health. Lancet 2012; 380:294–305. 5. Ding D, Lawson KD, Kolbe-Alexander TL, Finkelstein EA, Katzmarzyk PT, van Mechelen W, Pratt M; Lancet Physical Activity Series 2 Executive Committee. The economic burden of physical inactivity: a global analysis of major non-communicable diseases. Lancet 2016; 388:1311–1324. 6. Foright RM, Presby DM, Sherk VD, Kahn D, Checkley LA, Giles ED, et al. Is regular exercise an effective strategy for weight loss maintenance? Physiol Behav 2018; 188:86–93. 7. Goldstein SP, Goldstein CM, Bond DS, Raynor HA, Wing RR, Thomas JG. Associations between self-monitoring and weight change in behavioral weight loss interventions. Health Psychol 2019; 38:1128–1136. 8. Patel ML, Wakayama LN, Bennett GG. Self-monitoring via digital health in weight loss interventions: a systematic review among adults with overweight or obesity. Obesity (Silver Spring) 2021; 29:478–499. 9. Chao AM, Wadden TA, Tronieri JS, Berkowitz RI. Alcohol intake and weight loss during intensive lifestyle intervention for adults with overweight or obesity and diabetes. Obesity (Silver Spring) 2019; 27:30–40. 10. Guess ND. Dietary interventions for the prevention of type 2 diabetes in high-risk groups: current state of evidence and future research needs. Nutrients 2018; 10:E1245.
留言 (0)