
記住我

In mice, most T cells express a T-cell antigen receptor (TCR) consisting of α and β chains, whereas a smaller population expresses an alternative form made of γ and δ chains. The TCR α, β, γ, and δ chains each contains a clonally variable (V) region that participates to antigen recognition. During intrathymic T-cell development, the genes coding for TCR V regions assemble via site-specific DNA recombinations that can result in productive, or in out-of-frame non-productive rearrangements. Upon thymus colonization, T-cell precursors develop into CD4−CD8− double-negative (DN) cells. Based on the expression of CD25 and CD44, DN cells can be organized according to the following developmental series: DN1 (CD44+CD25−) → DN2 (CD44+CD25+) → DN3 (CD44−CD25+) → DN4 (CD44−CD25−). DN3 cells simultaneously rearrange the Trb, Trg, and Trd genes that code for the TCR β, γ, and δ chains, respectively (Livak et al, 1999). Upon productive rearrangement of Trg and Trd genes, DN3 cells express a γδ TCR and in turn mature into CD4−CD8− γδ T cells. Unlike conventional αβ T cells that acquire their effector function in the periphery, a large fraction of γδ T cells commit to an effector fate during intrathymic development. After migrating to the periphery and predominantly colonizing epithelial barriers, these “innate-like” γδ T cells had the capacity to respond without delay to infection and tissue damage (Prinz et al, 2013; Hayday, 2019; Contreras & Wiest, 2020; Fiala et al, 2020; Parker & Ciofani, 2020; Hosokawa & Rothenberg, 2021). Upon productive Trb gene rearrangements, DN3 cells produce TCRβ chains that associate with invariant pre-TCR alpha (pTα) chains to give rise to a pre-TCR (Dutta et al, 2021). Pre-TCR+ DN3 cells develop into CD4+CD8+ double-positive (DP) cells that rearrange Tra genes that code for TCRα chains. On productive Tra gene rearrangements and replacement of pTα by TCRα, the resulting TCR αβ+ DP cells undergo positive and negative selection to generate CD4+ and CD8+ single-positive (SP) cells that leave the thymus. γδ T-cell development is thus punctuated by a single checkpoint termed γδ selection and operated by the γδ TCR, whereas αβ T-cell development is subjected to two sequential checkpoints termed β and αβ selection and operated by the pre-TCR and αβ TCR, respectively. Those checkpoints are intended to couple T-cell development to the prior achievement of productive TCR gene rearrangements and the ensuing expression of αβ and γδ TCR. Developing T cells that fail crossing them are thus eliminated.
The pre-TCR, αβ TCR, and γδ TCR associate with CD3 subunits that contain tyrosine-based activation motifs. Upon phosphorylation by the LCK protein tyrosine kinase (PTK), these motifs recruit the PTK ZAP-70 that in turn phosphorylates the adaptor protein LAT, resulting in the assembly of a LAT signalosome which mediates most of the TCR-induced transcriptional responses (Mori et al, 2021). The requirement for pre-TCR and γδ TCR signaling during early T-cell development can be documented by the arrest of αβ and γδ T-cell development at the DN3 stage in mice deficient in most CD3 subunits or LAT (Malissen et al, 1999; Munoz-Ruiz et al, 2016). Two models have been proposed to explain how DN3 cells engage into the αβ or γδ T-cell lineage (reviewed in Parker & Ciofani, 2020). The precommitment (or stochastic selective) model postulates that αβ versus γδ T-cell lineage commitment is determined prior to and independently of the outcome of Trb, Trg, and Trd gene rearrangements. Accordingly, only those thymocytes whose predetermined lineage-specific molecular “wiring” matches the distinct signals delivered by the stochastically expressed pre-TCR or γδ TCR are able to further develop. In contrast, the instructive model of αβ versus γδ T-cell lineage commitment posits that it is the distinct qualitative or quantitative characteristics of the pre-TCR and γδ TCR signals received by DN3 cells that specify the αβ versus γδ lineage choice, respectively. The observation that a single transgenic γδ TCR was capable of triggering αβ lineage specification, upon attenuation of its signaling output (Haks et al, 2005; Hayes et al, 2005; Ciofani et al, 2006; Zhao et al, 2019), led to refine the instructive model into a signal strength model of αβ versus γδ T-cell lineage commitment in which the pre-TCR and γδ TCR were postulated to deliver weak and strong signals, respectively. In contrast, the fate of IL17-producing (Tγδ17) γδ T cells that arise during fetal life appears determined prior to the onset of TCR gene rearrangement, suggesting that some γδ T-cell subsets might develop according to a precommitment model (Melichar et al, 2007; Spidale et al, 2018).
Mouse T-cell developmental stages are generally well distinguished by combinations of cell surface markers. However, individual T cells within a defined developmental stage might still display some heterogeneity reflecting different developmental potential, an issue that cannot be unveiled by “bulk” transcriptomic studies (Mingueneau et al, 2013; Roels et al, 2020). In contrast, single-cell RNA sequencing (scRNAseq) permits to analyze genome-wide RNA expression at single-cell levels and to determine the degree of transcriptomics heterogeneity of a given T-cell precursor population (Klein et al, 2019, Oh et al, 2021, Rothenberg, 2021, Sagar et al, 2020). Here, we used scRNAseq to analyze the developmental bifurcation leading to αβ and γδ T cells in the thymus of adult wild-type (WT) and LAT-deficient mice. It allowed us to assess whether γδ TCR signals build upon a “blank slate” to initiate γδ T–cell lineage specification or limit their role to “confirm” a γδ T–cell transcriptional choice made prior to Trg and Trd gene rearrangements. Moreover, it provided an unprecedented single-cell resolution view of the commonalities and differences in the transcriptional signatures resulting from pre-TCR, γδ TCR, and αβ TCR signaling at distinct stages of adult intrathymic development.
Results scRNAseq analysis of the developmental bifurcation leading to αβ and γδ T cells in adult thymusTo investigate the developmental bifurcation leading to αβ and γδ T-cell lineage specification at single-cell resolution, DN cell subsets encompassing such bifurcation were isolated from 6- to 8-week-old thymus using established cell surface markers, and subjected to scRNAseq (Fig 1A). Considering that DN cells represent a quantitatively minor fraction of adult thymus, 50 WT thymi were harvested, pooled, and first depleted of DP and SP cells. Using multiparameter flow cytometry, the remaining DN cells were sorted into five subsets corresponding to DN3a cells, β-selected αβ precursors (DN3b TCRγδ− and DN4 TCRγδ−; in short DN3b γδ− and DN4 γδ−), γδ-selected γδ precursors (DN3b TCRγδ+; in short DN3b γδ+), and immature γδ T cells in the process of functional diversification (DN4 TCRγδ+; in short DN4 γδ+) (Fig 1B and C). To facilitate subsequent merging of the five individual scRNAseq datasets, 500 splenic B cells were added as an internal standard to each sorted thymocyte subset prior to subjecting them to scRNAseq (see Materials and Methods). After quality control of sequencing data, which included the removal of low-quality cells expressing < 200 genes or expressing higher than 15% mitochondrial genes, the five scRNAseq datasets were merged into Dataset 1 (see Materials and Methods and Data Availability).

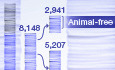
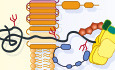
Figure 1. Schematic of scRNAseq experimental procedures
Schematic representation of the workflow used for scRNAseq analysis of thymus and the generation of Dataset 1. Thymi were pooled from 6- to 8-week-old C57BL/6 female (n = 25) and male (n = 25) mice. Five single-cell 3’ gene expression libraries containing 18,000 thymocytes and 500 spike-in B cells were constructed and individually sequenced. Schematic representation of intrathymic T-cell development stages. T-cell subsets straddling the bifurcation leading to αβ and γδ T cells were sorted and are colored in purple or brown, respectively. Workflow used to sort the T-cell subsets of interest. Thymocytes were first depleted from DP and SP T cells and then sorted by FACS. The sequential gating strategy used for sorting DN3a, DN3 γδ+, DN4 γδ+, DN3b γδ−, and DN4 γδ− subsets is shown on the specified contour plots. CD71 expression was used to distinguish post-β-selected CD44−CD25+ DN3b γδ− cells from unselected CD44−CD25+ DN3a cells. DN4 γδ− cells constitute the progeny of DN3b γδ− cells and were characterized by their CD71+CD44+CD25− phenotype. The DN thymocytes gate corresponds to viable NK1.1− cells. Among TCRδ+ CD3+ DN thymocytes, CD24+CD44low cells correspond to DN3b γδ+ and DN4 γδ+ cells. DN3b γδ+ constitutes an intermediate stage bridging the DN3a and DN4 γδ+ stages, whereas DN4 γδ+ cells constituted the end product of the intrathymic γδ developmental pathway characterized here. TCRδ+ CD3+ DN thymocytes also comprise a minor subset of CD24−CD44high cells (termed “cluster B”; (Prinz et al, 2006)) that contain NK-like T cells. Numbers indicate percentages of cells found in each of the specified gates.To visualize transcriptomic heterogeneity among Dataset 1 cells, we performed a non-linear dimensionality reduction using Uniform Manifold Approximation and Projection (UMAP) method. The clusters corresponding to spike-in B cells were identified in each sample based on Cd74, Cd19, and Ms4a1 expression. Their positions fully overlapped, indicating no batch-associated variability and precluding application of corrective measure to Dataset 1. After removing clusters corresponding to non-T cells and to low-quality cells showing a reduced expression of transcripts coding for the CD3δ and CD3ε subunits of the TCR-CD3 complex, or a low percentage of ribosomal genes, the resulting Dataset 1 comprised of 57817 DN cells corresponding to 7520 DN3a, 11389 DN3b γδ+, 8010 DN4 γδ+, 18677 DN3b γδ−, and 12221 DN4 γδ− cells.
Single-cell transcriptomics analysis of the earliest steps of γδ and αβ T-cell commitmentCongruent with current models of αβ and γδ T-cell commitment (Parker & Ciofani, 2020), the UMAP plot corresponding to Dataset 1 showed two well-separated branches emerging from DN3a cells (Fig 2A). One branch corresponded to the αβ T-cell lineage and was made of DN3b γδ− and DN4 γδ− cells, whereas the other branch corresponded to the γδ T-cell lineage and was made of DN3b γδ+ and DN4 γδ+ cells. Eleven cell clusters were identified by unsupervised analysis (Fig 2B; see Materials and Methods). DN3a cells mostly corresponded to a single cluster (cluster 2), whereas DN3b γδ+ and DN4 γδ+ cells comprised of two (3 and 6) and three (7, 8, and 9) clusters, respectively. DN3b γδ− and DN4 γδ− cells comprised of clusters 10, 0, and 1, and clusters 4, 5, and 11, respectively.

Figure 2. Single-cell RNAseq profiling of WT DN3 and DN4 adult thymocytes
A–C. UMAP plots of Dataset 1 which contains five merged scRNAseq datasets corresponding to DN3b γδ+, DN4 γδ+, DN3a, DN3b γδ−, and DN4 γδ− sorted cells and from which the small numbers of contaminating non-T cells were excluded. Cell clustering was performed using a resolution of 0.4. The UMAP plots are colored according to the sorted cell samples (A), cell clusters (B), and cell cycle phases (C). D, E. Dot plots showing the expression level of transcripts coding for established markers of intrathymic T-cell differentiation (D), and for molecules involved in V(D)J recombination and TCR signaling (E). In (D and E), dot color represents the scaled average expression of the specified gene across the various clusters, and dot size indicates the percentage of cells expressing the specified gene.The γδ TCR-induced DN3a → DN3b γδ+ transition is associated with a wave of cell proliferation (Prinz et al, 2006; Taghon et al, 2006), and most DN3b γδ+ cells were thus in the S (cluster 6) and G2/M (cluster 3) phases of the cell cycle and corresponded to transit-amplifying cells (Fig 2C). The functional diversification that occurred in DN4 γδ+ cells (see below) was associated with a return to a non-proliferative state (clusters 7, 8, and 9). As expected on the basis of former studies (Mingueneau et al, 2013), both DN3b γδ− and DN4 γδ− cells constituted transit-amplifying cells. For instance, although a small fraction of DN3b γδ− cells was in G0/G1 (cluster 10), their majority was in S (cluster 0) and G2/M (cluster 1) phases. Likewise, most DN4 γδ− were in S (cluster 4) and G2/M (cluster 5) phases.
The analysis of well-characterized cell surface markers of DN cell subsets validated our sorting strategy (Fig 2D). For instance, DN3a cells were the sole to express high levels of Il2ra which codes for CD25 (the interleukin 2 receptor α chain), and all the analyzed DN3-DN4 subsets were negative for Cd44 (a DN1-DN2 cell marker) and Klrb1 (a natural killer (NK) cell marker). Cd8b1 that codes for the β chain of CD8αβ heterodimers started to be expressed in DN4 γδ− that are the direct precursors of immature single-positive (ISP) cells, an intermediate CD8+CD4− stage bridging the DN4 and CD8+CD4+ DP stages. Consistent with their robust proliferation, DN3b γδ+, DN3b γδ−, and DN4 γδ− cells expressed Tfrc transcripts that code for the transferrin receptor (also known as CD71; Kelly et al, 2007). As expected, expression of Cd24 persisted in DN3b γδ− and DN4 γδ− cells and started decreasing in immature DN4 γδ+ prior to their differentiation into peripheral mature CD24− TCRγδ+ cells (Parker & Ciofani, 2020). Finally, γδ selection triggered a stronger increase in the expression of Cd5 and Cd27 (that codes for TNFRSF7, a member of the tumor necrosis factor receptor superfamily) as compared to β selection.
Among the analyzed DN cell subsets, DN3a cells rearrange the Trg, Trd, and Trb genes and decode the first pre-TCR or γδ TCR signals (Klein et al, 2019). They expressed the highest levels of transcripts coding for the RAG1 V(D)J recombinase subunit, the pTα chain (coded by Ptcra), the Src family protein tyrosine kinase (PTK) LCK, and the LAT transmembrane adaptor (Fig 2E). In contrast, when compared to γδ- and β-selected cells, DN3a cells expressed the lowest levels of transcripts coding for ZAP-70, which belongs to the Syk PTK family. This finding is consistent with the expression in DN3a cells of high levels of transcripts coding for the SYK PTK, which is the eponymous member of the Syk family and can substitute for ZAP-70 (Muro et al, 2018). Moreover, as suggested by a former study (Palacios & Weiss, 2007), the increase in Zap70 transcripts observed in DN3b γδ− and DN4 γδ− cells likely boosts pre-TCR signals until the ISP stage is reached. Post-selected DN3b γδ+ and DN4 γδ+ cells expressed the highest levels of transcripts coding for ZAP-70 and for the intracytoplasmic adaptors SLP-76 (encoded by Lcp2) and GRB2 among Dataset 1 cell clusters, likely contributing to reinforce the signaling strength of the γδ TCR as compared to that of the pre-TCR.
Functional diversification of adult DN4 γδ+ cellsA recent scRNAseq-based study compared γδ T-cell functional diversification in fetal and adult thymus (Sagar et al, 2020). By zooming on the scRNAseq datasets corresponding to DN3a, DN3b γδ+, and DN4 γδ+ cells, we were able to explore further γδ T-cell functional diversification in adult thymus (Fig 3A). Twelve cell clusters were identified among them using unsupervised hierarchical clustering with a fine-grained resolution. DN3b γδ+ cells comprised of clusters 6, 9, 10, and 17, whereas DN4 γδ+ cells comprised of clusters 11, 12, 14, 15, 18, and 22. Using differential gene expression analysis, we identified the top 6 differentially expressed genes (DEG) markers of each cluster based on the best positive log fold change, and we organized them into a dot plot (Fig 3B).

Figure 3. Intrathymic diversification of adult γδ T cells
UMAP plots focusing on DN3a, DN3b γδ+, and DN4 γδ+ cells from Dataset 1. Clustering was performed using a 1.5 resolution. The UMAP plot is colored according to clusters and the main characteristics of the defined clusters specified in the right margin. Dot plot showing the expression level of the top 6 DEG markers characterizing each of the 12 clusters. Dot color represents the scaled average expression of the specified gene across the 12 clusters, and dot size indicates the percentage of cells expressing the specified gene. UMAP plots colored according to the expression level of the specified genes.Cluster 19 was contiguous to cluster 0 (DN3a cells), and the cells it contained (a mix of DN3a and DN3b γδ+ cells) started expressing Gnl3 that codes for guanine nucleotide-binding protein-like 3 (GLN3 or nucleostemin; Fig 3B and C), suggesting their entry in the G1 phase of the cell cycle (Qu & Bishop, 2012). Consistent with our global analysis of Dataset 1 (Fig 2C), most of the remaining DN3b γδ+ clusters were in S or G2/M phase (Appendix Fig S1). Following such proliferative burst, the resulting DN4 γδ+ cells were predominantly resting and differentiated into IFN-γ-producing (Tγδ1) and Tγδ17 γδ T-cell subsets. For instance, the expression of Sox13, a key transcription factor for Tγδ17 programming (Melichar et al, 2007), was first induced in cluster 18 which bridged cluster 19 of DN3b γδ+ cells to clusters 11 and 15 of DN4 γδ+ cells (Fig 3A). Both clusters 11 and 15 expressed Blk and Maf, two Tγδ17-cell hallmarks (Zuberbuehler et al, 2019) in addition to Sox13 (Fig 3B and C). Cluster 15 also expressed Rorc which codes for the nuclear receptor ROR gamma transcription factor that governs IL-17 expression (Ivanov et al, 2006), whereas cluster 11 expressed Gzma and might correspond to a novel subset of granzyme A+ γδ T cells endowed with cytotoxic activity (Sagar et al, 2020).
The Tγδ1 functional branch was best characterized by the expression of high levels of Ikzf2, which codes for the zinc finger protein Helios, and it comprised three clusters (12, 14, and 22) (Fig 3A–C). Cluster 22 expressed Il2rb and Eomes, two hallmarks of the Tγδ1 cell subset. Conversely, Il2rb was not expressed in cluster 14 which instead expressed the sphingosine-1-phosphate receptor (S1pr1) that is critical for thymocyte egress (Carlson et al, 2006). Cluster 14 included a subset expressing Ccr9, a chemokine receptor involved in migration of γδ T cells to peripheral sites (Uehara et al, 2002). As recently suggested (Sagar et al, 2020), these S1pr1+Ccr9+ cells likely correspond to a population of γδ T cells that leaves the thymus in a naive state and undergoes functional polarization in the periphery. Most cells of cluster 12 corresponded to a transitional cluster between DN3b γδ+ cells and the Tγδ1 clusters. The remaining cells found in cluster 12 expressed Zbtb16 (that encodes PLZF, a lineage marker of NKT cells), suggesting that they are primed toward an IFN-γ/IL4-producing fate (Kreslavsky et al, 2009). Therefore, our fine-grained scRNAseq analysis of DN4 γδ+ cells permitted to refine a recent model of adult intrathymic γδ+ T-cell functional diversification (Sagar et al, 2020).
Identifying the transcriptional signatures induced by the pre-TCR and γδ TCR in adult thymusTo characterize early γδ T-cell specification, we identified those transcripts that were differentially expressed between the DN3b γδ+ and DN3b γδ− cells. Transcripts linked to cell cycling and metabolic activity were excluded from such “γδ TCR-induced signature” since most of them were induced in both the DN3b γδ− and DN3b γδ+ transit-amplifying cells. Likewise, most of the transcripts typifying DN3a cells were repressed at both the DN3a → DN3b γδ+ and DN3a → DN3b γδ− transitions (Mingueneau et al, 2013; Rothenberg, 2019) and thus excluded from the γδ TCR-induced signature, allowing to specifically focus on transcripts associated with early γδ T–cell specification. DEG with an adjusted P-value of 0 and expressed in < 25% of the DN3b γδ− cells were selected to generate the γδ TCR-induced signature (Fig 4A). Using the AUCell tool (see Materials and Methods; Aibar et al, 2017), we identified which cells expressed the γδ TCR-induced signature among the sorted cell subsets present in Dataset 1 (Fig 4B). As expected for a γδ TCR-induced signature, DN3a cells showed the lowest AUCell scores, whereas high AUCell scores were only observed for DN3b γδ+ and DN4 γδ+ cells. To define a “pre-TCR-induced” signature, we took in consideration that the transit-amplifying cells of the αβ T-cell lineage branch comprised both DN3b γδ− and DN4 γδ− cells (Fig 2). Therefore, for the sake of symmetry, the genes that were differentially expressed between the DN3b γδ−/DN4 γδ− cells and DN3b γδ+ cells were used to define the pre-TCR-induced signature and identify genes linked to early αβ T–cell specification (Fig EV1).

Figure 4. Transcriptional footprint of γδ T-cell lineage commitment
A. Dot plot showing the expression level of genes belonging to the γδ TCR-induced signature across DN3a, DN3b γδ+, DN4 γδ+, DN3b γδ−, and DN4 γδ− subsets of Dataset 1. The γδ TCR-induced signature was defined by comparing the transcriptome of DN3b γδ− and DN3b γδ+ cells (see Methods). B, C. AUCell scores for the γδ TCR-induced signature among the UMAP plot of cells corresponding to Dataset 1 (B) and Dataset 2 (C). As shown in Fig EV2, Dataset 2 corresponds to DN-enriched scRNAseq data merged with whole thymus scRNAseq data. D. Dot plot showing the expression level of genes belonging to the γδ TCR-induced signature across the cell subsets corresponding to Dataset 2. Based on the gene set that was specifically upregulated during the DPsmall → DPCD69+/SP transition (see Fig EV3B), it allowed to subdivide the γδ TCR-induced signature into a “γδ TCR only” signature and a “αβ and γδ TCR shared” signature. E, F. AUCell scores for the “αβ and γδ TCR shared” signature (left panel) and for the “γδ TCR only” signature (right panel) among the UMAP plot of cells corresponding to Datasets 1 (E) and 2 (F). Click here to expand this figure.
Figure EV1. Transcriptional footprint of pre-TCR selection
Dot plot showing the expression level of genes characterizing the “pre-TCR-induced” signature among the DN3a, DN3b γδ+, DN4 γδ+, DN3b γδ−, and DN4 γδ− sorted subsets of Dataset 1. The “pre-TCR-induced” signature was obtained by analyzing the genes differentially expressed between the DN3b γδ−/DN4 γδ− and DN3b γδ+ sorted samples and by selecting the genes upregulated in DN3b γδ−/DN4 γδ− subset (adjusted P-value = 0 and expressed in < 25% of the DN3b γδ+ cells). A fully identical gene list was generated when a P-value < 0.01 was used.
Commonalities and differences in the transcriptional signatures induced by the pre-TCR and γδ TCR in adult thymusThe pre-TCR-induced signature was narrower than the γδ TCR-induced signature and limited to 10 genes (Fig EV1). Among them, Cd8b1 transcripts that code for CD8β were the sole to be strongly induced during the DN3a → DN3b γδ−/DN4 γδ− transition (Fig EV1). Spats2 transcripts, which code for a protein involved in cell proliferation and called spermatogenesis-associated serine-rich protein (Dong et al, 2020), were also induced during this transition, although to a smaller extent than Cd8b1 transcripts. The remaining eight genes of the pre-TCR-induced signature corresponded to genes that are expressed in DN3a cells and poorly repressed during the DN3a → DN3b γδ−/DN4 γδ− transition as compared to the strong repression they are subject to during the DN3a → DN3b γδ+ transition. Some of them were fully repressed at the subsequent ISP stage (Ptcra), or reused in DPsmall cells for Tcra gene rearrangements (Rag1) or signaling (Dgkeos transcripts coding for diacylglycerol kinase DGKε) (Mingueneau et al, 2013). Therefore, much of the transcriptional changes induced by both the pre-TCR and γδ TCR corresponded to the shutdown of the DN3a program or to the upregulation of genes involved in the cell cycle or metabolic activity. Aside from this shared component, the remaining part of pre-TCR- and γδ TCR-induced transcriptional signatures markedly differed (Figs 4A and EV1). The former was primarily limited to the Cd8b1 transcript, whereas the later consisted of a multitude of transcripts coding for proteins necessary for the functional maturation and the ensuing intrathymic differentiation of γδ T cells (Klf2, Pdcd1, Cd5, Cd6, Cd52, Cd53, Cpa3, Blk, Etv5, and Sox13).
Identifying the transcriptional signatures induced by the αβ TCR in adult thymusTo compare the γδ TCR-induced transcriptional signature to that induced by the fully assembled αβ TCR at the DPsmall → DPCD69+/SP transition, we generated two additional scRNAseq datasets. They corresponded to adult DN and total thymocytes that were each sorted for live cells, subjected to droplet-based scRNA sequencing, and finally merged into Dataset 2 (Fig EV2A and see Materials and Methods). After controlling the quality of data merging, our clustering analysis identified nine clusters that were assigned to DN1/DN2, DN3a, DN3b/DN4, ISP/DPblast, DPsmall, DP69+, SP, and γδ T cells on the basis of markers commonly used to delineate adult thymic cell subsets (Fig EV2B and C). We used Dataset 2 to define DEG between the DPCD69+/SP cells and DPsmall cells. Such “αβ TCR-induced signature” comprised of transcripts coding for transmembrane receptors important for αβ T-cell function (Cd2, Cd5, Cd69, and Cd53), and for differentiation (Tox) and survival (Bcl2) (Fig EV3A), consistent with a former bulk transcriptomics study (Mingueneau et al, 2013).
Click here to expand this figure.
Figure EV2. Expression of the γδ TCR-induced signature across the whole sequence of intrathymic T-cell development
Schematic representation of the workflow used for scRNAseq analysis of total thymocytes and DN-enriched thymocytes and the generation of Dataset 2. UMAP plots of the cells corresponding to Dataset 2 and colored according to the defined clusters. Dot plot showing the expression level of selected genes among the eight cell clusters identified in Dataset 2. Dot color represents the scaled average expression of the gene of interest across the various clusters, whereas dot size indicates the percentage of cells expressing the specified gene. Violin plots showing AUCell scores of the γδ TCR-induced (top), γδ TCR-only signature (middle), and the “αβ and γδ TCR shared” (bottom) signatures among the specified subsets. Click here to expand this figure.
Figure EV3. Analysis of the genes that are differentially expressed during the DPsmall → DPCD69+/SP transition
Dot plot showing the expression level of the top genes which are upregulated during the DPsmall → DPCD69+/SP transition among the eight cell clusters identified in Dataset 2 (genes shown are expressed in < 25% of DPsmall cell, have a P-value = 0 and a log fold change > 0). Dot color represents the scaled average expression of the specified genes across the eight cell clusters, whereas dot size indicates the percentage of cells expressing the specified gene. The table summarized the results of differential gene expression analysis of DPsmall → DPCD69+/SP transition using a Wilcoxon rank sum test (Seurat FindMarkers function used with default parameters). Only the genes corresponding to the γδ TCR-induced signature are shown. The average log fold change (FC) corresponds to the log fold change of the average expression between the two groups. Positive values indicate that the gene is more highly expressed in the DPCD69+/SP group. The pct.1 DPCD69+/SP and pct.2 DPsmall values correspond to the percentage of DPCD69+/SP and DPsmall cells where the gene is detected, respectively. Adjusted P-value (p_val_adj) is based on Bonferroni correction using all genes in the dataset. The genes not differentially expressed are denoted as “NA” (not available). Accordingly, the γδ TCR-induced signature can be divided into two gene sets: gene set #1 consists of genes that are not upregulated in DPCD69+/SP cells and gene set #2 consists of genes upregulated in DPCD69+/SP cells. P-values are indicated for both gene sets. Therefore, gene set #1 was defined as the “γδ TCR only” signature and gene set #2 as the “αβ and γδ TCR shared” signature. Commonalities and differences in the transcriptional signatures induced by the γδ TCR and αβ TCR in adult thymusWhen the γδ TCR-induced signature was applied to Dataset 2 (Fig 4C), high AUCell scores were observed for both γδ T cells and DPCD69+/SP cells, suggesting that a part of the γδ TCR-induced signature is also induced by the αβ TCR during the DPsmall → DPCD69+/SP transition. The DPsmall → DPCD69+/SP transition is not associated with proliferation (Mingueneau et al, 2013), facilitating the comparison of the αβ TCR-induced signature with our γδ TCR-induced signature which is pruned of genes involved in the cell cycle (Fig EV3B). It permitted to deconvolute the γδ TCR-induced signature into a component expressed in the sole DN3b γδ+ cells (denoted as the “γδ TCR only signature”) and a component expressed in both DN3b γδ+ and DPCD69+/SP cells (denoted as the “γδ and αβ TCR shared signature”; Figs 4D–F and EV2D). The γδ TCR-only signature comprised the Etv5 and Sox13 transcripts that code for transcription factors specifying the effector function of Tγδ17 cells, Blk, a Src family PTK implicated in Tγδ17-cell development (Laird et al, 2010), and Cpa3 which codes for carboxypeptidase A3 (Turchinovich & Hayday, 2011). The γδ and αβ TCR shared signature comprised of Klf2; Sesn3, coding for a member of the sestrin family of stress-induced proteins; Clec2d, coding for a member of the natural killer cell receptor C-type lectin family; Itgb2, coding for an integrin β chain also known as LFA-1; Tes, coding for a scaffold protein playing a role in the actin cytoskeleton; Cd53, coding for a member of the transmembrane 4 superfamily; and Cd52, coding for CAMPATH-1, as well as transcripts coding for the CD5 and CD6 transmembrane receptors which both play an important role in regulating TCR signals (Mori et al (2021); Fig EV3B). Therefore, apart from the genes involved in the cell cycle and in metabolic activity, the transcriptional signature induced by the γδ TCR at the DN3a → DN3b γδ+ transition was more similar to that induced by the αβ TCR at the DPsmall → DPCD69+/SP transition than to that induced by the pre-TCR.
scRNAseq analysis of adult DN3 cells expressing signaling-defective γδ TCRTo support on the basis of genetic evidence the role of γδ TCR-triggered signals in γδ T–cell lineage commitment and specification, we exploited Trdc-H2BEGFP mice (Prinz et al, 2006). Those mice expressed an eGFP reporter gene under the control of the gene coding for the TCRδ chain, facilitating tracking of the earliest steps of γδ T-cell lineage commitment. T-cell development is blocked at the DN3 stage in Trdc-H2BEGFP mice deficient for the LAT adaptor protein (Lat−/− x Trdc-H2BEGFP mice) (Nunez-Cruz et al, 2003), suggesting that LAT is required for both pre-TCR and γδ TCR signaling. Approximately 0.3% of the DN3 cells found in Lat−/− x Trdc-H2BEGFP thymus expressed intermediate level of γδ TCR at their surface (denoted in short as DN3 γδint cells; Fig EV4A), demonstrating that progression beyond such DN3 γδint stage is controlled by γδ TCR signals requiring the LAT adaptor (Prinz et al, 2006). Moreover, the lack of CD5 expression and of CD127 downregulation on those LAT-deficient DN3 γδint cells suggested that at least part of the γδ T-cell specification program was not induced in the absence of instructive γδ TCR signals (Prinz et al, 2006). Consistent with that view, infection of LAT-deficient DN3 γδint cells with LAT-expressing retrovirus induced the surface expression of CD5 and of high levels of γδ TCR as observed on a fraction of WT DN3b γδ+ cells (Muro et al, 2019).
Click here to expand this figure.
Figure EV4. Workflow used for scRNAseq analysis of DN3 γδ− and γδint cells from Lat−/− thymus
Flow cytometry plots showing EGFP and surface TCR γδ expression in DN1, DN2, DN3, and DN4 subsets from Trdc-H2BEGFP (top panels) and Lat−/− × Trdc-H2BEGFP (bottom panels) mice. Note that the TCR γδ+ cells corresponding to the DN1 stage correspond to mature γδ T cells that present a CD127hi phenotype and they were thus excluded from the analysis. Schematic representation of the workflow used for scRNAseq analysis of DN3 γδ− and DN3 γδint cells from thymus (n = 30) of Lat−/− × Trdc-H2BEGFP mice and the generation of Dataset 3. Two single-cell 3’ gene expression libraries containing 18,000 thymoctes and 500 spike-in B cells were constructed and individually sequenced. FACS plots showing the gating strategy used to sort DN3 γδ− and DN3 γδint cells from Lat−/− × Trdc-H2BEGFP mice. Numbers indicate percentages of cells found in each of the specified gates.scRNAseq approaches offer the unprecedented possibility to analyze with single-cell resolution the transcriptome of those rare LAT-deficient DN3 γδint cells. More specifically, it offered the opportunity to determine whether the expression of a γδ TCR at their surface was associated with most hallmarks of γδ T-cell lineage specification (Fig 4), or constituted their unique γδ T-cell lineage marker. This last occurrence will formally demonstrate at single-cell resolution that the signals delivered by the γδ TCR-LAT axis have an instructive role in adult γδ T-cell lineage commitment. Using a workflow similar to that developed for WT DN thymocytes (Fig 1A), the LAT-deficient DN3 γδ− and LAT-deficient DN3 γδint cell subsets found in Lat−/− x Trdc-H2BEGFP thymus were sorted and subjected to scRNAseq (Fig EV4B and C). After controlling the quality of our sequencing data (see Materials and Methods), the resulting LAT-deficient DN3 γδ− and LAT-deficient DN3 γδint cell datasets comprised of 7704 and 5979 cells, respectively, that were merged with Dataset 1 to generate Dataset 3. The UMAP plot corresponding to Dataset 3 had the same overall shape as that obtained for Dataset 1 (Figs 2 and 5A). A γδ T-cell and αβ T-cell lineage branches emerged from DN3a cells and LAT-deficient DN3 γδ−, and LAT-deficient DN3 γδint cells were located on the αβ T-cell lineage branch in close contiguity to WT DN3a cells (Fig 5A).

Figure 5. Single-cell RNAseq analysis of DN3 γδ− and DN3 γδint cells from Lat−/− thymus
A, B. UMAP plots of Dataset 3 which contains five WT (DN3a, DN3b γδ+, DN4 γδ+, DN3b γδ−, and DN4 γδ−) and two Lat−/− (DN3 γδ− and DN3 γδint) scRNAseq datasets. The UMAP plot is colored according to sorted samples (A), and to expression levels of the specified genes (B). C. Heatmap showing scaled expression of top 25 DEG characterizing each of the seven sorted samples of Dataset 3. The names of the sorted samples are specified at the top of the heatmap, and 3,000 cells were randomly selected for each sample. Each column represents the expression profile of a single cell. The sample from which a DEG is derived is indicated by colored bars on the left. Bar superpositions specify DEG that are found in more than one sample. The genes displayed in panel B are highlighted with a star. Gene expression is color coded with a scale based on z-score distribution, from −2 (purple) to 2 (yellow).
留言 (0)