Synthesis, spectroscopic, theoretical and biological evaluation of novel Schiff base complexes of divalent transition metals
Figure S1 Mass spectral profile of Schiff base (FMBT)
Figure S2 Mass spectral profile of Co:FMBT (1:1) complex
Figure S3 Mass spectral profile of Zn:FMBT (1:1) complex
Figure S4 Mass spectral profile of Ni:FMBT (1:2) complex
Figure S5 Mass spectral profile of Cu:FMBT (1:2) complex
Figure S6 Mass spectral profile of Pd:FMBT (1:2) complex
Figure S7 1H-NMR spectrum of Schiff base (FMBT)
Figure S8 1H-NMR spectrum of Zn:FMBT (1:1) complex
Figure S9 1H-NMR spectrum of Zn:FMBT (1:2) complex
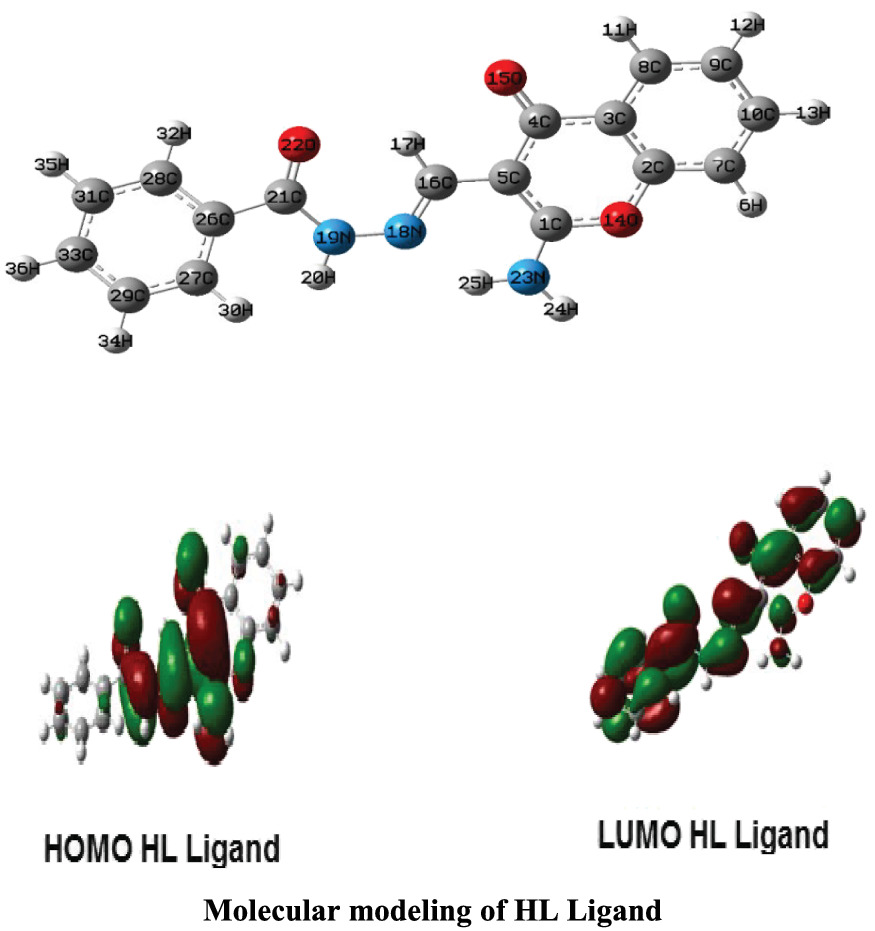
Figure S10 Frontier Molecular Orbitals (FMOs) of FMBT and M:FMBT (1:1) complexes with their respective energies (eV)
Figure S11 Frontier Molecular Orbitals (FMOs) of M:FMBT (1:2) complexes with their respective energies (eV)
Figure S12 Plots for the kinetics applied on the second (a, b, c, d) and third (e, f, g, h) stages of thermal decomposition

Comments (0)