
記住我


Untreated dental decay is recognized as a global problem affecting all age groups.1, 2 This condition represents not only the outcome of a multifactorial disease process (dental caries), the lack of treatment can also indicate a failure to meet the need for dental care. In many respects, the burden of untreated dental decay in a population can frame a call to action for all stakeholders in the dental service delivery system.3 In order to make appropriate policy changes, population-level assessments that account for social and demographic factors must be examined with respect to untreated dental decay.4-7 This paper provides actionable data to drive policy development around the role of grams of sugar from sugar-sweetened beverages (SSBs) and untreated dental decay using population-level data for adults in the United States.
Published research has made a strong case for a causal association between sugar from SSBs and dental caries.8 As a disease process, dental caries is the interplay of diet and bacterial factors to create a low pH microenvironment where demineralization of tooth structure outpaces remineralization over time.9 Undoubtedly, fermentable carbohydrates provide a causal pathway for dental caries.10-12 Studies have established the importance of sugar intake from beverages.8, 13 While sugar from other sources (i.e., candy, bakery items and chewing gum) and other fermentable carbohydrates contribute to dental decay, sugar-sweetened beverages (SSBs) have been identified by policy makers as a focus for action.14-20 It should be noted that in addition to the role sugar plays in dental disease, the World Health Organization has recommended reductions in sugar intake for adults and children to address a broad range of health issues arising from a role for sugar in poor dietary quality and obesity.21
In 2019, expenditures for dental care in the United States were estimated at $143 billion (US dollars).22 Unmet need for treatment represents an additional burden that is not captured in expenditure data. Therefore, this study investigated the association between sugar from SSBs and untreated dental decay using data from the 2013–2016 National Health and Nutrition Examination Survey (NHANES). The aim of this study was twofold. First, to test the association between grams of sugar consumed from SSBs and (a) the presence or absence of untreated decay; and (b) the number of untreated decayed teeth. Second, in order to frame the policy implications, population attributable risk (PAR) per cent was used to estimate treatment costs. As a policy tool,23 PAR provides a simple estimation of the burden of untreated dental decay attributable to sugar from SSB consumption among US adults.
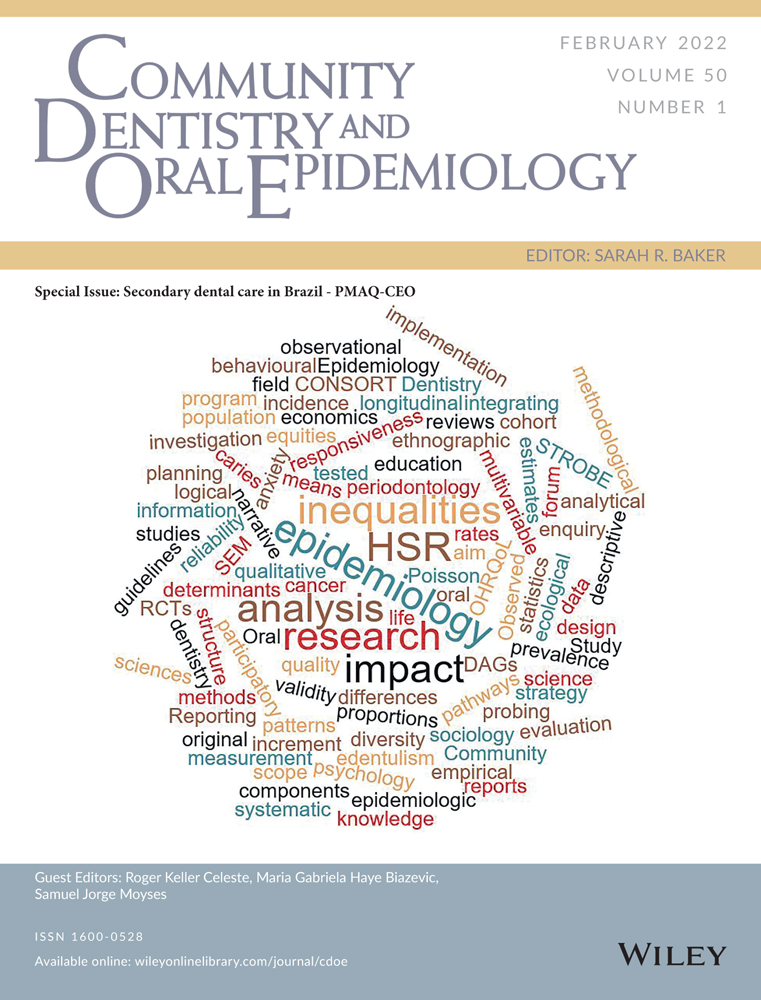
2 METHODSFigure 1 shows how the study sample was derived in 2019 from the public-use data files for two cycles of NHANES: 2013–2016. NHANES is a public-use de-identified data set containing information on behavioural, demographic and environmental characteristics. In additional to these characteristics, the cross-sectional NHANES survey conducted household interviews and standard oral health examinations. All observations were weighted to a representative sample of the non-institutionalized, civilian, household population of the United States.

Flow diagram for study inclusion
2.1 Procedures 2.1.1 OutcomesAnalysis was limited to persons 20 years and older with at least 1 permanent tooth. For these individuals, each tooth surface was examined and scored in NHANES by calibrated, licensed dentists.24 Tooth level scores were summed to provide an individual score representing the number of permanent decayed, missing and filled teeth (DMFT). In the dental protocol, untreated decay was assigned when cavitation at the dentine level was present at the examination. In this study, permanent tooth decay status was summarized as (a) presence or absence of untreated decay; and (b) number of untreated decayed teeth.
2.1.2 Primary predictor: sugar from SSBsNHANES obtained 24-h multiple pass dietary recall data from in-person interviews. Dietary data files were sent electronically from the field and were imported into Survey Net, a computer-assisted food coding and data management system developed by United States Department of Agriculture (USDA).25
An algorithm to convert the reported beverages and their sugar content was used to link to USDA's Food and Nutrient Database for Dietary Studies (FNDDS). The basis for the nutrient values in FNDDS is detailed in the documentation and available at http://www.ars.usda.gov/nea/bhnrc/fsrg.
Following previous analyses,26 SSBs included regular soda, sports and energy drinks, sweetened coffees and teas, fruit drinks (including sweetened bottled waters and fruit juices), and other beverages fitting this definition (including horchata and sugar cane beverages). SSBs did not include diet drinks, which were defined as approximately, <40 kcal/240 ml of the beverage; 100% fruit juices; beverages sweetened by the participant, including coffee and teas; alcohol; or flavoured milks. For beverages that met the criteria of SSBs, the total number of grams of sugar from the SSBs per participant was summed over the 24-h dietary recall period.
Grams (g) of sugar from SSBs was assessed as a categorical variable in two ways, using four levels to examine the presence of a dose-response pattern and using three levels to simplify the findings for policy development. In both approaches, intake of 0 g of sugar from SSBs was used as the reference group and values were rounded to one decimal place for simplicity of presentation. At four levels, the study sample with >0 intake of sugar from SSBs was defined by using tertiles. The four levels were zero, >0 but <34.8 g, 34.8 g to 73.9 g, and 74.0 g or greater. The data pattern was simplified to three levels for the calculation of population attributable risk, by splitting the group with non-zero intake of sugar from SSBs at the median. The three levels for this were as follows: 0 g of sugar from SSBs; more than 0 but <46.8 g; and 46.8 g or more of sugar from SSBs. As a frame of reference, a typical 12 oz sugar-sweetened soft drink contains 39 g of sugar and a 20 oz soft drink contains 65 g of sugar.
Covariates of interest available in NHANES were smoking status, age, self-reported race/ethnicity, gender, household income level as measured through the federal poverty income ratio—a ratio of family income to poverty guidelines—as ≤130%, 131%–350% and >350%, education level (identified by highest level attained: less than high school, high school graduation, some college, college and above), and dental visit behaviour (as whether or not there was a dental office visit in the past 12 months). Smoking status was self-reported as current, former or never.
2.2 Statistical analysisMethods to account for the sampling weights were incorporated into data analysis by using STATA version 13.1. Untreated decay was captured in two ways: (a) a binary value indicating the presence of any decay and (b) a count indicating the total number of untreated decayed teeth.
The association between sugar from SSBs and the presence of any untreated decay was tested by using a generalized linear model with a Poisson distribution and log-link function regression with a binary dependent variable. Prevalence ratios were calculated by exponentiating regression coefficients. Negative binomial regression was used to test the relationship between sugar from SSBs and the number of teeth with untreated decay. To illustrate the predicted values of these two outcomes by sugar consumption level, graphs were created to show post-estimation marginal standardization for regressions adjusting for the distribution of other covariates.27 All analyses used the Day 1 dietary sampling weights to account for the complex survey design of NHANES as well as oversampling, non-response, noncoverage and day of the week.
The PAR per cent serves as a policy tool that provides an estimate of the amount of untreated decay that could be averted if sugar intake from SSBs was reduced.23 To be meaningful the PAR assumes that a causal relationship has been established between the risk factor and disease outcome. Given this assumption, PAR requires valid estimates of exposure in the population of interest and estimate of relative risk. A simple estimate of the economic cost for treatment of untreated dental decay was computed by using values from the 2013 Survey of Dental Fees conducted by the American Dental Association (https://www.aapd.org/assets/1/7/PolicyCenter-2013_Survey_of_Dental_Fees.pdf) based on a periapical radiograph, and a simple one-surface amalgam restoration. Population estimates were obtained from US Census estimates for adults aged 20 and older available on the Census Reporter website (https://censusreporter.org/profiles/01000us-united-states/). The average for 2013–2016 was used to compute number of adults with untreated decay in the US population. The adjusted prevalence rate ratio obtained from regression results was used to derive an estimate of relative risk (RR) using consumption of 46.8 g of sugar from SSBs as this represented the median among US adults who reported consuming SSBs. Population attributable risk per cent28 estimated the number of adults in the United States with untreated decay that is attributable to sugar intake from SSBs. The formula uses estimates of RR and prevalence of exposure (p) as follows:
The relative increment in number of untreated decayed teeth was derived from the negative binomial model.29 In this manner, a conservative estimate of treatment costs to address a single surface lesion attributable to sugar from SSBs was derived for US adults where the base cost would be $322 to restore one tooth and an additional $125 to restore a second tooth at the same visit. These estimates include the fee for a comprehensive examination and full-mouth series of radiographs.
3 RESULTSThe sample consisted of 9001 adults with complete data for the variables of interest (Figure 1). Table 1 shows the distribution of the study sample. Over 50 per cent of adults consumed no sugar from SSBs (53.2%, 95% confidence interval (CI): 51.0, 55.4). About 25 per cent of the US adult population had at least one tooth with untreated caries. Only about 8 per cent (95% CI: 7.4, 8.9) of the US adult population had never had any dental decay. The mean number of untreated decayed teeth was 0.8 (95% CI:0.7, 0.9). On average in the United States, adults had about 11 decayed, missing and filled (DMF) permanent teeth (95% CI:10.8, 11.4).
TABLE 1. Selected characteristics of the study participants Characteristic n a %, Mean (weighted) 95% CI Age (years) 20–44 3918 44.8 42.2 47.4 45–64 3064 35.9 33.9 38.1 65+ 2019 19.2 17.7 20.8 Sex Female 4651 51.4 50.2 52.6 Male 4350 48.6 47.4 49.8 Race/ethnicity Non-Hispanic white 3660 66.6 61.5 71.3 Non-Hispanic black 1836 10.8 8.4 13.7 Non-Hispanic Asian 914 5.4 4.1 7.1 Hispanic 2291 14.0 10.9 17.8 Other 300 3.2 2.6 4.0 Federal poverty income ratiob ≤130% 2935 22.8 19.9 26.1 131%–350% 3372 35.7 33.7 37.8 >350% 2694 41.4 37.5 45.5 Education level Less than high school 1845 13.5 11.4 15.9 High school 2018 21.6 19.8 23.6 Some college 2801 33.4 31.6 35.3 College and above 2337 31.5 27.9 35.3 Dental visit in past 12 months Yes 4949 60.0 57.0 62.9 No 4052 40.0 37.1 43.0 Smoking status Current 1763 18.7 17.3 20.2 Former 2160 25.3 23.7 26.9 Never 5078 56.0 54.1 57.8 Sugar from SSB consumption None (0 g of sugar) 4465 53.2 51.0 55.4 More than 0 but <38.4 g 1560 15.2 14.1 16.5 38.4 g to <74.0 g 1606 16.9 15.8 18.1 74.0 g or more 1370 14.6 13.1 16.3 Untreated dental caries present Yes 2617 25.1 22.9 27.5 No 6384 74.9 72.5 77.1 Any Decayed, Missing, or Filled (DMF) teeth Yes 8281 91.9 91.1 92.6 No 720 8.1 7.4 8.9 # of teeth with untreated caries (mean) 9001 0.8 0.7 0.9 # DMF teeth (mean) 9001 11.1 10.8 11.4 National Health and Nutrition Examination Survey (NHANES) 2013–2016. n = 9001.Regression results are displayed in Table 2. The first set of columns present prevalence ratios (PRs) and 95 per cent CIs for the Poisson likelihood of having at least one tooth with untreated decay. The last set of columns present the regression results for a negative binomial model estimating the association with mean number of untreated decayed teeth. Both models show consistent results.
TABLE 2. Multivariable models for association between sugar intake from sugar-sweetened beverages and selected confounders with untreated decay among US Adults, NHANES 2013–2016 N = 9001 Presence of untreated dental caries (yes/no) Number of untreated decayed teeth Characteristic Adjusted Prevalence Ratio 95% Confidence Interval Upper limit Lower limit p > t Coefficient95% Confidence Interval
Upper limit Lower limit
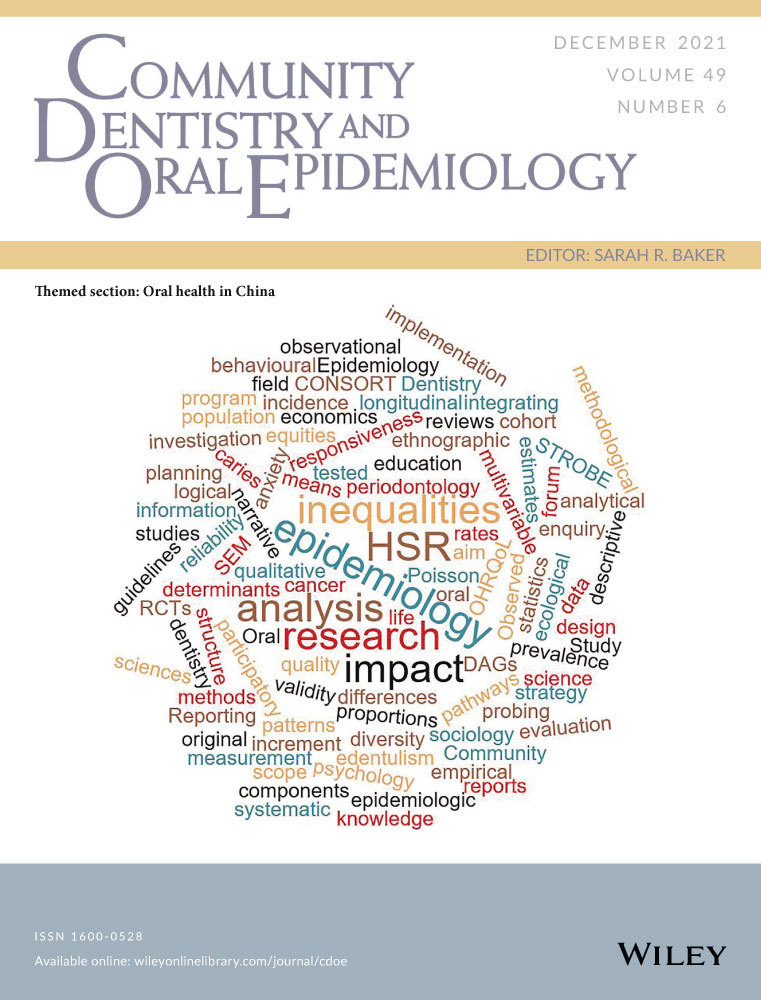
p > t Sugar from SSB consumption (vs. None) More than 0 and <34.8 g 1.1 0.90 1.3 .44 0.1 −0.1 0.4 .35 34.8 g to <74.0 g 1.1 0.99 1.3 .07 0.4 0.1 0.6 .006 74.0 g or more 1.4 1.2 1.6 <.001 0.6 0.4 0.8 <.001 Smoking (vs. Never Smoking) Former 1.1 0.95 1.2 .27 0.1 −0.1 0.3 .34 Current 1.3 1.2 1.5 <.001 0.6 0.4 0.8 <.001 Age (vs. 20–44) 45–64 0.95 0.84 1.1 .39 −0.2 −0.4 0.0 .11 65+ 0.70 0.57 0.85 .001 −0.5 −0.8 −0.2 .002 Female 0.90 0.80 1.0 .09 −0.3 −0.5 −0.1 .01 Race/ethnicity (vs. non-Hispanic white) Non-Hispanic black 1.4 1.2 1.6 <.001 0.4 0.2 0.5 <.001 Non-Hispanic Asian 0.96 0.77 1.2 .74 0.1 −0.3 0.5 .69 Hispanic 1.1 0.97 1.3 .13 0.1 −0.2 0.3 .66 Other 1.1 0.79 1.4 .71 0.1 −0.3 0.5 .60 Poverty income ratio (vs. ≤130%) 131%–350% 0.89 0.80 1.0 .05 −0.2 −0.3 −0.1 .001 >350% 0.59 0.52 0.68 <.001 −0.9 −1.1 −0.7 <.001 Education (vs. less than high school) High school 0.97 0.87 1.1 .41 0.0 −0.2 0.2 .93 Some college 0.80 0.70 0.91 .002 −0.3 −0.5 −0.1 .002 College and above 0.54 0.44 0.67 <.001 −0.8 −1.1 −0.6 <.001 Dental visit in past year (vs. no) 0.57 0.51 0.65 <.001 −0.7 −0.9 −0.6 <.001Those consuming high levels of sugar intake from SSBs had a higher prevalence of untreated decay compared to those reporting no sugar intake from SSBs. The adjusted prevalence ratio was 1.4 (95% CI: 1.2, 1.6) for those consuming 74.0 g or more compared to those consuming no sugar from SSBs. The number of untreated decayed teeth was positively associated with the amount of sugar intake from SSBs: 0.4 (95% CI: 0.1, 0.6) at intake of 34.8 to 74.0 g; and 0.6 (95% CI: 0.4, 0.8) at 74.0 g or more relative to an expected mean in those who consume no sugar from SSBs. Figure 2 shows predicted values for the outcomes with increased sugar from SSBs on prevalence untreated decay (Figure 2 panel A) and number of untreated decayed teeth (Figure 2 panel B).

Predicted values for Prevalence of (A) Untreated Decay and (B) Number of Teeth with Untreated Decay in US Adults by amount of sugar intake from sugar-sweetened beverages (SSBs): NHANES 2013–2016 (n = 9001)
The models (Table 2) show that adults aged 65 and older were less likely to have untreated decayed teeth than adults aged 20–44 years (PR 0.70, 95% CI: 0.57, 0.85). They also had statistically lower numbers of untreated decayed teeth (p = .002). Moreover, non-Hispanic Black adults had a higher likelihood of untreated decay relative to non-Hispanic whites after controlling for income and education (PR 1.4, 95% CI: 1.2, 1.6). Socioeconomic status showed strong ‘dose-response’ associations with untreated decay—those with higher income relative to poverty (high income PR 0.59, 95% CI: 0.52, 0.68 and moderate income PR 0.89, 95% CI: 0.80, 1.0 compared to low income) and more education (College and above PR 0.54, 95% CI: 0.44, 0.67 and some college PR 0.80, 95% CI: 0.70, 0.91 compared to less than high school education) had lower prevalence of untreated decay. Individuals who reported having a dental visit in the past year were less likely to have untreated decay (PR 0.57, 95% CI: 0.51, 0.65). Current smokers were more likely to have untreated decay relative those who reported never smoking (PR 1.3, 95% CI: 1.2, 1.5).
PAR results shown in Table 3 were estimated by using the prevalence ratio from a multivariable model with non-zero sugar intake divided at the median. In this model, the adjusted prevalence was 30 per cent greater for untreated decay for those consuming more than the median amount of sugar from SSBs compared to those consuming no sugar from beverages (PR 1.3, 95% CI: 1.1, 1.5). PAR results suggest that 6.8 per cent of US adults had untreated decay attributable to sugar intake from SSBs (Table 3). This translates to 3.6 million people who had untreated decay because of high SSB consumption. Estimates from the negative binomial model show that high SSB consumption contributed to an average of two additional decayed teeth among those with untreated decay. Table 3 shows that the cost of treatment can be estimated from these data. The economic impact is conservatively estimated at $1.6 billion (USD).
TABLE 3. Population Attributable Risk (PAR) per cent for Sugar from SSBs and untreated dental decay among US Adults Estimated RR at exposure level Prevalence of exposure to high sugar (46.8 g or more) from SSB intake % of cases of untreated decay in the US Adult Population attributable to SSBs Estimated number of adults with untreated decay attributable to SSBs Estimated number of teeth with untreated decay attributable to SSBs Estimated costs to restore these teeth
留言 (0)