
Remember me
Acute myeloid leukemia (AML) is a type of clonal malignancy affecting hematopoietic stem progenitor cells. In bone marrow, the proliferation of abnormal primitive and immature cells (leukemia cells) impairs normal hematopoiesis. Clinical manifestations include anemia, bleeding, infection, and infiltration of liver, spleen, and lymph nodes. Most AML cases have a poor prognosis, which is often life-threatening if not properly managed.1-6 Acute promyelocytic leukemia (M3) is a subtype of AML classified as AML-M3 with t (15; 17) (q24; q21) PML-RARA; most RARA-negative M3 has TBL1XR1-RARA translocations7, 8 and rare ZBTB16-RARA translocation.9 M3 patients are predisposed to disseminated intravascular coagulation (DIC) and subsequent bleeding, which is the leading cause of death. DIC severity is known to be associated with the percentage of myeloid leukemia cells, but not with bleeding.10
CD59 is a glycosylphosphatidylinositol (GPI) anchoring protein encoded by PIG-A gene, which can block the formation of cell membrane attack complex and protect cells from complement-mediated cytolysis.11 Although CD59 deficiency on the cell surface mainly manifests in paroxysmal nocturnal hemoglobinuria (PNH), it has also been identified in systemic lupus erythematosus,12 aplastic anemia (AA),13 stroke,14 and childhood relapsing immune-mediated polyneuropathy.15 Nakahata et al. reported that a patient with PNH and myelofibrosis turned into acute myeloid leukemia after treatment. Flow cytometry (FCM) revealed that 87.3% of primary cells lacked CD59, suggesting that leukemia primitive cells of this patient might be derived from PNH clone.16 A study from Wei et al. showed that the deficiency of CD59 expression in M3 was significantly higher than that in other AML.17 Interestingly, we observed that M3 patients with DIC were linked to CD59 deficiency at our center, but the specific mechanism remains unclear and requires further studies. Fluorescently labeled aerolysin (FLAER) can specifically bind to GPI protein on cell membrane, directly reflecting anchor protein deficiency.18 At present, FCM detection of CD59 and FLAER deficiency on cell membrane surface has become the preferred experimental method for diagnosing PNH, with FLAER analysis being more specific and sensitive to PNH cloning.19 As a result, FCM is a preferable method for detecting CD59 and FLAER expression.
As CD59 deficiency and its association with DIC were identified in AML, we hypothesize that CD59 and FLAER deficiencies are linked to coagulation function in AML. Moreover, a study from Kulagin et al. indicated that a minor population of CD59− cells represents a reliable marker of a positive immunosuppressive therapy (IST) response and a favorable prognosis in AA patients.20 Thus, the significance of CD59 and FLAER in AML patients remained obscure. FCM was used to determine the proportion of CD59 level and FLAER in AML patients, as well as the correlation and significance between CD59 level and clinical indicators to determine its value in AML.
2 MATERIALS AND METHODS 2.1 PatientsA total of 161 AML patients were admitted to the Tianjin Medical University General Hospital between January 21, 2018, and March 22, 2019. The patients were classified based on the 2016 World Health Organization (WHO) and French-American-British (FAB) classifications; none of patients had a history of PNH. A total of 70 males and 91 females, with a median age of 58 years from 16 to 80, were divided into M3 (60) and non-M3 (101) groups. Complete remission (CR) was defined as less than 5% bone marrow blasts and assessed by the investigator based on hematology and myelogram indexes. Table 1 summarizes the characteristics of 161 AML patients. To explain whether there is a relationship, besides CD59 and FLAER expression, age, sex, PLT, TT, PT, APTT, FIB, D-D, CR, WBC count, and LDH were gathered for correlation analysis (Tables 3 and 4). The study followed the Declaration of Helsinki, approved by the Ethics Committee of Tianjin Medical University General Hospital, and participants provided written informed consent.
TABLE 1. Characteristics of patients with AML (N = 161) Characteristic Disease states Total Complete remission Newly diagnosed Sex, % Male 70 (43%) Age, years Median 58 Range (16–80) FAB, n (%) M2 4 (3) 4 (3) 8 (6) M3 42 (26) 18 (11) 60 (37) M4 18 (11) 34 (21) 52 (32) M5 13 (8) 28 (17) 41 (25) Abbreviation: FAB, French-American-British classifications. 2.2 Flow cytometryPeripheral blood from AML patients was placed in an anticoagulant tube containing heparin. Following that, 10 µl of PerCP-CD34, APC-CD45, PE-CD117 FITC-CD59, and FITC-FLAER, the FITC-IgG1 as isotype control antibodies, the specimens were allowed to incubate at 4°C for 30 min. Next, erythrocytes were lysed with 2 ml of erythromycin for 10 min and centrifuged at 400 g for 5 min. After two washes with phosphate-buffered saline (PBS), the cells were centrifuged at 400 g for 5 min. Before acquisition on FCM, the cells were fixed in 300 µl PBS (106 cells/tube) (Beckman Coulter Inc, US). Kaluza software (Beckman Coulter) was employed for statistical analysis. All antibodies were provided by BD PharMingen company.
2.3 Statistical analysisDifferences between individual groups were analyzed by one-way analysis of variance (ANOVA) or Mann-Whitney U test using Graphpad Prism. The correlation between the two parameters was calculated using Spearman's rank correlation coefficient. Paired Student's t test was performed if suitable. A p-value of less than 0.05 was considered statistically significant. All graphs display means ± SD.
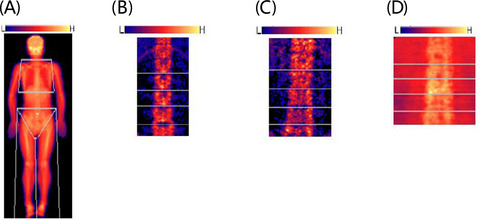
3 RESULTS 3.1 In non-M3 patients, the deficiency of CD59 and FLAER in newly diagnosed group was higher than that in CR groupFCM was utilized to analyze CD59 and FLAER expression in non-M3 group patients, of which 66 were newly diagnosed and 35 were CR cases (Figure 1A). In newly diagnosed group, the mean ratio of CD59− and FLAER− cells in primordial cells was 38.47 ± 27.49% and 33.69 ± 32.93%, respectively (Figure 1B and C). In CR patients, the mean ratio of CD59− cells in monocytes and granulocytes was 21.88 ± 19.22% and 16.33 ± 14.33%, respectively (Figure 1C). Similarly, the median ratio of FLAER− cells in monocytes and granulocytes was 11.61 ± 11.10% and 2.59 ± 2.15%, respectively (Figure 1B). In non-M3 group, the deficiency of CD59 and FLAER in the newly diagnosed group was significantly higher than that in CR group.

Decline of CD59 and FLAER is low in PB of non-M3 patients. (A) An example of a flow diagram for FLAER and CD59 analysis in non-M3. All experiments were performed three times. Scatter plot of FLAER− (B) and CD59− (C) percent of PB samples in 101 non-M3 patients (35 patients in CR group and 66 patients in newly diagnosed group). PC, primordial cell; MC, monocytes; GC, granulocytes. MC and PC were analyzed in CR group; PC was analyzed in the newly diagnosed group
3.2 In M3 patients, the deficiency of CD59 and FLAER in newly diagnosed group was higher than that in CR groupAmong M3 patients, FCM was used to analyze CD59 and FLAER expression in 18 newly diagnosed patients and 42 CR patients (Figure 2A). The expression of CD59− cells in primordial cells (72.96 ± 26.36%) in the newly diagnosed group was significantly higher than in monocytes (21.20 ± 19.94%) or granulocytes (17.08 ± 12.89%) in CR patients (Figure 2B). Similarly, the expression of FLAER− cells in primordial cells (62.66 ± 39.98%) was significantly higher than in monocytes (17.36 ± 17.18%) or granulocytes (15.20 ± 14.00%) (Figure 2C). These results indicate that in M3, the deficiency of CD59 and FLAER in the newly diagnosed group was significantly higher than in CR group. In a word, in AML, the newly diagnosed group had a higher prevalence of CD59 and FLAER deficiency than CR group.

Decline of CD59 and FLAER is low in PB of M3 CR group patients. (A) An example of a flow diagram for FLAER and CD59 analysis in M3 CR group. All experiments were conducted three times. Scatter plot of CD59− (B) and FLAER− (C) percent of PB samples in 60 M3 patients (42 CR group patients). PC, primordial cell; MC, monocytes; GC, granulocytes. MC and PC were analyzed in CR group; PC was analyzed in the newly diagnosed group
3.3 The deficiency of CD59 and FLAER in M3 was higher than that in non-M3Among AML newly diagnosed group, FCM was used to analyze CD59 and FLAER expression in 18 M3 patients (Figure 3A) and 66 non-M3 patients (Figure 3B). The ratio of CD59− and FLAER− cells in primordial cells in M3 patients was higher than that in non-M3 patients (CD59, 72.96 ± 26.36% vs. 41.47 ± 27.49% (Figure 3C); FLAER, 62.66 ± 39.98% vs. 33.69 ± 32.93%) (Figure 3D), with a statistically significant difference (p < 0.05). These results indicated that CD59 and FLAER deficiency in M3 patients was higher than in non-M3. In AML CR group, CD59− and FLAER− expression in monocytes and granulocytes in 42 M3 patients was higher than that in 35 non-M3 patients. CD59 and FLAER expression in AML was presented in Table 2. These results indicated that CD59 and FLAER deficiency in M3 patients was higher than in non-M3 patients.

Decline of CD59 and FLAER is high in PB of AML patients. An example of a flow diagram for FLAER and CD59 analysis in M3 (A) and non-M3 (B). All experiments were performed three times. Scatter plot of CD59− (C) and FLAER− (D) percent in 84 AML patients
TABLE 2. CD59− and FLAER− ratio in AML Group N Detected cell CD59− (%) FLAER− (%) M3 18 PC 72.96 ± 26.36 62.66 ± 39.98 Non-M3 66 PC 38.47 ± 27.49 33.69 ± 32.93 M3 CR 42 MC 21.20 ± 19.94 17.36 ± 17.18 M3 CR 42 GC 17.08 ± 12.89 15.20 ± 14.00 Non-M3 CR 35 MC 21.88 ± 19.22 11.61 ± 11.10 Non-M3 CR 35 GC 16.33 ± 14.33 2.59 ± 2.15 Note MC and PC were analyzed in CR group. Abbreviations: CR, complete remission; GC, granulocytes; MC, monocytes; N, number of patients; PC, primordial cell.To precisely investigate CD59− and FLAER− expression after achieving CR, we examined 19 newly diagnosed AML patients (M3 = 10, non-M3 = 9) and subsequently analyzed the same patients who underwent CR. In M3 newly diagnosed group, CD59− and FLAER− expression levels were higher following CR. Similar results have been observed in non-M3 patients (Table 3). Additionally, these findings indicated that CD59 and FLAER deficiency in newly diagnosed AML was higher than CR.
TABLE 3. Expression of CD59− and FLAER− after achieving CR in AML Group N Detected cell CD59− (%) FLAER− (%) M3 10 PC 71.17 ± 24.24 62.33 ± 45.31 M3-CR 10 MC 30.54 ± 24.02 19.39 ± 6.86 M3 CR 10 GC 9.45 ± 7.02 8.92 ± 8.84 Non-M3 9 PC 33.72 ± 22.93 32.04 ± 29.11 Non-M3 CR 9 MC 15.91 ± 15.34 2.52 ± 1.67 Non-M3 CR 9 GC 3.73 ± 3.56 0.68 ± 0.51 Note MC and PC were analyzed in CR group. Abbreviations: CR, complete remission; GC, granulocytes; MC, monocytes; N, number of patients; PC, primordial cell. 3.4 The decline of CD59 and FLAER was associated with disease progression in AMLThe CD59− level and FLAER− cell ratio of peripheral blood primordial cells in AML patients were compared with those of WBC, platelets, the ratio of primordial cell of peripheral blood, PT, TT, APTT, FIB, D-D, LDH, and other clinical related indexes. The correlation analysis revealed that the average CD59− level in peripheral blood primordial cells of M3 patients was positively correlated with the ratio of primordial cells (r = 0.660, p = 0.003), implying that CD59− cells are linked to clonal proliferation of leukemia cells (Table 4).
TABLE 4. Correlation analysis of CD59−, FLAER− ratio, and clinical indicators in peripheral blood of newly diagnosed AML Clinical index M3 group CD59 M3 group FLAER Non-M3 group CD59 Non-M3 FLAER r p r p r p r p WBC 0.356 0.147 0.306 0.233 0.445 0.178 0.027 0.877 PLT −0.345 0.161 −0.134 0.608 −0.031 0.864 −0.271 0.115 PBPC 0.66 0.003 0.291 0.258 0.22 0.226 0.187 0.283 PT −0.263 0.292 −0.024 0.926 −0.127 0.49 −0.079 0.654 APTT −0.352 0.152 −0.189 0.469 −0.402 0.759 −0.137 0.431 TT −0.044 0.863 −0.386 0.126 −0.231 0.204 −0.151 0.387 FIB 0.307 0.215 0.28 0.277 0.013 0.943 0.096 0.583 D-Dimer 0.105 0.679 0.055 0.833 0.037 0.84 0.046 0.792 LDH 0.315 0.203 0.264 0.306 0.447 0.116 0.156 0.37 Abbreviations: APTT, activated partial thromboplastin time; FIB, fibrinogen; LDH, lactate dehydrogenase; PBPC, peripheral blood primordial cell; PLT, platelet; PT, prothrombin time; TT, thrombin time; WBC, white blood cell. 3.5 The decline of CD59 and FLAER was linked to abnormal coagulation function in newly diagnosed AMLThe newly diagnosed AML patients were divided into CD59− >10% group and CD59− ≤10% group. The results indicated that CD59− >10% group had significantly higher D-D and LDH levels than CD59− ≤10% group, with a statistically significant difference (p < 0.05). When patients were divided into FLAER− >3% and FLAER− ≤3% groups, the results revealed that FLAER− >3% group had significantly higher D-D and LDH levels than FLAER− ≤3% group (p < 0.05). No significant differences were found in other clinical indicators (p > 0.05), as illustrated in Table 5. These results suggest that CD59 and FLAER decline may be correlated with coagulation dysfunction in AML patients.
TABLE 5. Correlation analysis of CD59−, FLAER− ratio, and clinical indicators in peripheral blood of newly diagnosed AML Clinical index CD59 group FLAER group CD59− >10% CD59− <10% p FLAER− >3% FLAER− <3% p WBC 49.16 ± 34.07 50.29 ± 34.63 0.965 45.84 ± 34.58 49.06 ± 37.25 0.765 PLT 63.72 ± 42.45 70.57 ± 52.19 0.569 76.65 ± 23.87 91.43 ± 59.07 0.43 PBPC 47.79 ± 31.86 37.86 ± 36.72 0.253 50.96 ± 28.77 32.07 ± 30.96 0.487 PT 13.08 ± 1.22 12.63 ± 1.74 0.242 12.92 ± 1.40 12.63 ± 1.83 0.886 APTT 29.19 ± 3.06 28.85 ± 3.15 0.66 28.36 ± 2.28 29.50 ± 3.13 0.1 TT 19.76 ± 2.74 20.70 ± 2.60 0.162 20.32 ± 2.54 20.28 ± 2.87 0.954 FIB 3.69 ± 1.58 3.34 ± 1.19 0.325 3.55 ± 1.35 3.11 ± 1.01 0.165 D-Dimer 1524.23 ± 1069.60 966.23 ± 562.39 0.035 1415.50 ± 1049.43 1059.48 ± 594.17 0.008 LDH 545.48 ± 304.66 368.67 ± 211.61 0.01 545.51 ± 257.10 421.65 ± 280.64 0.034 Abbreviations: APTT, activated partial thromboplastin time; FIB, fibrinogen; LDH, lactate dehydrogenase; PBPC, peripheral blood primordial cell; PLT, platelet; PT, prothrombin time; TT, thrombin time; WBC, white blood cell. 4 DISCUSSIONCurrently, studies on CD59 and FLAER decline in AML patients are rare. Studies have demonstrated that CD59 deletion is linked to PIG-A gene mutation, leading to PNH occurrence.21 In this study, we observed the deficiency of CD59 and FLAER expression in AML (Figures 1-3), but the mechanism remains unknown. Interestingly, although a rare PIG-A mutation was identified in almost all healthy controls,22 recent data indicate that most mutations in healthy controls did not originate from stem cells.22-24 Our previous research demonstrated that abnormal expression and mutation of RBPJ gene might contribute to CD59− clonal proliferation.25 In addition, a study from Byrne et al. indicated that PIG-A assay is a sensitive method for serial assessment of genomic instability in mouse models of MDS.26 Therefore, whether PIG-A gene mutation has resulted in the lack of CD59 deficiency in AML remains unclear. In our research, no sequencing of PIG-A gene coding sequences in AML patients indicates that the specific mechanism remains unknown.
CD59 and FLAER deficiency in the newly diagnosed group was higher than that in CR group, consistent with research results of Dulau-Florea AE, in which CD59 and FLAER expression levels change continuously with myeloid cell maturation.27 However, Hernandez-Campo et al. found no significant changes in CD59 expression during development and maturation of myeloid cells.28 In this study, CD59 deletion was positively correlated with peripheral blood protocells (Table 3), implying its association with malignant clonal cell proliferation.
Indeed, we discovered a significant reduction in CD59 and FLAER expression in AML, impairing AML pathophysiology. Recent studies revealed that proportion of T lymphocytes expressing CD59 was significantly higher in the bone marrow of T-ALL patients than in healthy individuals,29 but the molecular mechanism by which this predicts poor prognosis and disease progression remains unclear. Additionally, because abnormal coagulation is the cause of death in AML patients, we discovered that CD59 and FLAER deficiency contributes to higher D-D and LDH levels in these patients (Table 4) and hence strongly recommend CD59 and FLAER monitoring. Wada et al. suggested that procoagulant activity is the most important factor causing DIC in myelogenous leukemia.30 In our study, most people received chemotherapy, and one study indicated that both malignant process and drugs used in combined chemotherapy cause thrombin activation and hypofibrinolysis, resulting in hypercoagulability, which can also cause coagulation dysfunction,31, 32 and this may interfere with our results. Also, no investigations have been reported on the relationship between abnormal coagulation and CD59. Although we observed a significantly higher proportion of AML cases with CD59 and FLAER decline, the underlying mechanism remains unknown due to patient clinical specificity and inevitable experimental limitations.
In conclusion, we identified that CD59 and FLAER decline was associated with leukemia cell proliferation and abnormal coagulation function in AML, particularly in M3. CD59 may serve as a predictor of AML coagulation dysfunction. Further research should be conducted to elucidate the functional role of CD59 and FLAER in leukemia and evaluate whether they can be used in AML treatment.
ACKNOWLEDGEMENTSThis study was partly sponsored by National Natural Science Fund of China (Granted number: 81770118). Graphical abstract is created by Biorender.com.
CONFLICT OF INTERESTThe authors declare no conflicts of interest.
AUTHOR CONTRIBUTIONShunjie Yu, Shanshan Liu and Lijuan Li designed the research study, performed the analysis and wrote the article. Fanqiao Meng analysed the data and participated in part of the writing. Zhaoyun Liu and Xiaotong Ren abstracted the data and assisted in the collection and analysis of the data. Lijuan Li and Rong Fu critically revised the paper, performed data analysis and ensured correct analysis of the data.
The data that support the findings of this study are available from the corresponding author upon reasonable request.
REFERENCES
1Garcia-Manero G, Fenaux P. Hypomethylating agents and other novel strategies in myelodysplastic syndromes. J Clin Oncol. 2011; 29(5): 516- 523. 2Garcia-Manero G. Myelodysplastic syndromes: 2015 update on diagnosis, risk-stratification and management. Am J Hematol. 2015; 90(9): 831- 841. 3Nimer SD. Myelodysplastic syndromes. Blood. 2008; 111(10): 4841- 4851. 4Jabbour E, Takahashi K, Wang X, et al. Acquisition of cytogenetic abnormalities in patients with IPSS defined lower-risk myelodysplastic syndrome is associated with poor prognosis and transformation to acute myelogenous leukemia. Am J Hematol. 2013; 88(10): 831- 837. 5Steensma DP. Myelodysplastic syndromes: diagnosis and treatment. Mayo Clin Proc. 2015; 90(7): 969- 983. 6Arber DA, Orazi A, Hasserjian R, et al. The 2016 revision to the World Health Organization classification of myeloid neoplasms and acute leukemia. Blood. 2016; 127(20): 2391- 2405. 7
Comments (0)