
記住我


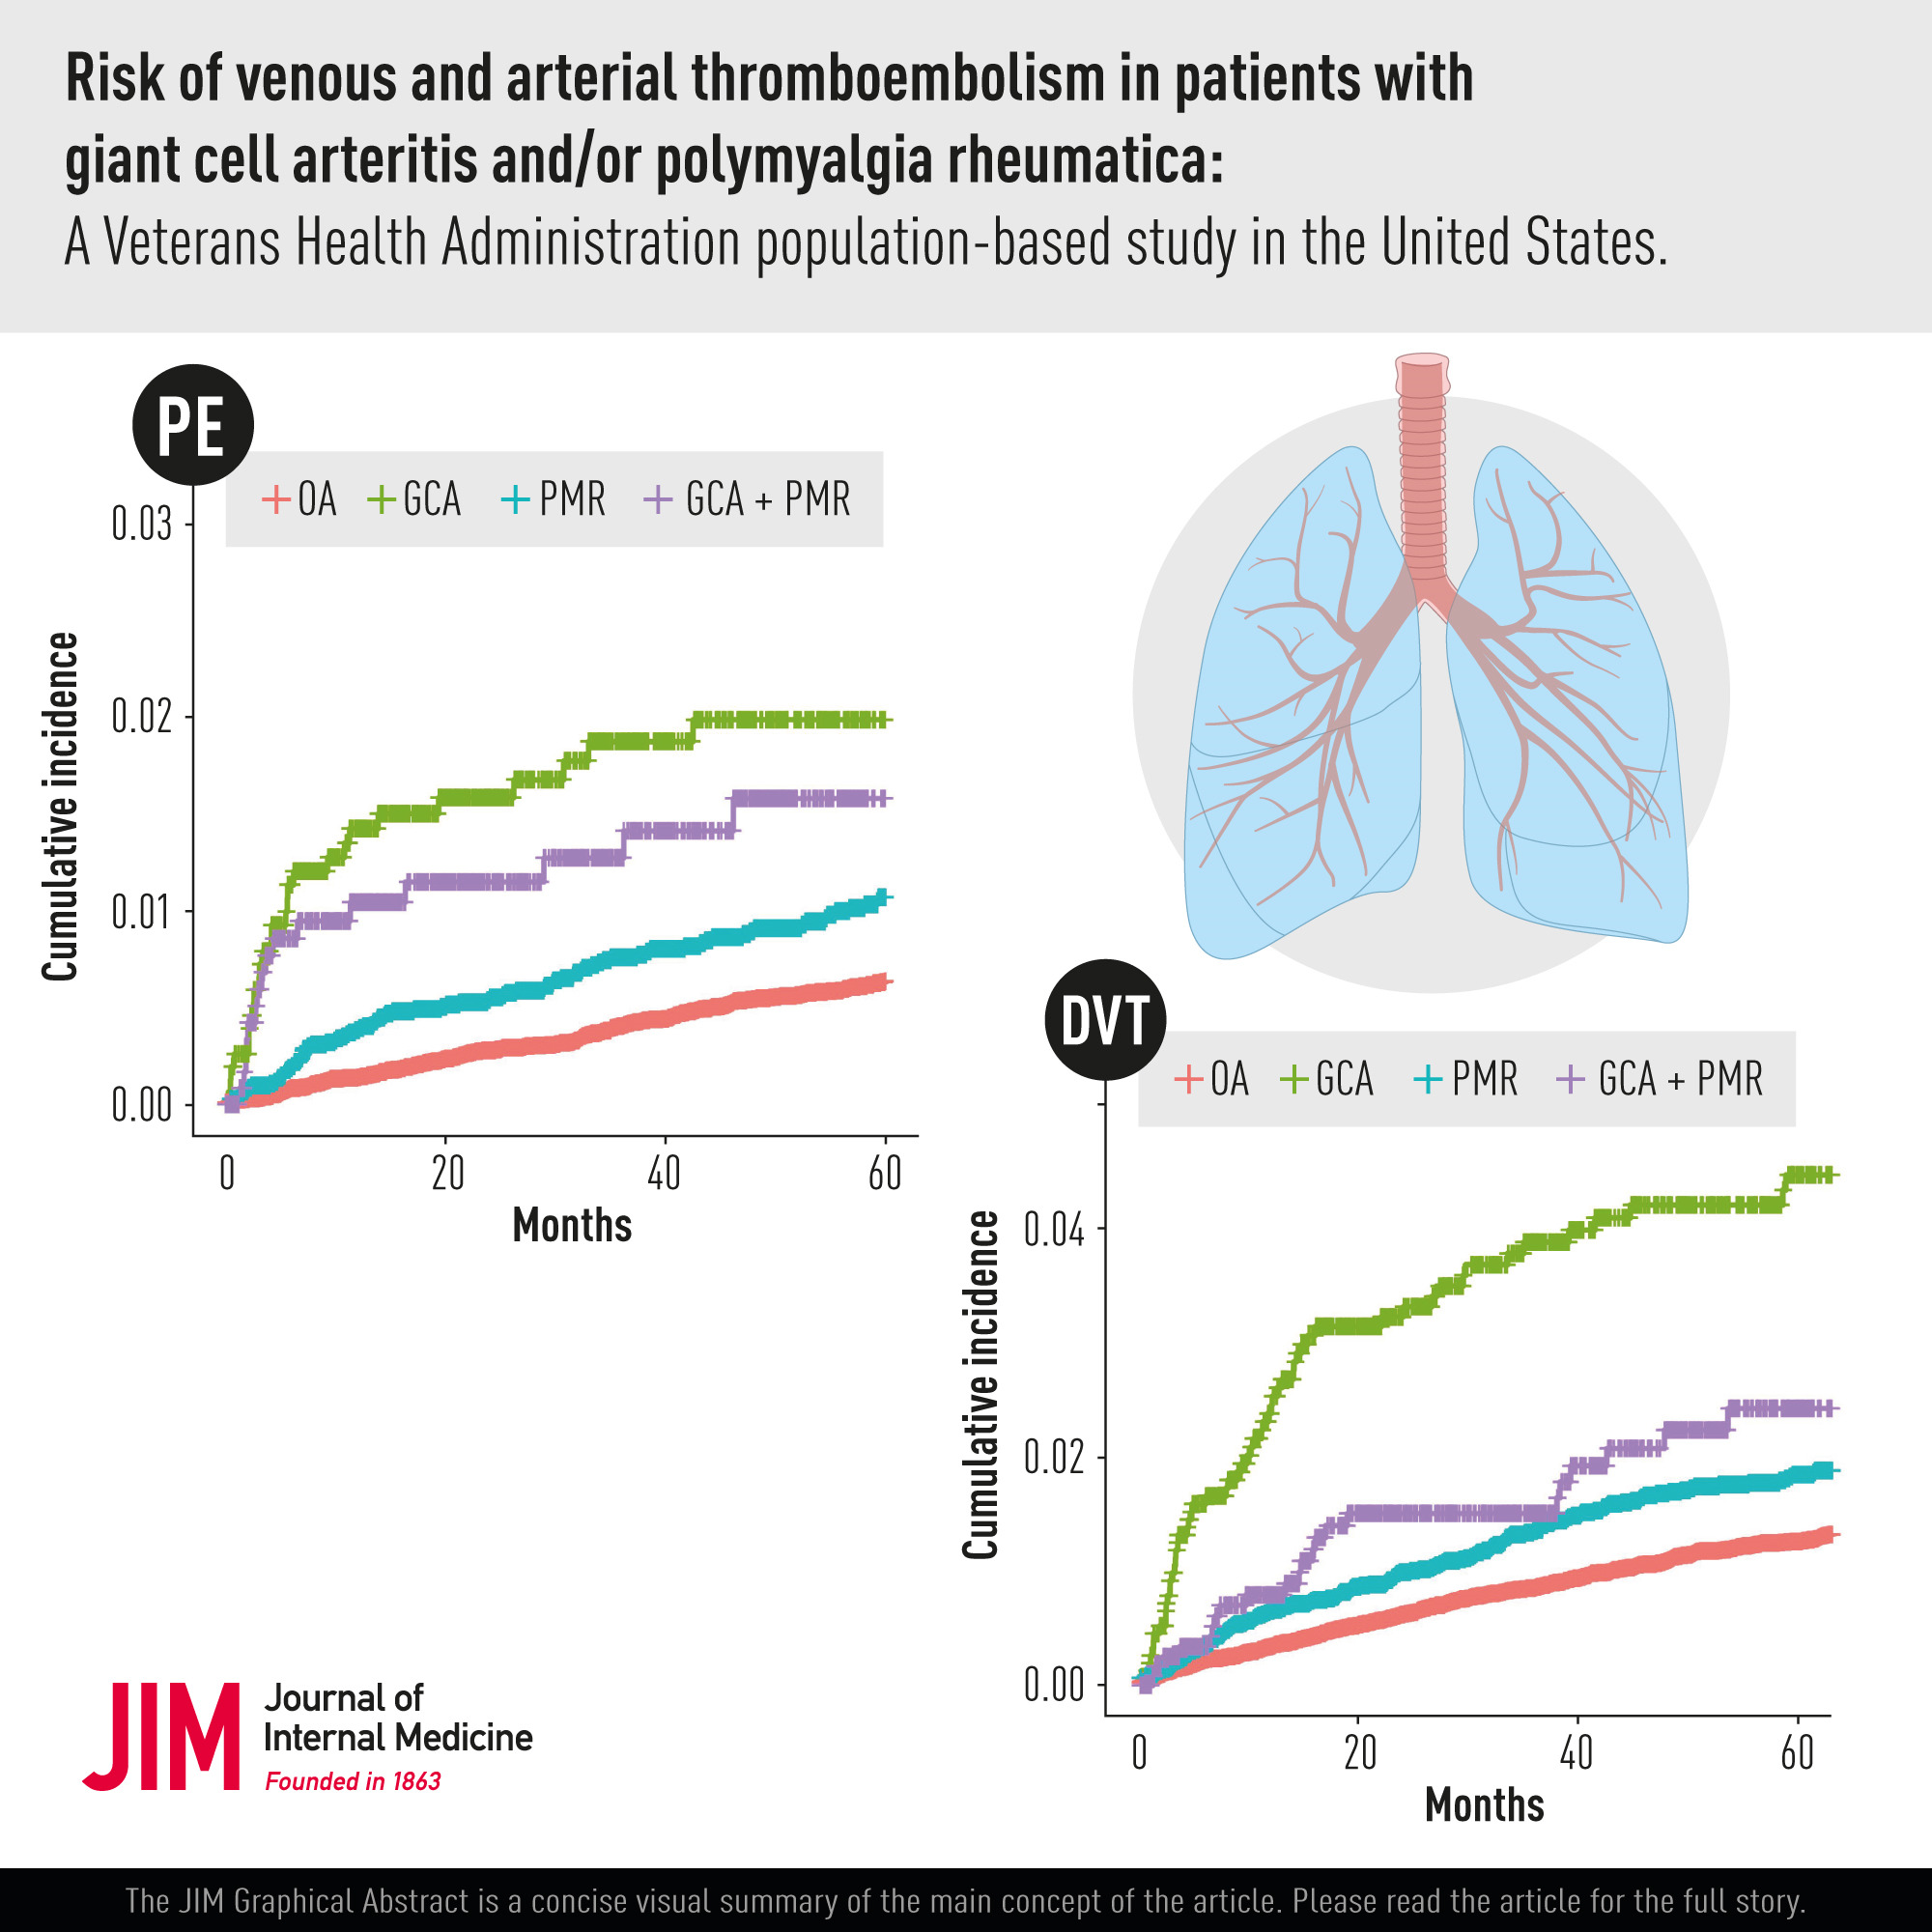

Increasing age and the accumulation of vascular risk factors lead to progressive changes in the vascular wall and atherosclerosis that can result in manifest cerebrovascular disease such as stroke [1], cerebral small vessel disease [2], and vascular dementia [3]. Furthermore, arterial wall remodeling and microvascular damage can contribute to decreased brain function in Alzheimer's disease (AD) [4, 5]. Importantly, information about blood flow in cerebral vasculature may not only be used to characterize advanced disease stages (e.g., decreased flow across a hemodynamically significant stenosis), but can also be used to find early indicators of emerging cerebrovascular dysfunction. Therefore, quantitative measurements of cerebral arterial and venous blood flow can improve our understanding of the multifaceted link between vascular and brain health.
4D flow MRI is a quantitative technique capable of measuring blood flow velocities in the cerebral arterial and venous systems at sub-millimeter resolution. It offers several unique features compared to more traditional approaches to investigate cerebral blood flow. Using a 4D flow MRI scan of around 10 min, it is possible to derive multiple hemodynamic biomarkers such as cerebral arterial flow rates and flow distribution across the major cerebral arteries [6], cardiac-related arterial pulsatility [7], and arterial stiffness [8]. Therefore, 4D flow MRI offers different information compared to transcranial Doppler (TCD), computed tomography angiography, positron emission tomography, or other MRI sequences. In contrast to TCD [9], a technique that is used to assess blood flow velocities, 4D flow MRI is minimally user dependent, can investigate all major brain arteries and veins in the same scan, is independent of the thickness of the skull bone, and can provide quantitative flow rates (in ml/min). It is more time efficient compared to its predecessor, two-dimensional phase-contrast MRI, where each artery requires one separate MRI scan that also has to be planned in advance and positioned during the scan. The 4D flow MRI technique has the advantage that the decision of what and where to analyze can be made at the postprocessing stage after the investigation of the patient is finished.
The objective of this review is to introduce the concepts involved around 4D flow MRI for cerebrovascular measurements. We explain technical aspects and terminology that are important for understanding the physiology of the hemodynamic biomarkers. We also highlight how the hemodynamic biomarkers can contribute to the characterization of cerebrovascular dysfunction in several neurological diseases.
4D flow MRI acquisitionHere, we introduce the basic concepts involved in the 4D flow MRI acquisition. For those interested in more in-depth descriptions of technical details, we recommend some recently published reviews [10-12]. MRI can be used to assess the cerebral vasculature with many different techniques. The most well-known are contrast-enhanced angiography (with gadolinium) and time-of-flight (TOF) angiography. 4D flow MRI is based on the phase-contrast MRI technique [13] that can be used to measure blood flow velocity. The technique evolved from being implemented for 2D [14] and 3D [15] into being available in 4D [16]. 4D stands for time-resolved three-dimensional velocity measurements, that is, the cerebrovascular tree is investigated in a single scan (3D), and flow variations, for example, pulsations, are recorded over time. In recent years, 4D flow MRI has developed through several technological improvements that bring the scan time down to clinically feasible ranges [17-19].
During a 4D flow MRI scan, an electrocardiogram or a peripheral pulse is recorded so that velocity images representing different time frames of the cardiac cycle can be reconstructed (typically 20 time-frames per cardiac cycle are used). The final output from the 4D flow MRI scan is time-resolved x-, y-, and z-velocity images along with a conventional anatomical image. These two types of images can be combined into an angiogram that suppresses background information and highlights vasculature [20, 21]. See Figure 1 for examples of angiograms obtained in one subject at two different velocity sensitivity settings.
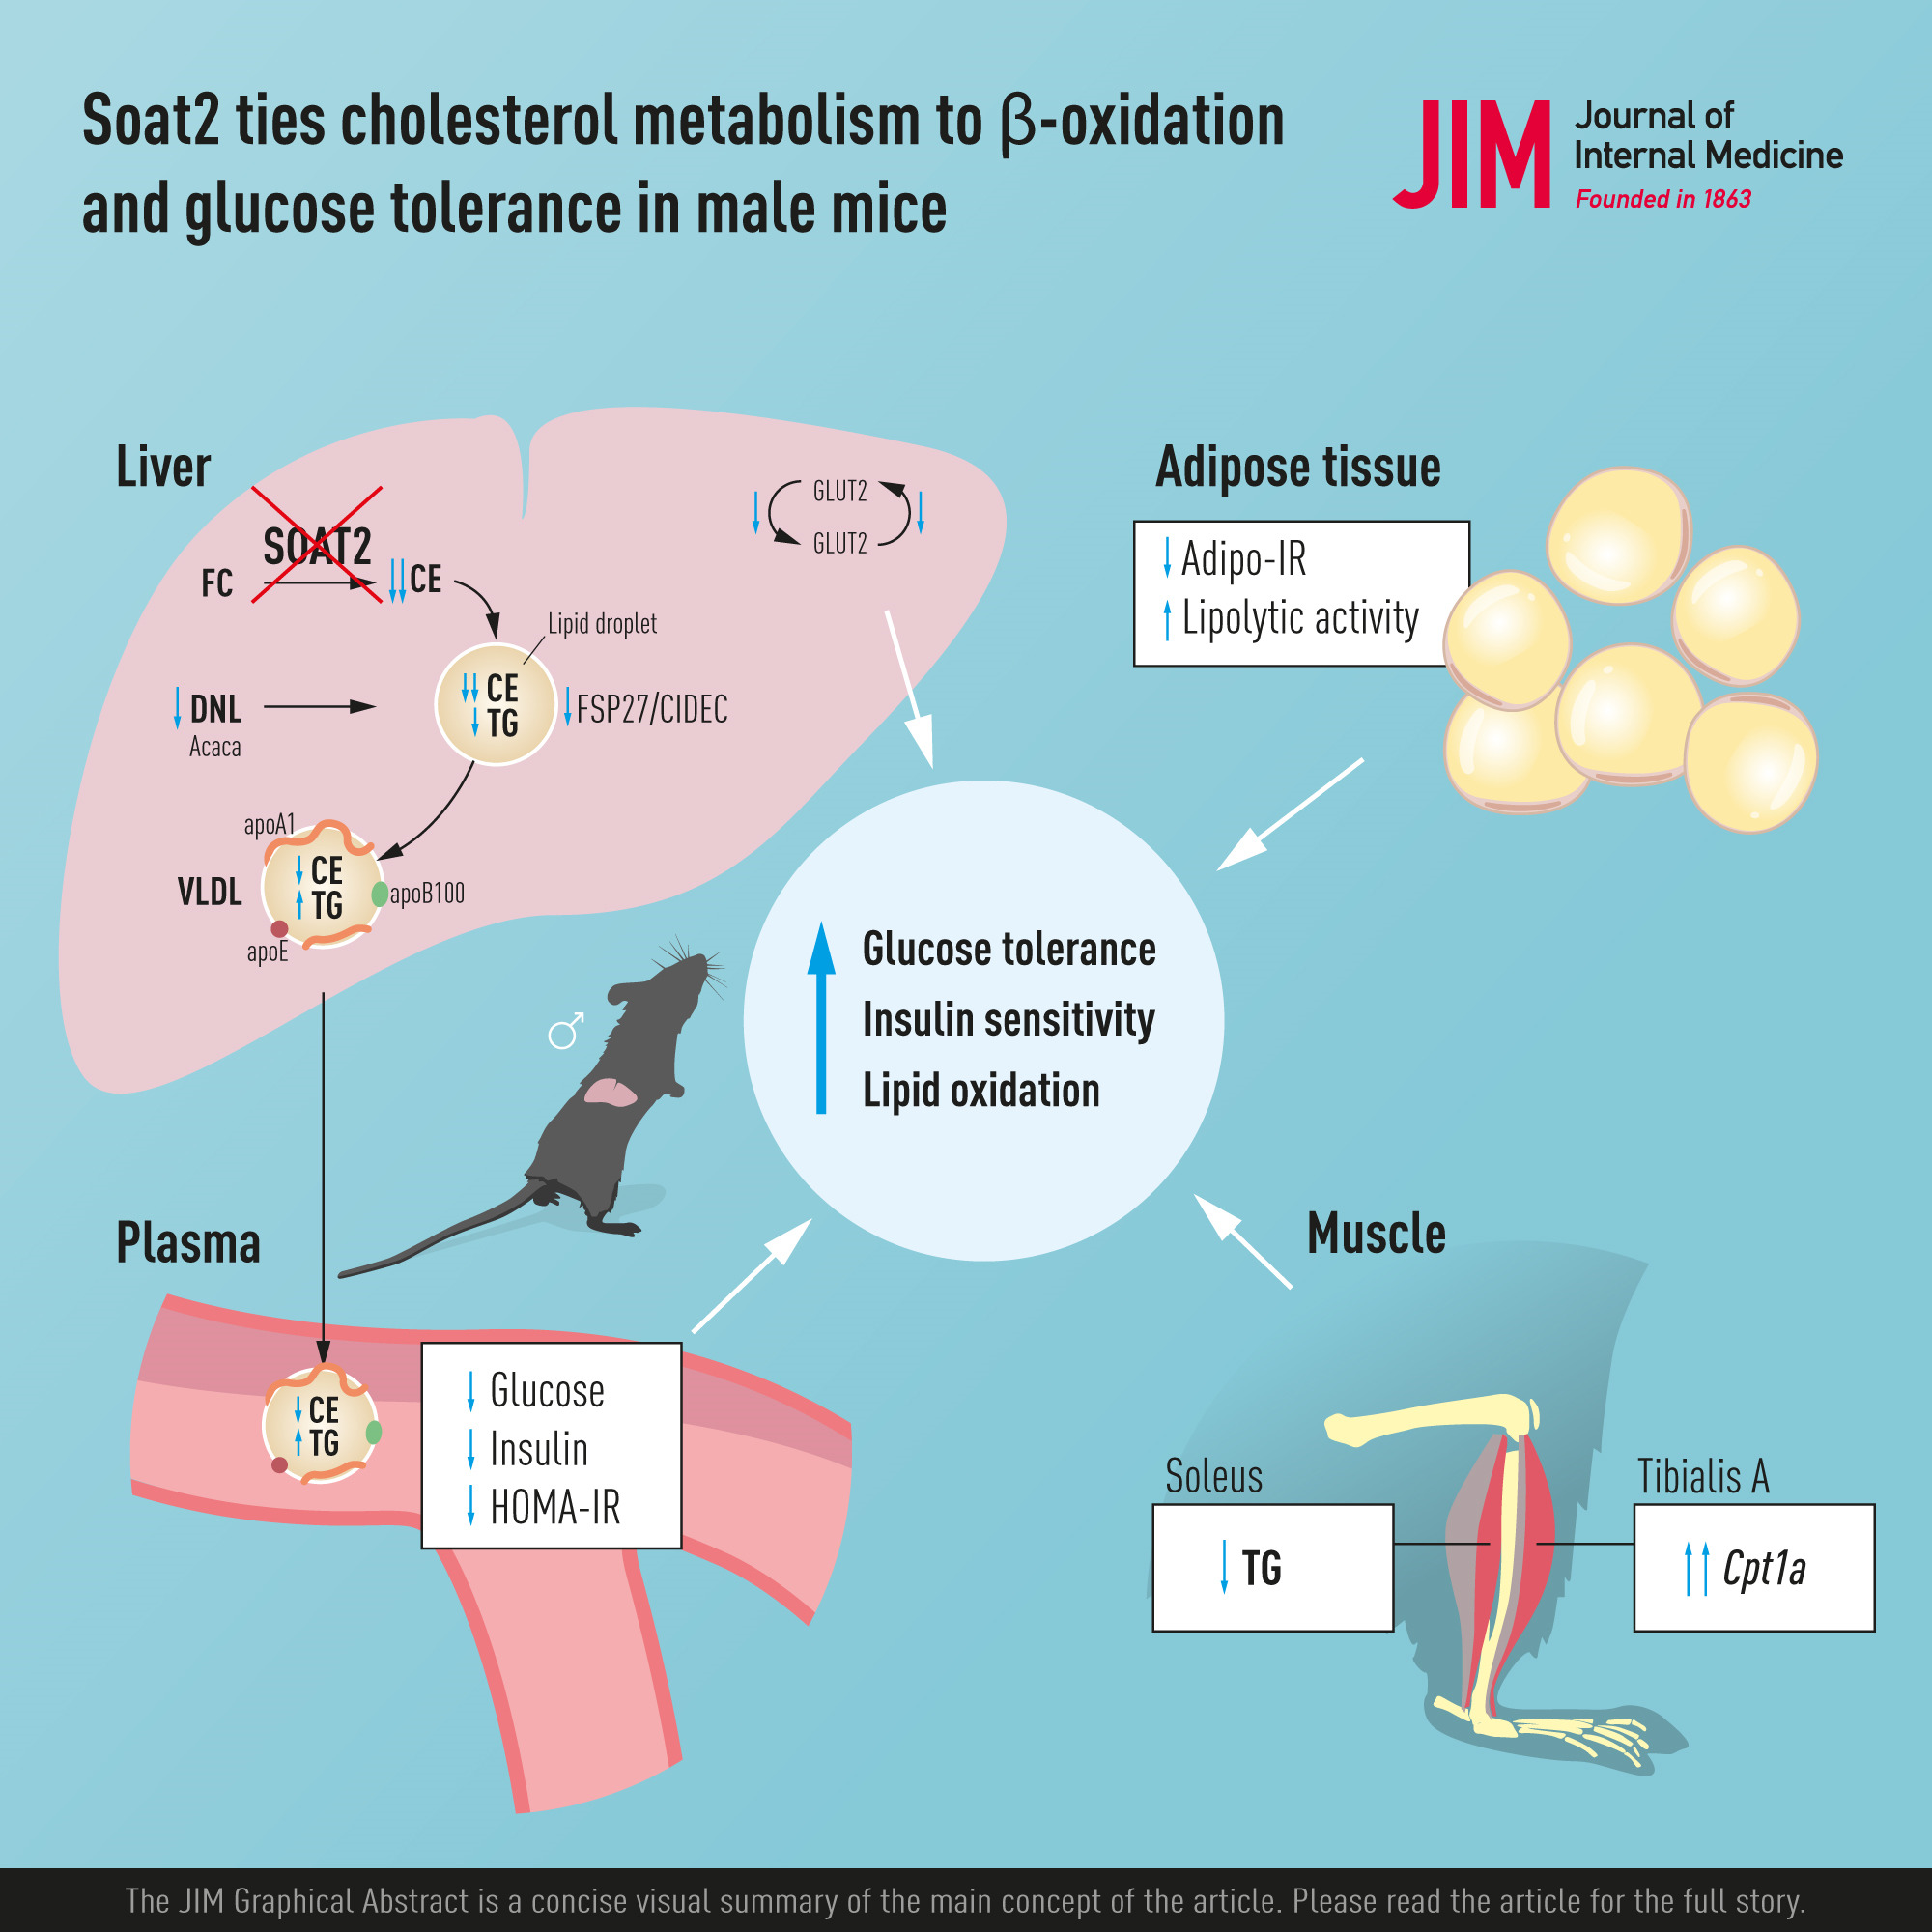
 Angiograms generated from 4D flow MRI data using the PC-VIPR sequence [99] at two different velocities encoding sensitivities in one subject. The velocity sensitivity is controlled by a parameter named Venc that should be set to a velocity slightly above those expected within the vessel of interest. Velocities above Venc are not measured correctly and velocities much below Venc exhibit low velocity-to-noise ratios. Here, the high (110 cm/s) and low (40 cm/s) Venc settings are adapted for examining the arterial and venous systems, respectively.
Extracting hemodynamic biomarkers
Angiograms generated from 4D flow MRI data using the PC-VIPR sequence [99] at two different velocities encoding sensitivities in one subject. The velocity sensitivity is controlled by a parameter named Venc that should be set to a velocity slightly above those expected within the vessel of interest. Velocities above Venc are not measured correctly and velocities much below Venc exhibit low velocity-to-noise ratios. Here, the high (110 cm/s) and low (40 cm/s) Venc settings are adapted for examining the arterial and venous systems, respectively.
Extracting hemodynamic biomarkers
Post-processing of the acquired velocity information at anatomical locations guided by the angiogram enables estimation of multiple hemodynamic biomarkers (Table 1). The choice of the 4D flow analysis method depends on what type of information that is of interest. For detailed examinations of focal locations in the vascular tree, manual [22] or semi-automatic [23] placement of cross-sections perpendicular to the vessel segment of interest is feasible. If multiple vessel locations are of interest, extracting a centerline representation of the cerebral vasculature [24] makes it possible to analyze velocity variations along an entire artery [25] as illustrated in Figure 2. Averaging across multiple adjacent cross-sections can be used to reduce noise and obtain a more precise representation of the velocity waveform in an arterial segment of interest [26]. Furthermore, centerline representations in the vascular tree can be structured according to branches [27] that can be anatomically labeled [28] according to a vascular atlas [29]. A crucial step in calculating the flow waveform from an artery concerns segmenting the arterial cross-section. This can be done manually by drawing a boundary, or by using algorithms that automatically detect the border [23 ,25, 30].
Table 1. Categories of hemodynamic biomarkers that are based on 4D flow MRI measurements of blood flow velocity in cerebral arteries or veins and that are of relevance to cerebrovascular and neurodegenerative disorders Hemodynamic biomarker category Description Reference Flow rate Obtained by integrating blood flow velocity across a vessel cross-section. Flow rates of the internal carotid arteries and the vertebral arteries can be summed to obtain total cerebral blood flow. Vascular flow rates are sensitive to multiple types of vascular disturbances such as increased peripheral vascular resistance and hemodynamically significant stenosis. Flow rate changes induced by a CO2 challenge can be used to test patency of cerebrovascular autoregulation. [23, 30, 61] Collateral flow activation Detection of compensatory flow patterns in response to a compromised flow in the main artery. Primary collateral activation can be measured directly as flow redistribution in the circle of Willis. Secondary collateral activation can be measured indirectly by measuring elevated flow rates in vessels supporting neighboring vascular territories. [63, 64] Arterial and venous pulsatility Measures the amplitude of cardiac-related pulsations and for example used to analyze the exposure of cerebral vasculature to hemodynamic forces. Sensitive to multiple factors including proximal and distal vascular compliance, target organ vascular resistance, as well as cardiac stroke volume. [23, 26, 36, 74] Pulse wave velocity Estimated from measuring a delay in the arterial waveform for increasing distance from the heart in the vasculature. Proxy of arterial stiffness. [37, 38] Pressure drop Using the Bernoulli principle, the pressure drop across a stenosis can be calculated. In addition, relative pressure maps can be calculated from the measured velocity field using the Navier-Stokes equations. [39-41] Wall shear stress By fitting a model of blood flow velocity near the vessel wall, the frictional force of blood on the wall surface can be calculated and plotted onto a three-dimensional representation of the artery. [44, 55]
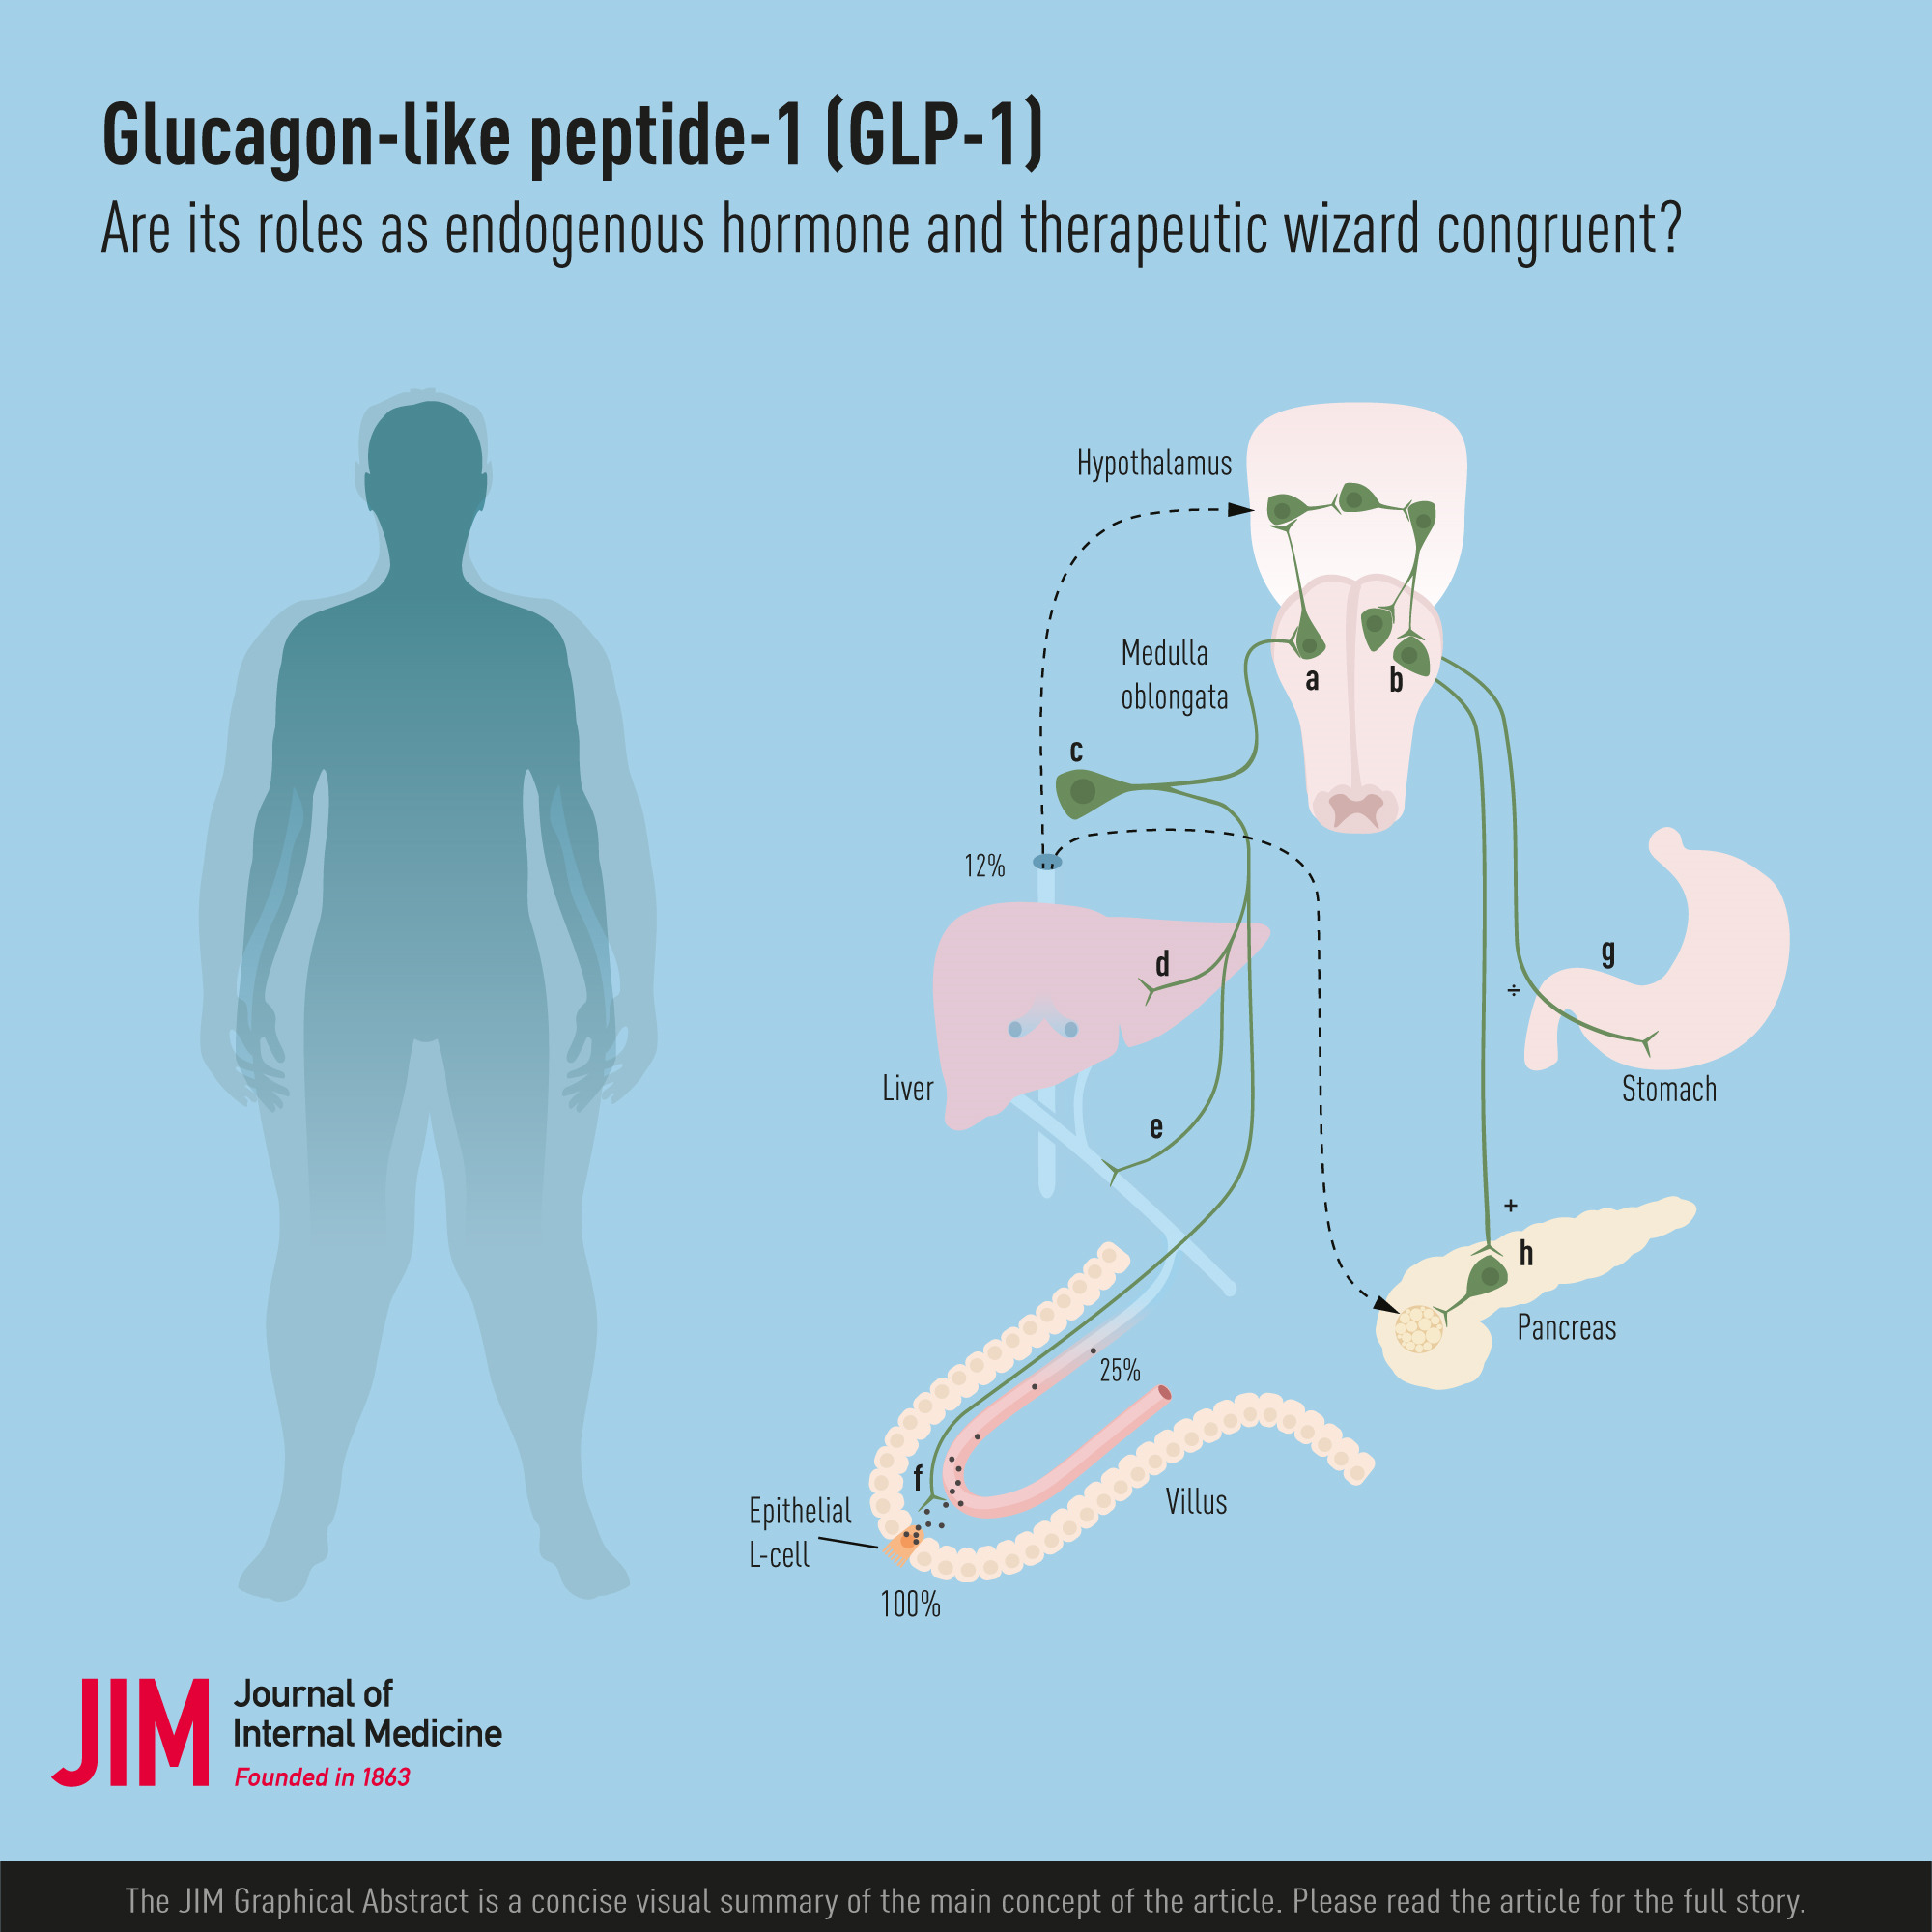
Centerline processing of intracranial 4D flow MRI. (a) 4D flow MRI angiogram. (b) Centerline representations of all detected vessels. (c) Selection of vessel segment of interest. (d) Schematic representation of how the centerline is used to find cross-sections that are perpendicular to the vessel. (e) Cross-sections with time-resolved through-plane velocity images calculated from the x-, y-, and z-velocity data. (f) After segmenting the vessel using a region of interest, the time-resolved flow rates can be calculated for every cross-section. Here the temporal resolution was 20 time frames per cardiac cycle.
Vascular flow rates and flow distribution4D flow MRI can be used for measuring velocity [31] and flow rate [23] of an individual artery or for calculating total cerebral blood flow by adding the flow rates from internal carotids and vertebral arteries together [32]. 4D flow MRI also allows characterization of circle of Willis flow patterns [33]. Such patterns may emerge as a consequence of various disease processes that alters the resistance of a particular flow route (for example by a narrowing or by an arteriovenous shunt). Figure 3 shows an example of changes in blood flow distribution in a patient before and after carotid surgery of the right carotid artery.
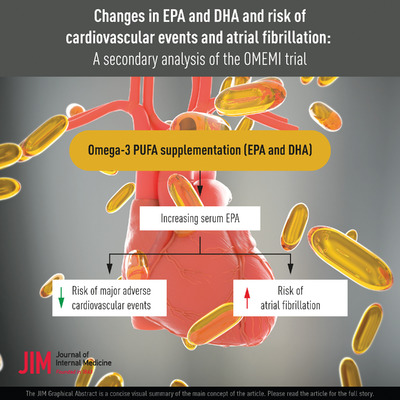
 Flow distribution analyses. In a patient with internal carotid artery stenosis, blood flow in the ipsilateral internal carotid artery (ICA) and middle cerebral artery (MCA) are substantially lower compared to the contralateral side. After carotid endarterectomy blood flow becomes balanced between left and right side. Total cerebral blood flow calculated from the internal carotid and basilar artery (BA) was 501 ml/min and 525 ml/min before and after surgery, respectively (case selected from [64]).
Pulsatility and stiffness
Flow distribution analyses. In a patient with internal carotid artery stenosis, blood flow in the ipsilateral internal carotid artery (ICA) and middle cerebral artery (MCA) are substantially lower compared to the contralateral side. After carotid endarterectomy blood flow becomes balanced between left and right side. Total cerebral blood flow calculated from the internal carotid and basilar artery (BA) was 501 ml/min and 525 ml/min before and after surgery, respectively (case selected from [64]).
Pulsatility and stiffness
The ability to obtain a flow waveform representing the cardiac cycle offers a number of unique possibilities to study factors related to the intensity of the cardiac-induced pulsations and arterial stiffness. The arterial pulsatility can be described in terms of indices based on systolic and diastolic velocities. The most common alternative is Goslings pulsatility index that is calculated as a difference between systolic and diastolic flow rate divided by the mean flow rate [34]. Pulsatility index is sensitive to end-organ resistance but also to proximal and distal vascular stiffness [35]. Pulsatility in cerebral arteries can also be quantified in terms of a volume corresponding to the wall distention of the downstream vascular bed that occurs during a cardiac cycle [23, 26]. Importantly, using 4D flow MRI, pulsatility analyses are not limited to a single location but can be applied to obtain a global characterisations of cerebral pulsatility [36]. Figure 4 illustrates arterial pulsatility quantification and how cerebral arterial pulsatility varies as a function of age as well as the distance from feeding arteries of the neck.
 Cerebral arterial pulsatility illustrated in proximal and distal parts of the cerebral vasculature. (a) Distance between the root of the visible cerebral vasculature to each distal cross-section (here the anterior circulation is selected). (b) Average flow rate waveform in proximal and distal vasculature, calculated after normalizing each cross-section waveform with mean flow rate and averaging across 20% of cross-sections with smallest and highest vascular distance values, respectively. Note the decreased amplitude in distal vasculature (c) Group average pulsatility index at different depths in the cerebral vasculature calculated in two groups of young (N = 10, from [23]) and elderly (N = 35, from [30]) individuals, respectively. For the purpose of this review, a linear mixed model was used to demonstrate a significant effect of group (ppp48].
4D Flow MRI can additionally be used to measure the cerebral arterial pulse wave velocity, a hemodynamic biomarker of arterial wall stiffness. In such applications, flow waveforms from at least two positions along an artery are used for calculating the pulse wave velocity [37, 38] (see Figure 5). The pulse wave velocity is then calculated as the distance along the arteries between the proximal and distal measurements (∆D, in meters) divided by the time shift (∆T, in seconds). Pulse wave velocity measurements can be implemented to examine stiffness in an artery of interest, such as the internal carotid artery [37]. Furthermore, the theoretical framework can be expanded to impose a model of pulse wave transmission to the entire cerebrovascular tree in order to obtain a global cerebral arterial pulse wave velocity [38].
 Pulse wave velocity description. (a) Localization of proximal and distal cross-sections for velocity waveform comparison. (b) The corresponding velocity waveforms (here normalized to have zero mean and unit variance). Each waveform is an average over ∼200 cross-sections. Note the small time-shift between the waveforms that is utilized in the calculating pulse wave velocity. (c) A model describing the delay in the velocity waveforms as a function of vascular distance and pulse wave velocity can be fitted to all available cross-sections to obtain a global pulse wave velocity shown to be sensitive to age [38].
Pressure drop
Pulse wave velocity description. (a) Localization of proximal and distal cross-sections for velocity waveform comparison. (b) The corresponding velocity waveforms (here normalized to have zero mean and unit variance). Each waveform is an average over ∼200 cross-sections. Note the small time-shift between the waveforms that is utilized in the calculating pulse wave velocity. (c) A model describing the delay in the velocity waveforms as a function of vascular distance and pulse wave velocity can be fitted to all available cross-sections to obtain a global pulse wave velocity shown to be sensitive to age [38].
Pressure drop
Severe atherosclerotic lesions or a dissection that causes a stenosis in the artery may induce a pressure drop that can be estimated from 4D flow MRI and serve as a hemodynamic biomarker of future stroke risk [39]. One approach is to approximate the pressure drop using a simple formula relating the flow velocity at the stenosis, together with the lumen area at the stenosis and the area proximal to the stenosis [39]. Another alternative to calculate the pressure drop is to use the Navier–Stokes equations in order to translate a velocity field into a pressure field [40, 41]. With computed tomography angiography and 4D flow MRI measurements as input, a computerized approach (“computational fluid dynamics, CFD”) can be used to generate maps of the pressure variations within the visible cerebral arterial tree [42].
Wall shear stressWall shear stress is the drag on the endothelial surface of the vessel wall exerted by flowing blood (Pa or N/m2) and has emerged as an important hemodynamic biomarker for atherogenesis [43]. The velocity at the wall of the artery is zero and wall shear stress can then be calculated by analyzing the steepness of the velocity increase when we leave the wall and move towards the middle of the artery and the blood stream. Specifically, the steepness of this velocity increase is multiplied with the viscosity of blood to obtain the wall shear stress. The estimated wall shear stress can be expressed as a function of arterial segments [44] or in all positions along the vessel wall [45].
Clinical applicationsBecause 4D flow MRI provides multiple types of hemodynamic biomarkers, it is also a relevant technique in a wide range of neurological diseases (see Table 2). The process of technological maturation and hemodynamic biomarker identification for investigation of the cerebral vascular tree resembles that of 4D flow MRI for cardiac diseases [46], where the technique in many situations now can be considered for clinical use (e.g., in cardiac valvular diseases) [10, 47]. Advantages to the patients are that needles or intravenous contrast media are not required. The patient must, however, be able to stay in a supine position for the duration of the MRI scan and usual contraindications to MRI apply (including claustrophobia). Presently, 4D flow MRI is not suitable for the acute neurological conditions, as the workflow is too time consuming. Examining neuro-intensive care patients with MRI is possible but requires advanced logistic arrangements. Therefore, neurovascular 4D flow MRI appears better suited for studying sub-acute or chronic alterations in cerebral hemodynamics.
Table 2. Clinical applications of 4D flow MRI Disease Hemodynamic biomarkers of interest Atherosclerosis Increased pulse wave velocity [37, 38] and arterial pulsatility with aging [36]. Characteristic wall shear stress in arterial regions at risk for atherosclerosis [44]. Arterial stenosis 4D flow MRI pressure drop indicates stenosis severity and potentially stroke risk [39]. Characterization of collateral flow patterns before [63] and after surgery [64]. Cerebral small vessel disease Elevated pulse wave velocity [37] and arterial pulsatility [67, 68]. Alzheimer's disease Decreased arterial flow rates [71], and elevated arterial [75], and venous pulsatility [22]. Elevated pulse wave velocity [37], and decreased arterial-to-venous pulse transmit time [22]. Venous thrombosis Characterization of abnormal venous drainage patterns and observation of treatment response [80]. Aneurysm Static [86-88] and dynamic [90-92] measures of wall shear stress for rupture risk stratification. Arteriovenous shunts Characterize hemodynamic changes and identify main feeding arteries [93], evaluation of treatment response [94]. Bleeding risk group characterization based on venous drainage pattern [97]. Arterial stiffening and atherosclerosisAging causes structural changes to the arterial wall which can impact brain health through multiple mechanisms including an increased risk of atherosclerosis, hemodynamic insufficiency, and stroke. One important consequence of age-related arterial wall remodeling is an increase in arterial stiffness that causes the arterial pulse wave velocity to increase. Developments of 4D flow MRI postprocessing now provide approaches sensitive enough to robustly characterize increases in pulse wave velocity of cerebral arteries as a function of age [37, 38] (see Figure 5c).
Another consequence of arterial stiffening is that the cardiac-related pulsatility is less dampened and thus forced deeper into distal vasculature [48]. 4D Flow MRI has been used to describe age-related increases in pulsatility in distal cerebral vessels in healthy subjects [36] and additional increases in subjects with cerebrovascular disease [49]. Another postprocessing technique that may be used in this context is 4D flow MRI-based compliance measurements, relating the cyclic distention of cerebral arteries, measured from either the flow rate waveform [26] or from measuring the vessel wall movements directly [50], to the cardiac pulse pressure.
Increased vascular stiffness is also related to the formation of atherosclerosis, stenoses, and plaques [51]. Such atherosclerotic development is further dependent on hemodynamic forces acting on the vessel wall, causing the formation of focal lesions to occur at locations with characteristic hemodynamic patterns. Typically, regions of disturbed flow including low wall shear stress, turbulence, and complex velocity gradients stimulate plaque development [52]. 4D flow MRI has been used to characterize wall shear stress at the carotid bifurcation and highlight such atherogenic segments and also describe the normalization in wall shear stress following carotid endarterectomy [44, 53, 54]. Importantly, interindividual differences in wall shear stress, and thus the risk for plaque formation, cannot be easily inferred from simple geometrical assessments from anatomical imaging, highlighting the potential of 4D flow MRI in improving predictions of plaque development and progression [55].
Stroke and cerebral small vessel diseaseIschemia and cerebral infarction are common in the population and around 20% are caused by large artery atherosclerosis [56]. Common locations of atherosclerotic plaques are at the carotid bifurcation and in the middle cerebral artery [57]. Several 4D flow MRI studies have been published on atherosclerotic disease and blood flow at the stenosis and around the circle of Willis. In intracranial stenosis patients, 4D flow MRI allows grading of stenoses [58] and estimation of trans-stenotic pressure drop [39], a measure of hemodynamic stress that may be indicative of future stroke risk. Estimations of relative pressure within the entire vasculature of patients with a stenosis can be obtained by combining 4D flow MRI with computational fluid dynamics [42]. Additional 4D flow MRI flow-related biomarkers, including pulsatility and flow asymmetry to contralateral hemisphere, has been linked to reduced vascular reserve [59]. Also, a direct 4D flow MRI hemodynamic biomarker of vascular reserve with the potential for evaluating cerebrovascular disease has been developed using the hypercapnic challenge [60, 61].
Recent work has also shown the usefulness of 4D flow MRI in detecting collateral blood supply, another indication of a hemodynamic disturbance in the stroke patient [59, 62]. Such collateral blood flow patterns were described in carotid stenosis patients prior to [63] and after surgery [64]. Prior to surgery, decreased flow in the carotid and MCA was demonstrated on the same side as the stenosis and both anterior cerebral arteries were supplied with blood from the contralateral internal carotid artery via the anterior communicating artery [63]. In the follow-up study, it was shown that carotid endarterectomy led to a normalization of cerebral hemodynamics [64] (see Figure 6). Flow measurements may also have a role in identifying individuals with a severely stenotic but not fully occluded artery associated with an elevated risk of stroke [65].
 Blood flow distribution in carotid artery stenosis before and after carotid endarterectomy. Blood flow rates provided in ml/min and written as before versus after surgery. Figure based on data reported in [64].
Cerebral small vessel disease is common in stroke and dementia patients and is seen on MRI as white matter hyperintensities, lacunes, microbleeds, perivascular spaces, and recent small subcortical infarcts [2]. The pathogenesis of cerebral small vessel disease is not known, but alterations in arterial pulsatility appear more closely related to the disease mechanism than reductions in cerebral blood flow [66], making 4D flow MRI suitable for exploring early hemodynamic biomarkers of potential relevance to disease progression. In this spirit, an association between 4D flow determined arterial pulsatility and features of cerebral small vessel disease has been identified in stroke patients [67]. A similar observation has been reported in healthy elderly subjects, also using 4D flow MRI [68].
DementiaA chain-of-events of vascular alterations, linking changes in the large proximal arteries to dysfunction at the distal capillary level, is implicated in cognitive decline and dementia [5, 69]. Vascular dysregulation is observed early in the AD process [70]. 4D flow MRI has been used to describe associations between flow rates in major cerebral arteries and cognitive performance [71] as well as pathologic amyloid beta 1–42 biomarker profiles along the AD continuum [72].
AD has also been associated with alterations in cardiac-related dynamics in cerebral blood flow. The age-related vascular stiffening results in increased pulsatility (flow and pressure) transmitted to the cerebrovascular system that could damage the cerebral microcirculation, potentially through suppressing endothelial cell maintenance in the blood-brain barrier [73]. Using 4D flow MRI it has been shown that patients with AD have increased pulse wave velocity in the internal carotid arteries compared to healthy controls [37]. AD also exhibits an increased pulsatility index in the cerebral vasculature indicating increased exposure of the microcirculation to hemodynamic stress [74]. Complementing the observations made in arteries, 4D flow MRI has also been used to describe increased venous blood flow pulsatility, and a shorter atrial-to-venous transit time of peak flow in AD [22]. Interestingly, 4D flow MRI has also been used to demonstrate decreased spontaneous low-frequency oscillations in cerebral arterial blood flow in AD patients compared to controls [75]. Recent evidence points to suggest that the above-mentioned alterations in blood flow dynamics could be very early events in the dementia spectrum since in a population-based sample of elderly individuals, 4D flow MRI was used to detect an association between increased vascular pulsatility, lower episodic memory and lower spontaneous hemodynamic low-frequency fluctuations in the hippocampus [68]. Exactly how changes in blood flow dynamics and vascular wall structure relate to dementia should be the focus of intense future investigations. One exciting direction of such research is answering whether the vascular alterations can have a negative impact on the glymphatic system function that drives clearance of metabolic by-products from interstitial fluid. According to glymphatic system theory, cerebrospinal fluid enters the brain via perivascular spaces that are lined with fluid channels. Cerebral arterial pulsations [76] and low-frequency vasomotion [77] appear central in creating pressure gradients necessary for achieving glymphatic bulk flow.
Other applications of neurovascular 4D flow MRI Venous flowAlthough less explored, investigating the cerebral venous system also holds potential for understanding several neurological diseases. 4D flow MRI provides a powerful way of comprehensive assessment of venous drainage [78, 79]. In cerebral venous thrombosis, 4D flow MRI has been used to detect abnormal flow patterns including stagnant flow, flow velocity acceleration in nonocclusive thrombosis, and reversed flow in the venous drainage that normalized to resemble values obtained in healthy subjects following successful anticoagulation treatment [80]. 4D flow MRI has also played an important role in challenging an influential theory entailing venous insufficiency in multiple sclerosis [81, 82], confirming observations made using conventional 2D phase-contrast MRI [83].
留言 (0)