
Remember me
COVID-19 disease continues to affect the whole world as a pandemic health crisis characterized by a wide spectrum of clinical manifestations varying from asymptomatic infection to multi-organ dysfunction.1 Although initially it has been thought to be a disease presenting with viral pneumonia, it may also occur with clinical manifestations affecting multiple organ systems.1 The cardiovascular system is one of the most frequently affected systems, and there is an increasing prevalence of cardiovascular complications, including new or worsening heart failure, arrhythmia, acute myocarditis, and myocardial infarction, particularly in severely and critically ill patients.2, 3 However, in some patients, cardiac test abnormalities can be the only finding with the absence of the clinical signs of heart disease.4 The cardiovascular system can be affected by COVID-19 due to the direct damage to cardiomyocytes, or it may be affected due to the heart-lung interaction.2, 3 The right ventricle (RV) is often indirectly involved during the course of COVID-19 disease.5 Right cardiac functions may be affected as a result of various pathophysiological mechanisms such as lung parenchymal damage, altered pulmonary hemodynamics, pulmonary vasoconstriction secondary to hypoxia, and thrombotic process.6
Echocardiography is generally used in our daily practice to detect cardiovascular complications in COVID-19 patients and for etiological research in the case of worsened clinical status.7 In previous studies, many echocardiographic parameters, including tricuspid annular plane systolic excursion (TAPSE), fractional area change (FAC), pulmonary artery systolic pressure and RV strain have been associated with poor outcomes and mortality.7 It has been observed that these parameters further deteriorated as the severity of the disease increased. Recently, the RV early inflow-outflow (RVEIO) index has been identified as a possible and indirect marker of the severity of tricuspid regurgitation and RV dysfunction in pulmonary embolism.8, 9 Previous studies have emphasized that ultrasonographic examinations, especially lung ultrasound (LUS), can provide information about the lung involvement and the severity of pneumonia in COVID-19 patients.10, 11 However, no study was found in the literature investigating the relationship between echocardiographic parameters and the severity of pneumonia. Based on this information, in this study we aimed to investigate the relationship between the severity of pneumonia in COVID-19 patients and the newly defined RVEIO index as an indirect indicator of RV dysfunction based on the heart-lung interaction.
2 MATERIALS AND METHODS 2.1 Study design and patientsA total of 54 patients diagnosed with COVID-19 pneumonia between November 2020 and January 2021 were prospectively enrolled in this study. The patients were consecutively enrolled in the study. According to the interim guidance of the World Health Organization, COVID-19 diagnosis was established via reverse transcriptase-polymerase chain reaction test of the nasopharyngeal swab. Patients having pneumonia from COVID- 19 diagnosed with chest computed tomography (CT) imaging were examined. Patients with known pulmonary hypertension, chronic lung pathologies, previous or current pulmonary embolism, severe renal failure, severe valvular disease, heart failure, atrial fibrillation, or poor echocardiographic images were excluded from the study. This study was approved by the local ethics committee (Decision number: 2020/20/03) and the our ministry of health.
Patients' demographics, clinical characteristics, and laboratory findings were collected from our hospital's medical records. All blood samples were obtained from the patients at the time of admission. The severity of pneumonia was studied in the previous research, and three categories were described as mild, moderate, and severe according to the CT findings.12, 13 In mild pneumonia, the pulmonary parenchyma was normal or near normal. In moderate pneumonia, ground-glass opacities, typically with a peripheral and subpleural distribution, were the main CT findings. In the presence of severe pneumonia, consolidation, linear opacities, and crazy-paving patterns were demonstrated.12, 13 Our study population was separated into two groups as severe pneumonia and nonsevere pneumonia (mild and moderate) based on CT imaging.
2.2 EchocardiographyEchocardiographic assessment was performed in all patients at the time of intensive care unit admission by the same echocardiographer who was blinded to the study design and patients' clinical data, using a commercially available system (Affiniti 50; Philips Healthcare, Andover, Massachusetts, USA) equipped with a 2.5–4 MHz transducer. Echocardiography was performed before starting mechanical ventilation in order to avoid impairment of the right ventricular filling hemodynamics and affecting the right ventricular parameters by mechanical ventilation. Conventional two-dimensional and Doppler echocardiographic examinations were performed according to the recommendations of the American Society of Echocardiography.14, 15 Dimensions of the left ventricle (LV), interventricular septum, posterior wall, and left atrium (LA) were measured. LV ejection fraction was calculated using the biplane Simpson's method.14
Mitral inflow velocities were measured from the apical four-chamber view by placing the pulsed-wave Doppler sample volume to the leaflet tips. Mitral early diastolic velocity (E, cm/s), late diastolic velocity (A, cm/s), E/A ratio, and deceleration time were determined. Tissue Doppler imaging echocardiography was performed with a 3.5- to the 4.0-MHz transducer, adjusting the Doppler pulse repetition frequency until a Nyquist limit of 15–20 cm/s was reached, and using the minimal optimal gain. The monitor sweep speed was set at 50–100 mm/s to optimize the spectral display of myocardial velocities. Myocardial peak systolic (Sm, cm/s), early (Em, cm/s), late (Am, cm/s) diastolic velocities were obtained by placing the tissue Doppler sample volume in the basal segments of lateral and septal walls of the LV. Also the E/Em ratio was calculated.
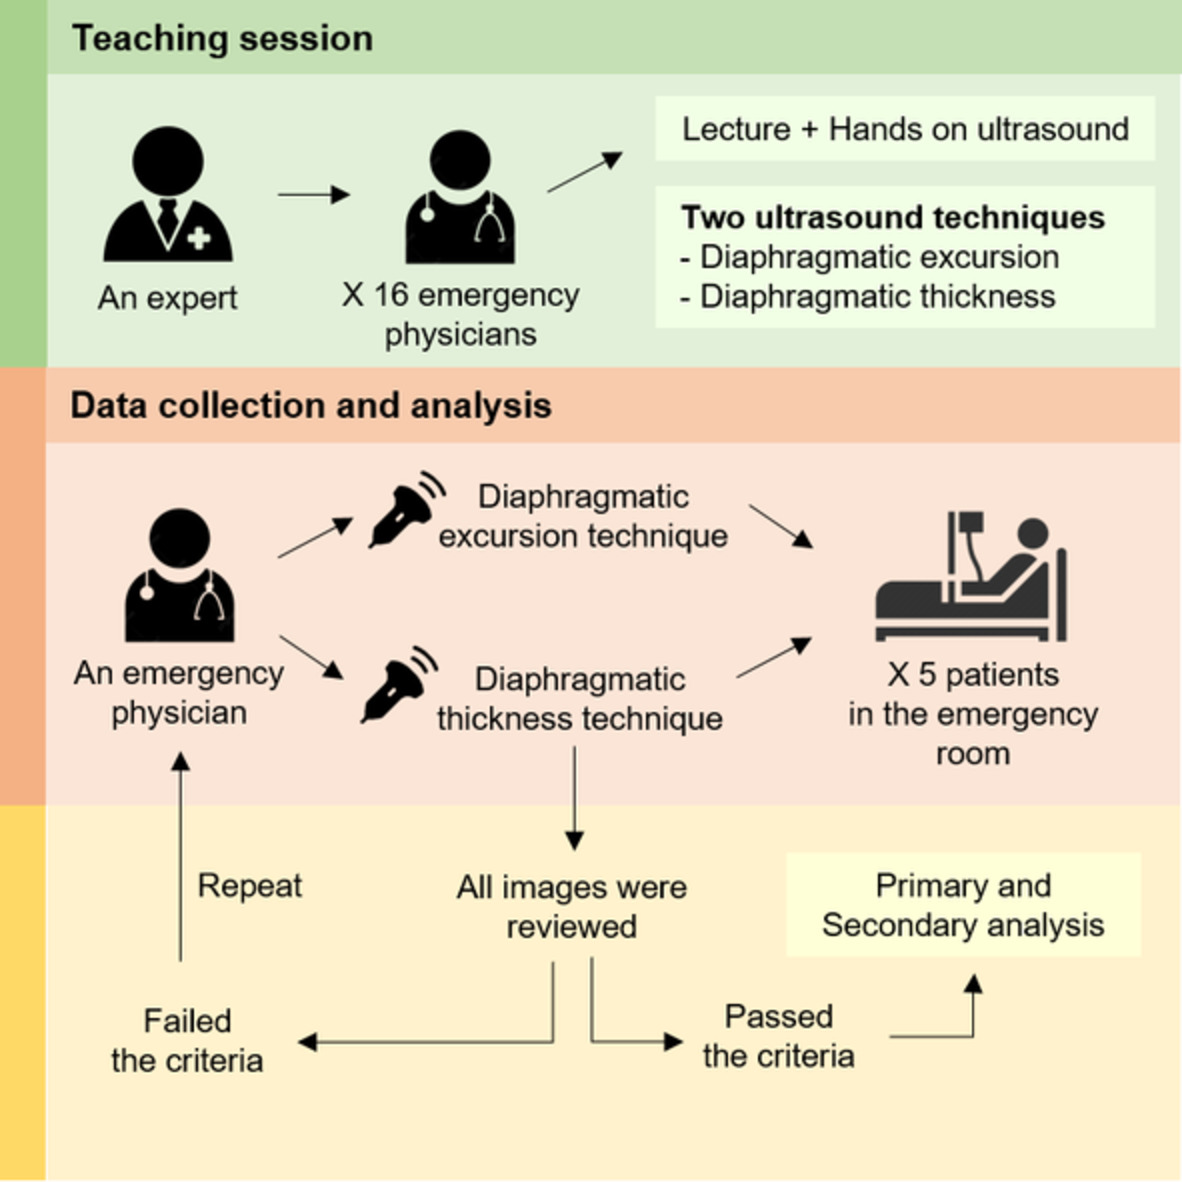
The following parameters were used while evaluating the RV functions. TAPSE was obtained from an M-mode through the lateral tricuspid annular plane by measuring the amount of longitudinal motion of the annulus at peak systole. Tricuspid lateral annular systolic velocity (Sm) was assessed by tissue Doppler imaging from the apical 4-chamber view. Pulmonary artery systolic pressure was evaluated using the simplified Bernoulli equation and right atrial pressure was assessed based on the size and collapsibility of the inferior vena cava. Using the Doppler signals of tricuspid inflow, peak trans-tricuspid early diastolic wave (E wave) velocity and active filling with atrial systolic (A wave) velocity were measured, and E/A was calculated. Pulmonary artery acceleration time was obtained from a pulsed-wave Doppler sample placed just proximal to the pulmonary valve annulus, and it was measured from the onset of forwarding pulmonary flow to peak flow. RV outflow velocity time interval (VTI) was traced from the pulse-wave Doppler recording at the RV outflow tract (RVOT) on the parasternal short-axis view. RVEIO index was obtained using the following equation: RVEIO index = Early trans-tricuspid filling wave velocity (E-wave velocity [cm/s]∕RVOT VTI) (Figure 1).

Measurement of right ventricle early inflow-outflow (RVEIO) index parameters (tricuspid inflow early diastolic filling velocity = E velocity and right ventricular outflow tract velocity time integral [RVOT VTI])
2.3 Statistical analysisStatistical analyses were performed using the IBM-SPSS 22.0 statistical software package (IBM, Armonk, NY). Continuous data were expressed as mean ± SD, while categorical data were presented as numbers and percentages. The Chi-squared test was used for the comparison of categorical variables, while the Student's t test and Mann–Whitney U tests were used to compare parametric and nonparametric continuous variables, respectively. The correlation of the continuous variables was analyzed by Spearman's and Pearson's correlation analyses. Values of p < .05 were considered statistically significant. Finally, multiple logistic regression analysis was performed to determine the independent predictors of severe pneumonia due to COVID-19. The receiver operator characteristic curve analysis was performed to test the diagnostic accuracy of the RVEIO index.
3 RESULTSA total of 54 patients were included in the study. According to chest CT scans, the patients were divided into two groups: 28 patients were designated as nonsevere pneumonia, and 26 patients with severe pneumonia were classified into the second group. The clinical and demographic characteristics and laboratory findings of the patients are summarized in Table 1. The severe pneumonia group had lower saturation O2 levels, higher CRP levels, higher D-dimer levels, higher percentages of intubation rate, and higher percentages of in-hospital death rate than the nonsevere pneumonia group (for all p < .05). Other clinical and demographic characteristics and laboratory findings were similar between the two groups.
TABLE 1. Demographic and clinical characteristics of the study population Nonsevere pneumonia (n: 28) Severe pneumonia (n: 26) p value Age (years) 67.9 ± 14.6 62.1 ± 15.4 0.195 Gender (male), n (%) 16 (57) 14 (54) 1 DM, n (%) 10 (36) 11 (42) 0.781 HT, n (%) 12 (43) 11 (42) 0.593 CHD, n (%) 8 (29) 8 (31) 0.548 Saturation O2 88.4 ± 4.1 82.7 ± 5.9 <.001 Heart rate (bpm) 94.1 ± 12.6 95.4 ± 15.8 0.743 Glucose (mg/dl) 138 (98–209) 155 (120–270) 0.242 Na (mmol/L) 133.6 ± 4.9 134.7 ± 4.8 0.427 K (mmol/L) 4.2 ± 0.6 4.6 ± 0.5 .054 GFR (ml/min) 81.9 ± 20.3 79.9 ± 31.1 0.795 LDH (U/L) 552 (469–641)) 520 (408–768) 0.497 C-reactive protein (mg/ml) 132 (98–174) 204 (141–230) <.001 Hemoglobin (g/dl) 13.5 ± 1.1 13.1 ± 1.9 0.492 WBC (103/μl) 10.8 (6.5–14.1) 12.9 (6.2–22.4) 0.159 Thrombocyte (103/μl) 238 ± 88 274 ± 96 0.196 D-dimer (μg/L) 488 (351–523) 868 (719–1428) <.001 Troponin (ng/ml) 0.02 (0–0.08) 0.01 (0–0.13) 0.724 Noninvasive mechanical ventilation, n (%) 12 (43) 16 (61) 0.282 Intubation, n (%) 3 (11) 10 (38) .026 Hospital stay (day) 10.1 ± 2.8 8.5 ± 3.4 0.342 In-hospital death, n (%) 8 (29) 18 (69) .006 Abbreviations: CHD, coronary heart disease; CRP, C-reactive protein; DM, diabetes mellitus; GFR, glomerular filtration rate; HT, hypertension; LDH, lactate dehydrogenase; WBC, White blood cell.The echocardiographic parameters of the nonsevere and severe pneumonia groups are presented in Table 2. Deceleration time (200.8 ± 44.9 vs. 172.1 ± 44.6, p = .04), TAPSE (2.2 ± 0.4 vs. 1.9 ± 0.3, p = .033), Sm (12.1 ± 2.1 vs. 10.1 ± 1.9, p < .001), pulmonary artery acceleration time (110.1 ± 20.6 vs. 80.4 ± 19.5, p = .025), and RVOT VTI (16.3 ± 4.2 vs. 14.1 ± 2.3, p = .026) were significantly lower and Tricuspid E (53 ± 14 vs. 780 ± 23, p < .001) and RVEIO index (3.5 ± 1.3 vs. 5.7 ± 1.6) were significantly higher in the severe pneumonia group compared with the nonsevere pneumonia group.
TABLE 2. Echocardiographic characteristics of patients Nonsevere pneumonia (n: 28) Severe pneumonia (n: 26) p value LVEDD (cm) 4.6 ± 0.5 4.7 ± 0.4 0.445 LVESD (cm) 2.9 ± 0.4 3.1 ± 0.5 0.115 IVS (cm) 1.1 ± 0.1 1.1 ± 0.2 0.971 PW (cm) 1 ± 0.1 1 ± 0.2 0.939 Ascending aorta (cm) 3.5 ± 0.3 3.4 ± 0.2 0.345 Left atrium (cm) 3.6 ± 0.5 3.5 ± 0.4 0.921 LVEF (%) 60.4 ± 3.4 61.2 ± 3.4 0.440 E (cm/s) 72 ± 18 72 ± 14 0.950 A (cm/s) 85 ± 12 77 ± 14 .062 DT (ms) 200.8 ± 44.9 172.1 ± 44.6 .04 Em (cm/s) 9.1 ± 2.4 9.2 ± 2.1 0.876 Am (cm/s) 11.6 ± 3.1 11.4 ± 3.8 0.821 E/Em 8.6 ± 3.4 7.8 ± 1.4 0.367 TAPSE (cm) 2.2 ± 0.4 1.9 ± 0.3 .033 Sm (cm/s) 12.1 ± 2.1 10.1 ± 1.9 <.001 PABs (mmHg) 29.9 ± 4.8 32.5 ± 10.1 0.224 Tricuspid E (cm/s) 53 ± 14 80 ± 23 <.001 Tricuspid A /cm/s) 65 ± 20 76 ± 26 .079 Tricuspid E/A 0.8 ± 0.3 1.1 ± 0.4 .02 RVOT VTI (cm) 16.3 ± 4.2 14.1 ± 2.3 .026 Pulmonary artery acceleration time (ms) 110.1 ± 20.6 80.4 ± 19.5 .025 RVEIO index 3.5 ± 1.3 5.7 ± 1.6 <.001 Abbreviations: A, mitral inflow late diastolic velocity; Am, ventricular tissue doppler late diastolic velocity; DT, deceleration time; E, mitral inflow early diastolic velocity; Em, ventricular tissue doppler early diastolic velocity; IVS, interventricular septum; LVEDD, left ventricular end-diastolic diameter; LVESD, left ventricular end-systolic diameter; LVEF, left ventricular ejection fraction; PABs, pulmonary artery systolic pressure; PW, posterior wall; RVEIO, right ventricular early inflow-outflow; RVOT VTI, Right ventricular outflow tract velocity time integral; Sm, tricuspid lateral annular systolic velocity; TAPSE, tricuspid annular plane systolic excursion.Receiver operating characteristic curve analysis demonstrated that RVEIO index >4.2 predicted the severe pneumonia with 77% sensitivity and 79% specificity (area under the curve [AUC]:0.86; p < .001) (Figure 2).

Receiver operating characteristic curve analysis of the right ventricle early inflow-outflow (RVEIO) index to predict the severe pneumonia (AUC: Area under the curve)
Multiple binary logistic regression analysis was performed to determine the independent predictors of severe pneumonia. Saturation O2, CRP, D-dimer, DT, TAPSE, Sm, and RVEIO index values were found to be significant in the univariate analyses and evaluated with the multivariate logistic regression analysis. The result of the test revealed that saturation O2 (OR: 0.737, 95% CI: 0.554–0.981; p = .036), D-dimer (OR: 1.008, 95% CI: 1.003 1.014; p = .003), Sm (OR: 0.481, 95% CI: 0.261–0.886; p = .019) and RVEIO index (OR: 2.749, 95% CI: 1.304–5.785; p = .008) were the independent predictive parameters for severe pneumonia (Table 3).
TABLE 3. The result of multivariate logistic regression analysis for the prediction of severe pneumonia OR 95% CI p value Saturation O2 0.737 0.554–0.981 .036 CRP 1.009 0.993–1.026 0.258 D-dimer 1.008 1.003–1.014 .003 DT 0.985 0.966–1.004 0.122 TAPSE 1.489 0.123–18.062 0.755 Sm 0.481 0.261–0.886 .019 RVEIO index 2.749 1.304–5.785 .008 Abbreviations: CRP, C-reactive protein; DT, deceleration time; RVEIO, right ventricular early inflow-outflow; Sm, peak myocardial systolic velocity; TAPSE, tricuspid annular plane systolic excursion. 4 DISCUSSIONOur results provide information about the severity of pneumonia in patients hospitalized in the intensive care unit for COVID-19 and the principal findings of our study are as follows: (i) RVEIO index values were higher in the severe group compared to the nonsevere group; (ii) saturation O2, D-dimer levels, Sm, and RVEIO index were found to be independent predictors of severe pneumonia through multivariate analysis.
COVID-19 affects the heart both directly or indirectly in as much as half of patients, and cardiovascular involvement is associated with a poor prognosis.2, 3 In the clinical course of COVID-19, myocardial injury, myocarditis, myocardial infarction, stress cardiomyopathy, and arrhythmias could be observed.2, 3 And also, COVID-19 causes disturbances in heart functions, especially as a result of the heart-lung interaction.2, 3 The RV appears to be one of the most affected cardiac chambers.16 Direct myocardial damage, increased vasoactive mediators, vascular remodeling, vascular thrombosis, and vascular compression secondary to atelectasis and edema contribute to RV dysfunction.17 In previous studies, many RV parameters have been reported as predictors of in-hospital and short-term mortality and morbidity in patients with COVID-19.7 Obvious and subtle changes in the RV are often detected with echocardiography.7 In COVID-19 patients, echocardiography has become a useful clinical tool both in medical wards and in critical care settings since it can provide information on concomitant clinical conditions (i.e., heart failure, myocardial infarction), current hemodynamic status, and the heart-lung interactions.2, 3
In previous studies, it has been determined that the right heart functions are significantly impaired especially in the critically severe disease group in COVID-19 patients, and are related to the prognosis.18, 19 Previous studies have emphasized that RV dysfunction is related to the severity of COVID-19 pneumonia and acute respiratory distress syndrome.18, 19 These studies have mostly focused on parameters such as TAPSE, Sm, FAC, and RV speckle tracking parameters, which show RV dysfunction.7, 18, 19 In this study, we emphasized that RVEIO index studied in determining the severity of tricuspid regurgitation and evaluating right ventricular dysfunction in pulmonary embolism may be related to the severity of COVID-19 pneumonia, and as a result of our study, we determined it as an independent predictive parameter for severe pneumonia. Regarding the mechanism, association between RVEIO index and severe pneumonia, that has been observed in our study, may stem from compensatory adaptation to increased RV afterload and pulmonary vascular resistance (PVR). The main factor in right ventricular failure in COVID-19 pneumonia is considered to be an increase in PVR.18 As the severity of pneumonia increases, it will create a more serious burden on the RV with factors such as lung edema, thickening of alveolar septa, inflammatory infiltrates, and vascular congestion. And with predisposing factors such as hypoxic vasoconstriction, the use of positive end-expiratory pressure in mechanical ventilation, and local thrombosis or thromboembolic processes, the deterioration in pulmonary hemodynamics becomes more pronounced. An increase in right atrial pressure in response to increased PVR will appear as an increase in E wave velocity on echocardiography. İmpaired right ventricular systolic function due to elevated PVR will be presented as decreased RVOT VTI in echocardiographic evaluation. Consequently, the relation between RVEIO index obtained by calculating these two parameters and the severity of pneumonia can be explained by the aforementioned mechanism. Also it is unlikely that the parameters indicating right ventricular dysfunction will rapidly deteriorate at the same time. Right ventricular functions can be preserved despite an increase in RV afterload up to a critical threshold. Here, the increase in the RVEIO index, which consists of hemodynamic parameters, could be used as a parameter indicating the RV adaptation against the increased PVR in this period.
Many prognostic parameters such as vital signs, comorbidities, and blood test results have been examined to predict disease severity and outcomes for COVID-19 patients.20, 21 The disadvantage of these parameters is that they may not enable a rapid risk stratification. In addition, it has been shown that bedside LUS findings can be useful in the early detection of COVID-19 patients who develop critical illness.22 Based on these studies, we thought that bedside echocardiographic parameters could also provide information about serious disease. Results of the previous studies have indicated that CT as the most accepted imaging method by showing the severity of pneumonia could identify patients who needed aggressive treatment and close monitoring.23, 24 In this study, we showed that the RVEIO index is a surrogate marker for severe pneumonia, a disease with possibly high mortality and morbidity, requiring close follow-up.
Ultrasonography is used with increasing frequency in our daily practice. Point-of-Care Ultrasound emerges as a powerful tool that is frequently used in patient approach in the emergency room or intensive care unit. Previous studies showed that LUS has been often used for disease identification, lung involvement severity classification, or treatment allocation in the emergency department during the COVID-19 pandemic.22, 25 It has also been shown that LUS can reduce the use of chest X-rays and CT.26 Echocardiography is usually used in emergency services or intensive care units for hemodynamic disorders, detection of complications, and cardiovascular evaluation.5, 7 In addition to detecting cardiac involvement, echocardiography may speed up the identification of high-risk patients during the COVID-19 pandemic. It should be kept in mind that bedside echocardiography can also be used in this area. As a result of our study, the RVEIO index as an echocardiographic parameter may provide information about the degree of COVID-19 lung involvement.
There are several limitations in the present study. It was a single-center study with a relatively limited number of patients. Our findings must be supported by further large prospective studies. Since only COVID-19 patients admitted to the intensive care unit were included, our findings may not apply to the entire COVID-19 population. The intra-observer correlation was not analyzed in our study. In addition, TTE examinations were performed by a single researcher; thus, the inter-observer correlation could not be analyzed. RVEIO index and the other echocardiographic measurements have the disadvantage of being relatively angle-dependent. And the RVEIO index is, however, like all echocardiographic methods, dependent on image quality. Furthermore, intensive care unit patients may be unable to cooperate in adjusting positions, which affect image quality.
5 CONCLUSIONRVEIO index can be used as a bedside, noninvasive, easily accessible, and useful marker to identify the COVID-19 patient group with widespread pneumonia and therefore the high risk of complications, morbidity, and mortality.
CONFLICT OF INTERESTNo potential conflict of interest was reported by the authors.
Comments (0)