
Remember me


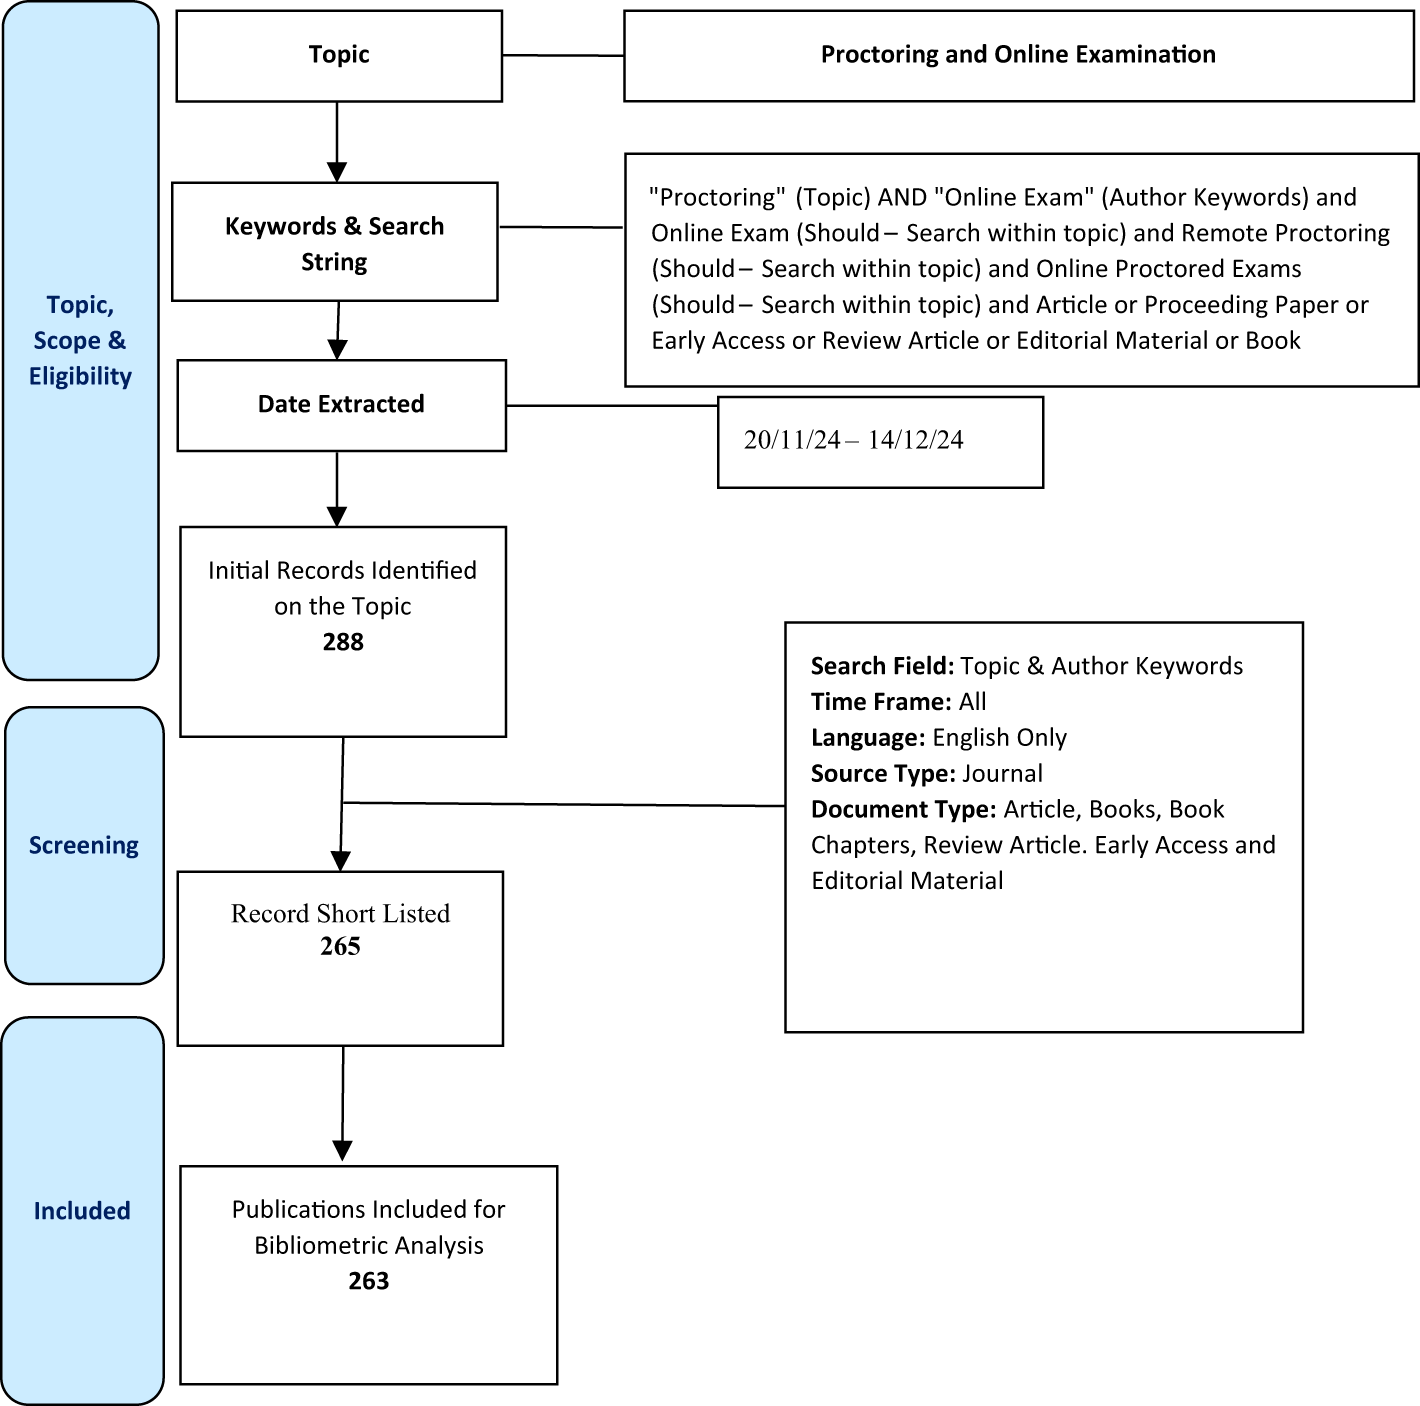

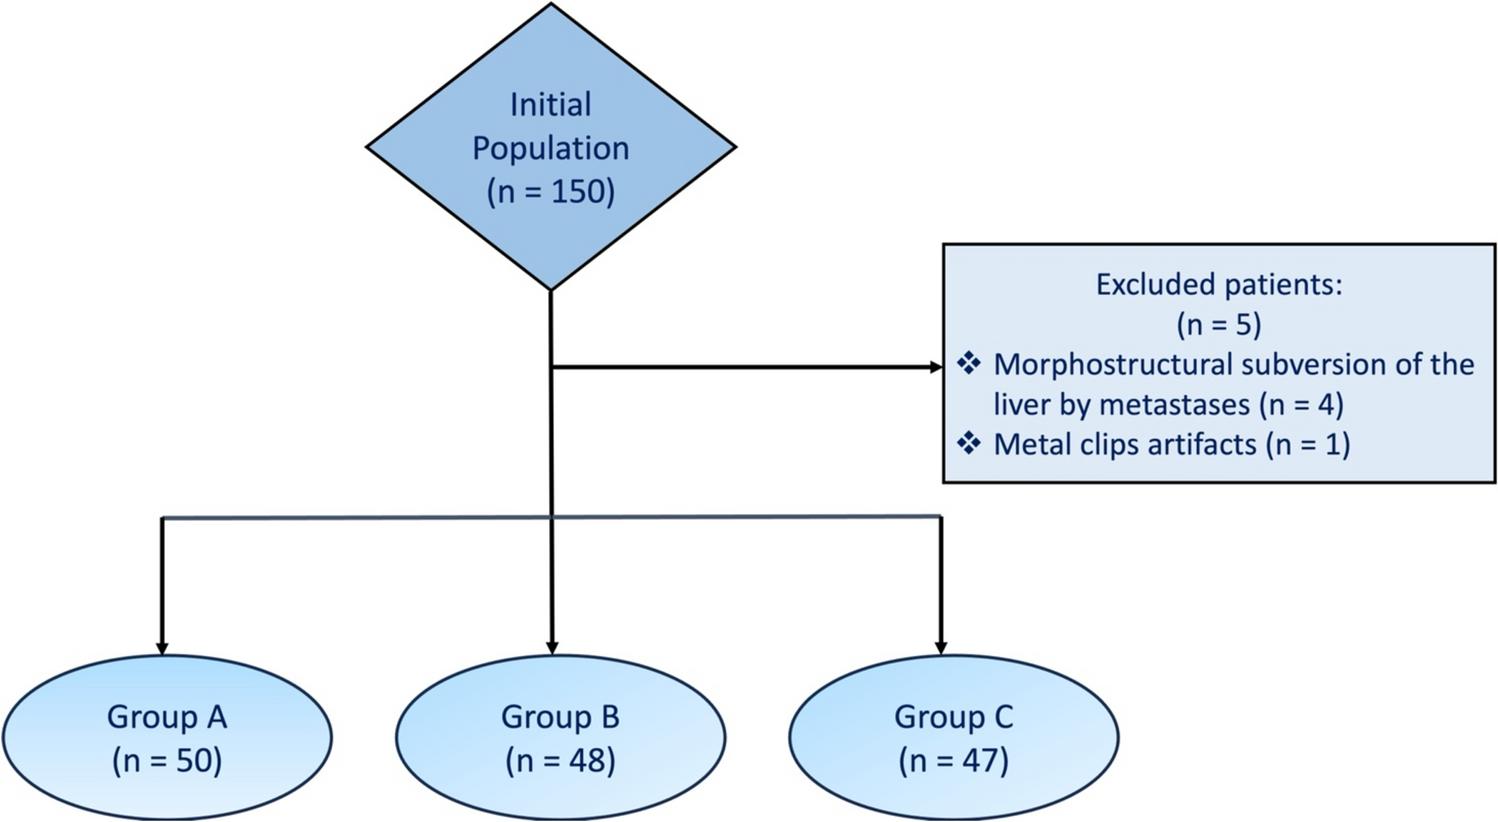

This study was approved by the institutional review board, and written informed consent was obtained from all participants. This study was registered at clinicaltrials.gov (NCT06104189). Sample size determination is described in Supplementary information. From October 2021 to November 2022, consecutive 264 women with pathologically proven invasive breast cancer and scheduled pretreatment breast MRI were enrolled. The inclusion criteria were: (a) participants diagnosed pathologically with invasive breast cancers with core needle biopsy, not excision or vacuum-assisted biopsy; and (b) participants without previous ipsilateral breast surgery within the last 5 years. Thirty-nine women were excluded for the following reasons: (a) poor cancer delineation due to infiltrative enhancement or inflammatory cancer (n = 20); (b) less than 6 mm in size (n = 2); (c) ongoing pregnancy (n = 4); or (d) incomplete histological information (n = 13). Eight participants presented with concurrent bilateral breast cancer, and each lesion was examined as an individual lesion. Therefore, 233 breast cancers from 225 participants were included for analysis (Fig. 1).
Fig. 1
Flowchart of the study participants. A total of 233 breast cancers of 225 participants were included
MRI protocol and feature evaluationBreast MRI was performed using a 3.0 T scanner (Ingenia Elition X; Philips Healthcare) with a dedicated 16-channel bilateral breast coil. MRI protocol is presented in Fig. 2. All images were obtained with bilateral axial views and fat saturation. The protocol included T2-weighted, diffusion-weighted, precontrast T1-weighted, ultrafast dynamic contrast-enhanced T1-weighted, standard dynamic contrast-enhanced T1-weighted, and T1-weighted axillary images. Precontrast images of standard and ultrafast MRI were first performed, followed by injection of the contrast agent, gadoterate meglumine (Uniray; Dongkook Pharmaceutical Co., Ltd), and 14 ultrafast and four standard acquisitions. The contrast agent was given at a dose of 0.1 mmol/kg at a flow rate of 1.5 mL/s, followed by a 30-mL saline flush. Four-dimensional time-resolved angiography with keyhole techniques was used for ultrafast images, which were acquired within 4.2 s per image. Consecutively, standard MRI was obtained at 58.8, 138.8, 218.8, and 298.8 s after contrast injection. We evaluated kinetic and radiomic features on standard MRI and ultrafast MRI, respectively. The detailed acquisition parameters for ultrafast and standard MRI are summarized in Table 1.
Fig. 2
Full MRI protocol used in our study. T1 T1-weighted, T2 T2-weighted, DWI diffusion-weighted imaging
Table 1 Acquisition parameters for ultrafast and standard MRIOn standard MRI, four kinetic parameters were extracted using a commercially available computer-aided diagnosis (CAD) system (CADstream software version 5,4,0,190, Merge Healthcare): peak enhancement (%), washout component (%), plateau component (%), and persistent component (%). Pixels with signal intensity that increased above the 50% threshold in the initial contrast-enhanced images compared to precontrast images were shown in color [18]. Color was coded according to changes in the pixel values between the initial contrast-enhanced images and delayed contrast-enhanced images [19, 20]. Washout type was defined as a more than 10% decline in pixel signal intensity in the delayed contrast-enhanced images compared to the initial contra-enhanced images (color-coded red). Persistent type was defined as an increased pixel signal intensity of more than 10% in delayed contrast-enhanced series from the initial contrast-enhanced series (color-coded blue). Plateau type was defined as less than an 10% change in pixel signal intensity in the delayed contrast-enhanced series compared with the initial contrast-enhanced series (color-coded yellow). Based on the enhancement type of each pixel in the tumor lesion, the proportions (%) of pixels with washout, plateau, and persistent patterns within in a tumor volume were quantified. Peak enhancement was defined as the percentage increase in signal intensity of the highest pixel in the initial contrast-enhanced images compared to precontrast images.
On ultrafast MRI, four quantitative kinetic features were obtained using MATLAB (R2023b; MathWorks) by an MRI specialist (J.T.L.): TTE (s), maximum slope (percentage relative enhancement/second [%/s]), initial enhancement rate (a.u.), and U2 time (s) [21, 22]. A 3 × 3 mm circle region of interest (ROI) was placed on the most intensively enhancing region (hotspot) of segmented tumor (ROItumor) based on a heatmap generated on the last ultrafast image. The same sized ROI was also placed on the descending aorta at the level of the main trunk of the pulmonary artery to evaluate the starting time of aortic enhancement as a reference (ROIaorta). Each ROI (ROItumor and ROIaorta) was applied to all other ultrafast MRI phases to generate time–signal intensity curves. The following kinetic parameters were derived from the time–signal intensity curves on ultrafast MRI. TTE was defined as the time interval between the timepoint at which the tumor begins to enhance minus the timepoint at which the aorta starts to enhance. It was formulated as TTE = (tumor enhancement phase − aorta enhancement phase) × repetition time. Maximum slope was defined as the slope of the tangent along the steepest part of the time–signal intensity curve. The tangent was calculated by connecting each time point, and the interval with the steepest tangent was decided for maximum slope from the time–signal intensity curve. Initial enhancement rate was defined as the ratio of change in signal intensity between the unenhanced phase and early phase. It was formulated as follows, initial enhancement rate = signal intensity of unenhanced phase/signal intensity of early phase. Among the 14 ultrafast images, U1 was the first phase in which the signal intensity of the hotspot ROI of the tumor was 10% higher than the average signal intensity of unenhanced images. U2 was the immediate next phase of U1 and the well-established tumor enhancement time [6]. U2 phase was reported as the optimal time to measure the maximum tumor size with little effect of background enhancement [23, 24]. Kinetic features were added to the radiomic features obtained from standard or ultrafast MRI for both readers.
Two readers (R1 [B.K.S.]: a dedicated breast radiologist with 24 years’ of experience in breast imaging, R2 [J.J.]: a radiology resident with 2 years’ of experience in breast imaging) performed background parenchymal enhancement assessments and tumor segmentation. Background parenchymal enhancement was classified into minimal, mild, moderate, or marked [25]. Readers were blinded to pathology reports and independently evaluated MRI after review of mammography and/or ultrasound images. They independently evaluated ultrafast and standard MRI images uploaded onto the Picture Archiving and Communication System in separate reading rooms. Standard and ultrafast image sets were uploaded and read with a one-month interval, respectively. For three-dimensional segmentation of tumors, ROIs along the entire enhancing tumor margin of cross-sectional area were drawn at axial views of standard and ultrafast images from top to bottom of each tumor by two radiologists. The initial phase contrast-enhanced images from standard MRI and U2 phase images from ultrafast MRI were chosen for tumor evaluation (Fig. 3). Three-dimensional segmentation of the tumor was performed using a semi-automated method with MRIcro software (version 1.40, https://www.nitrc.org/projects/mricro/). In cases of disagreement between the two radiologists on the classification of background parenchymal enhancement (n = 11) or the location of the segmented tumor (n = 2), a third radiologist (S.E.S.: a dedicated breast radiologist with 13 years’ of experience in breast imaging) reviewed the images and made the final decision.
Fig. 3
Ultrafast and standard MRI in a 30-year-old woman with triple-negative invasive ductal carcinoma. A Ultrafast MRI taken 16.8 s after contrast agent injection. B Standard MRI taken 58.8 s after contrast agent injection. Both images show an oval-shaped, irregular marginated, rim enhancing mass in the left outer breast. For three-dimensional tumor segmentation, the entire enhanced tumor margins were drawn from top to bottom of each tumor in axial views of U2 phase postcontrast ultrafast MRI and the initial phase postcontrast standard MRI. Among the 14 ultrafast images, U1 is the first phase in which the signal intensity of the hotspot region of interest of the tumor is 10% higher than the average signal intensity of unenhanced images. U2 is the immediate next phase of U1 and the well-established tumor enhancement time
Image normalization based on mean and standard deviation was performed prior to isotropic resampling to ensure consistency across all images. Isotropic resampling was performed before feature extraction to enhance the robustness of the features. A total of 1618 radiomic features of four groups were extracted from each cancer on both standard and ultrafast images: (a) first-order statistical features (n = 17), (b) shape and volume features (n = 7), (c) texture features using the gray-level co-occurrence matrix (GLCM) and gray-level run length matrix (n = 162), and (d) wavelet-transformed features (n = 1432) [14, 26]. Detailed feature evaluation is presented in Supplementary information. We extracted radiomic features in compliance with the image biomarker standardization initiative [27] using the Pyradiomics 3.1.0 library (https://www.radiomics.io/pyradiomics.html) in Python 3.8, with default setting. The radiomics quality score of this study was 25 (69%) out of 36 [14, 26] (Supplementary Table 1).
Classification metrics and model constructionMedical records were reviewed to collect histological data. HR including estrogen and progesterone, and HER2 status and molecular subtypes were evaluated in surgical specimens from 174 participants who underwent surgery and core needle biopsy specimens from 51 participants who underwent neoadjuvant chemotherapy or palliative chemotherapy. The immunohistochemistry results for HR and HER2 were dichotomized as positive or negative. For HR status, greater than 2 of the Allred scoring system was considered positive [28]. HER2 overexpression was determined as 3 + immunohistochemistry staining or 2 + immunohistochemistry staining with HER2 gene amplification detected by silver-stained in situ hybridization. Molecular subtype was classified into three types according to St. Gallen classification criteria: luminal, HER2-overexpressed, or triple-negative [9].
The extracted radiomic and kinetic features were first subjected to z-score normalization. MRI feature selection was performed using the least absolute shrinkage and selection operator (LASSO) method, followed by fivefold cross-validation to determine the optimal lambda value of 0.05. Specifically, the dataset was divided into five equal-sized subsets; in each iteration of the cross-validation, four subsets were combined to form the training set, while the remaining subset was designated as the validation set. This cycle was repeated five times, and each subset was used only once as a validation set, comprehensively evaluating the performance of the model across the entire dataset as an average value. The LASSO process was repeated 25 times, and during each iteration, features that were selected 20 times were considered statistically significant as radiomic features. Additionally, an additional criterion was applied, where only features with a LASSO coefficient threshold of 0.6 and above were retained. Consequently, a final set of seven top features was identified. These features were used as predictors in the linear regression analysis [29, 30]. Moreover, the class weights in the linear regression models were adjusted based on the class frequencies in the input data. Specifically, each class's weight was set inversely proportional to its frequency, ensuring that samples from the minority class received higher weights compared to those from the majority class. The detailed classification metrics and model construction method are presented in Supplementary information.
Statistical analysisWe tested the association between MRI radiomic features and histological factors and subtypes in standard and ultrafast MRI models. Heat maps were generated using Pearson correlation coefficients to visualize the linear associations between variables. The model performance of each reader was evaluated using an area under the receiver-operating characteristic curve (AUC), sensitivity, specificity, and accuracy using the Scikit-learn library in Python [31]. The AUC was calculated to assess the discriminatory power of the model, and 95% confidence intervals (CI) were calculated to estimate the uncertainty and precision of the AUC estimate. The DeLong test was used to determine any differences between the two models based on the receiver-operating characteristic curves.
We also evaluated the agreement between the segmentations of R1 and R2 using the Dice similarity coefficient and the Jaccard similarity coefficient (MATLAB R2023b) [32,33,34]. When segmenting a ROI in an image, it is essential to assess the consistency between multiple readers given the potential subjectivity of the segmentation. The Dice similarity coefficient quantifies the overlap between two sets, with a value of 1 indicating perfect overlap and 0 indicating no overlap. Similarly, the Jaccard similarity coefficient measures the ratio of the intersection to the union of two sets, where a score of 1 denotes complete agreement and 0 means no overlap. Statistical significance was determined using a P value threshold of less than 0.05. The overall research flow of the study is presented in Fig. 4.
Fig. 4
Illustration of the radiomics workflow. Three-dimensional tumor segmentation was performed on ultrafast MRI and standard MRI by two readers (Reader 1: a dedicated breast radiologist, Reader 2: a radiology resident), independently. The tumor segmentation agreement between two readers was evaluated using Dice and Jaccard similarity coefficients. After segmentation, 1618 radiomic features (first-order statistical features, shape and volume features, texture features, and wavelet-transformed features) were extracted. Kinetic features obtained from ultrafast MRI and standard MRI were added to the radiomic features. MRI feature selection was performed using the LASSO method. We tested the associations between MRI radiomic features and histological factors and subtypes in two models of ultrafast and standard MRI. The model performance of each reader was evaluated using the AUC analysis. LASSO least absolute shrinkage and selector operator, AUC the area under the receiver-operating characteristic curve
Comments (0)