
Remember me


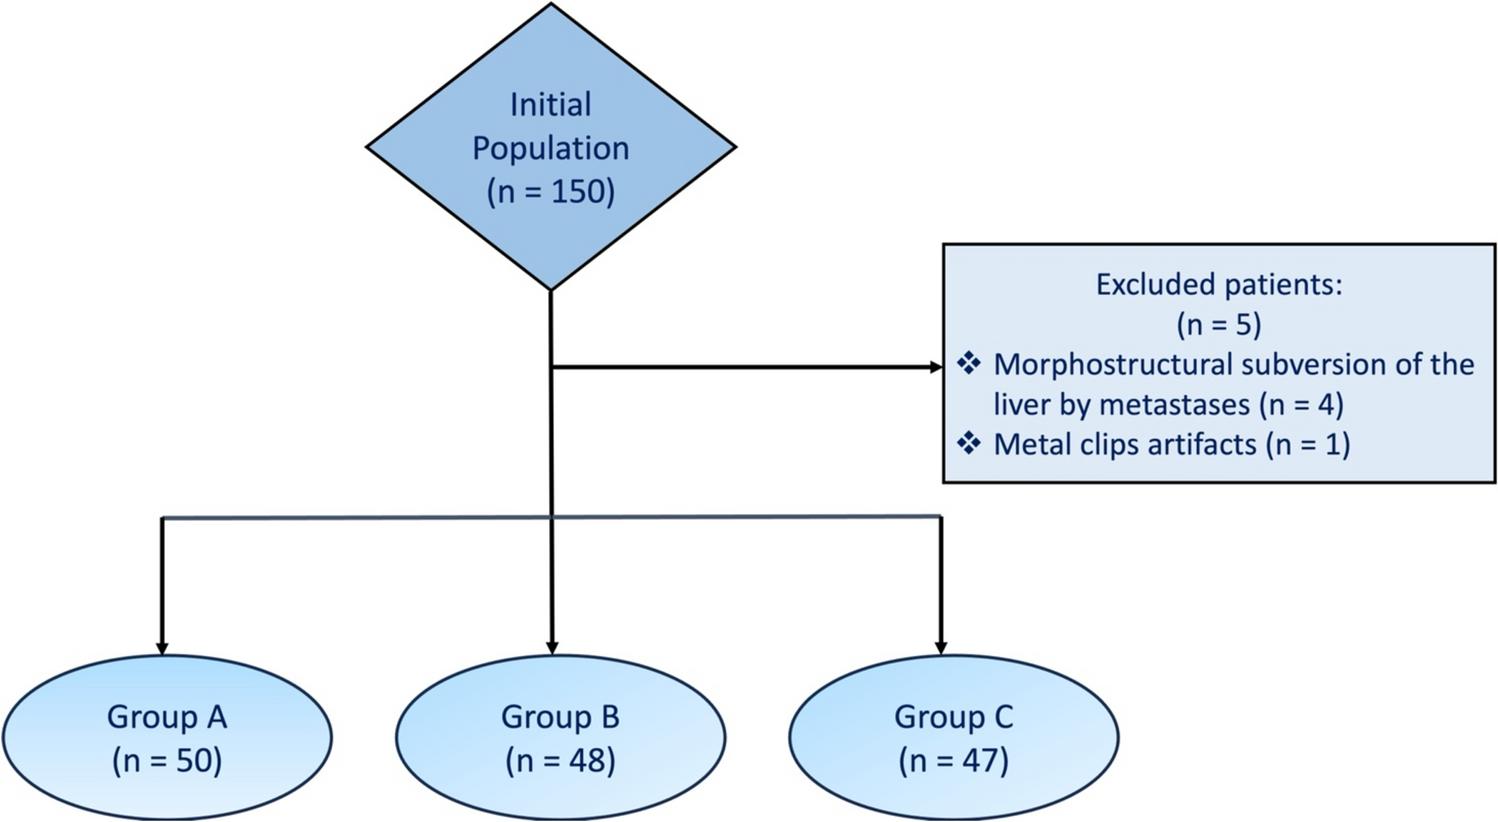

This retrospective study included 699 patients with primary histologically confirmed NPC who underwent concurrent chemo-radiotherapy (CCRT) from 2012 to 2018. The patients had their last follow-up between 2014 and 2021 at Hospital A (N = 393) and Hospital B (N = 306). Demographic information, including staging, sex, age, histology, treatment arm, pre-treatment BMI, height, and pre-treatment/post-treatment bodyweight was collected. Pre-treatment bodyweight refers to the weight measurement at the beginning of the first RT treatment, while end-treatment bodyweight refers to the weight measurement on the last RT day. The net weight loss (nWL) was calculated by subtracting the end-treatment bodyweight from the pre-treatment bodyweight. Patients who did not experience any weight loss after RT, had insufficient contour information, underwent induction chemotherapy before RT, and with missing end-treatment bodyweight were excluded. A total of 337 patients were included in the study. The training cohort consisted of patients from Hospital A (N = 252), while the testing cohort consisted of patients from Hospital B (N = 85). A combined cohort of patients from both hospitals (N = 315) was formed for prognosis evaluation after filtering patient’s survival information. A description of the study cohorts, image acquisition, and treatment protocol can be found in Appendix A1-3. A content diagram of this study is shown in Fig. 1.
Fig. 1
Content diagram of this study. The WCS can be estimated at the pre-RT stage for weight loss prediction, while also can be determined after the RT course for prognostic evaluation
Determined weight censorial score definition and justificationThe percentage weight loss (pWL) is calculated by comparing the net weight loss (nWL) to the patient's pre-treatment bodyweight (preBW), as shown in Eq. (1). This provides a clear understanding of the impact of weight loss relative to the initial weight, without using specific units.
BMI indicates body fatness, ranging from underweight to overweight. When considering the effect of pWL on individuals with different BMIs, underweight individuals are more susceptible to weight loss compared to obese individuals. To address this, a reference BMI of 25 is chosen. pWL is amplified for patients with a BMI below 25 and reduced for those with a BMI above 25, using a logarithmic transformation with 25 as the base. Squaring the difference further emphasizes the scaling disparity. This adjustment compensates for the greater impact of weight loss on underweight patients when compared to obese patients with the same pWL. The adjusted pWL was shown in Eq. (2).
$$}\;} = (}_}}} 25)^ \times }$$
(2)
Finally, the determined Weight Censorial Score (dWCS) is calculated by scaling the centered pWL negatively according to the patient’s body height (unit of meter [m]), shown in Eq. (3). Significant weight loss during RT is likely due to daily energy intake being less than energy consumption over time. Taller individuals generally have a higher energy consumption due to their larger body size. While the exact daily energy absorbed is difficult to measure, reduced energy intake through food is observed as the main factor contributing to weight loss in RT patients. If two individuals have the same centered pWL but differ in height, the taller individual will experience a greater net energy gap between absorption and consumption, resulting in more significant weight loss.
$$} = \frac}\;} \times }}}} - 1} \right)}}$$
(3)
Equation (3) describes how the dWCS is calculated by centering the pWL based on BMI and scaling it according to height, with the only variable is the nWL measured at the end of RT. The dWCS serves as a harm score that reflects the impact of the nWL observed in patients after RT, censored with their pre-treatment body information. The following regression task of estimated Weight Censorial Score (eWCS) focused solely on the dWCS as the target endpoint.
Pre-processing and feature extractionTwo image modalities of contrast-enhanced computed tomographic image (CECT) and RT dose stimulated map (dose map) were used for feature extraction. Four targeted regions of interest (ROI) were identified: gross tumoral volume (GTVnp), gross nodal volume (GTVn), combined left and right parotid glands (Parotids), and Larynx. CECT images were resampled to a voxel size of 1 × 1 × 1 mm with a fixed bin width of 25 HU. The dose map was also resampled to 1 × 1 × 1 mm with a fixed bin width of 1 Gy (Gray [Gy]). Image feature extraction was performed separately for each ROI under the two image modalities, including all the features listed in Appendix C1, unless specified otherwise. Shape class features were not extracted on the dose map since they were extracted on CECT. DVH and Moment class features were not extracted for ROIs under CECT. The Parotids feature represents the summation values of the left and right parotid glands. There were 105 features extracted on CECT and 185 features extracted on the dose map for each ROI. DVH and moment features were calculated from our in-house software, and the traditional Radiomics features were extracted through PyRadiomics packages.
Feature selection for estimating weight censorial scoreFeature selection was conducted in the training cohort by using a simple statistical test filtering approach, without employing any complex selection algorithm. To determine the significance of the association between each feature and the target variable dWCS, a univariate linear regression test was used. This test computed an F-score with p-value, indicating the significance of the relationship. Features with a p-value greater than 0.05 were removed. In the next step, we calculated the mutual information (cross entropy value) between each significant feature and the target variable. These values were ranked in ascending order. A Pearson correlation test between the significant features was then conducted. If the correlation coefficient (R) between a pair of features exceeded |0.9|, we removed the feature with the lower cross entropy value. All the statistical analyses for feature selection were conducted using the Sci-kit Learn package, with formulas outlined and explained in Appendix B1.
Modeling estimated weight censorial scoreTo ensure consistency, the selected features were normalized using min–max scaling, which mapped the values to a range of 0 to 1 based on the data distribution of the training cohort. For modeling, we opted for an ordinary least squares linear regression approach. The objective was to fit a coefficient for each selected feature, minimizing the residual sum of squares between the observed dWCS in the training cohort and the predicted eWCS obtained from the linear approximation. During the model fitting process, no penalty (l1/l2 norm) or cross-validation was applied. The goal was to find the simplest best fit without incorporating any additional constraints or evaluation techniques. To validate the regression performance, samples from the testing cohort were normalized using the scaling parameters obtained from the training cohort. These normalized features were then inputted into the fitted model to generate the eWCS values. All operations were carried out using Sci-kit Learn package with the descriptions provided in Appendix B1.
Prognostic hypothesis of weight censorial score ratio$$}\;} = \frac} \times }\; \times \;\left( } - 1} \right)}}}_}}} 25} \right)^ \; \times \;}}}$$
(4)
Since the dWCS is calculated by scaling the end-treatment bodyweight loss with pre-treatment body information, taking the reciprocal step of these calculation allow an estimated nWL (kg) could be obtained from model output eWCS, shown in Eq. 4.
$$}\;} = \frac}}}}}} = \frac}\;}\;}\;}\;}\;}\;}\;}}}}\;}\;}\;}\;}\;}}}$$
(5)
Therefore, the WCS ratio (shown in Eq. 5) provides a comparison between the predicted nWL estimated before CCRT starts and the actual nWL measured on the CCRT-end day. For the WCS ratio of 1 signifies the actual WL is equal to the estimated WL, we chose this value as the cut-off for dichotomizing patients into high- and low-risk groups for prognostic evaluation. Patients with WCS ratio larger than 1 are hypothesized to have a worse prognosis than patients with WCS ratio smaller than 1 as they experienced a higher degree of WL than expected.
Statistical analysisThe association between dWCS and categorial clinical factors were evaluated by One-way ANOVA test. For the continuous clinical factors, its association with dWCS was assessed by Pearson correlation test. A two-sided p < 0.05 was considered significant in both test. The estimated nWL and pWL converted from eWCS were compared with their actual values, respectively, using Concordance Correlation Coefficient (CCC), Coefficient of determination (R2), and Pearson correlation test (Metrics explained in Appendix B2), in order to evaluate the prediction agreements. A mean absolute error (MAE) was calculated to assess the accuracy of estimated nWL and pWL at sample-level. Receiver operating characteristics (ROC) curves were generated from the estimated pWL values in predicting cWL, which thresholds were chosen at pWL at ≥ 5%, ≥ 7.5%, and ≥ 10%. The area under the ROC Curve (AUC) was used to evaluate the accuracy of cWL event predictions.
For prognostic evaluation, the starting time of distant metastasis-free survival (DMFS), progression-free survival (PFS), and overall survival (OS) were defined as the end of RT day. The PFS was defined as the time from starting time to either date of disease progression or death from any cause. Patients are dichotomized high- and low-risk groups according to the hypothesized (WCS ratio) value of 1. Survival curves were generated, respectively, for two groups using Kaplan–Meier method and compared by log-rank test. The prognostic value of WCS ratio was evaluated by univariate Cox regression and confirmed under multivariable Cox regression, with hazard ratio (HR) and 95% confidence interval provided. A two-sided p < 0.05 was considered significant.
Comments (0)