
Remember me
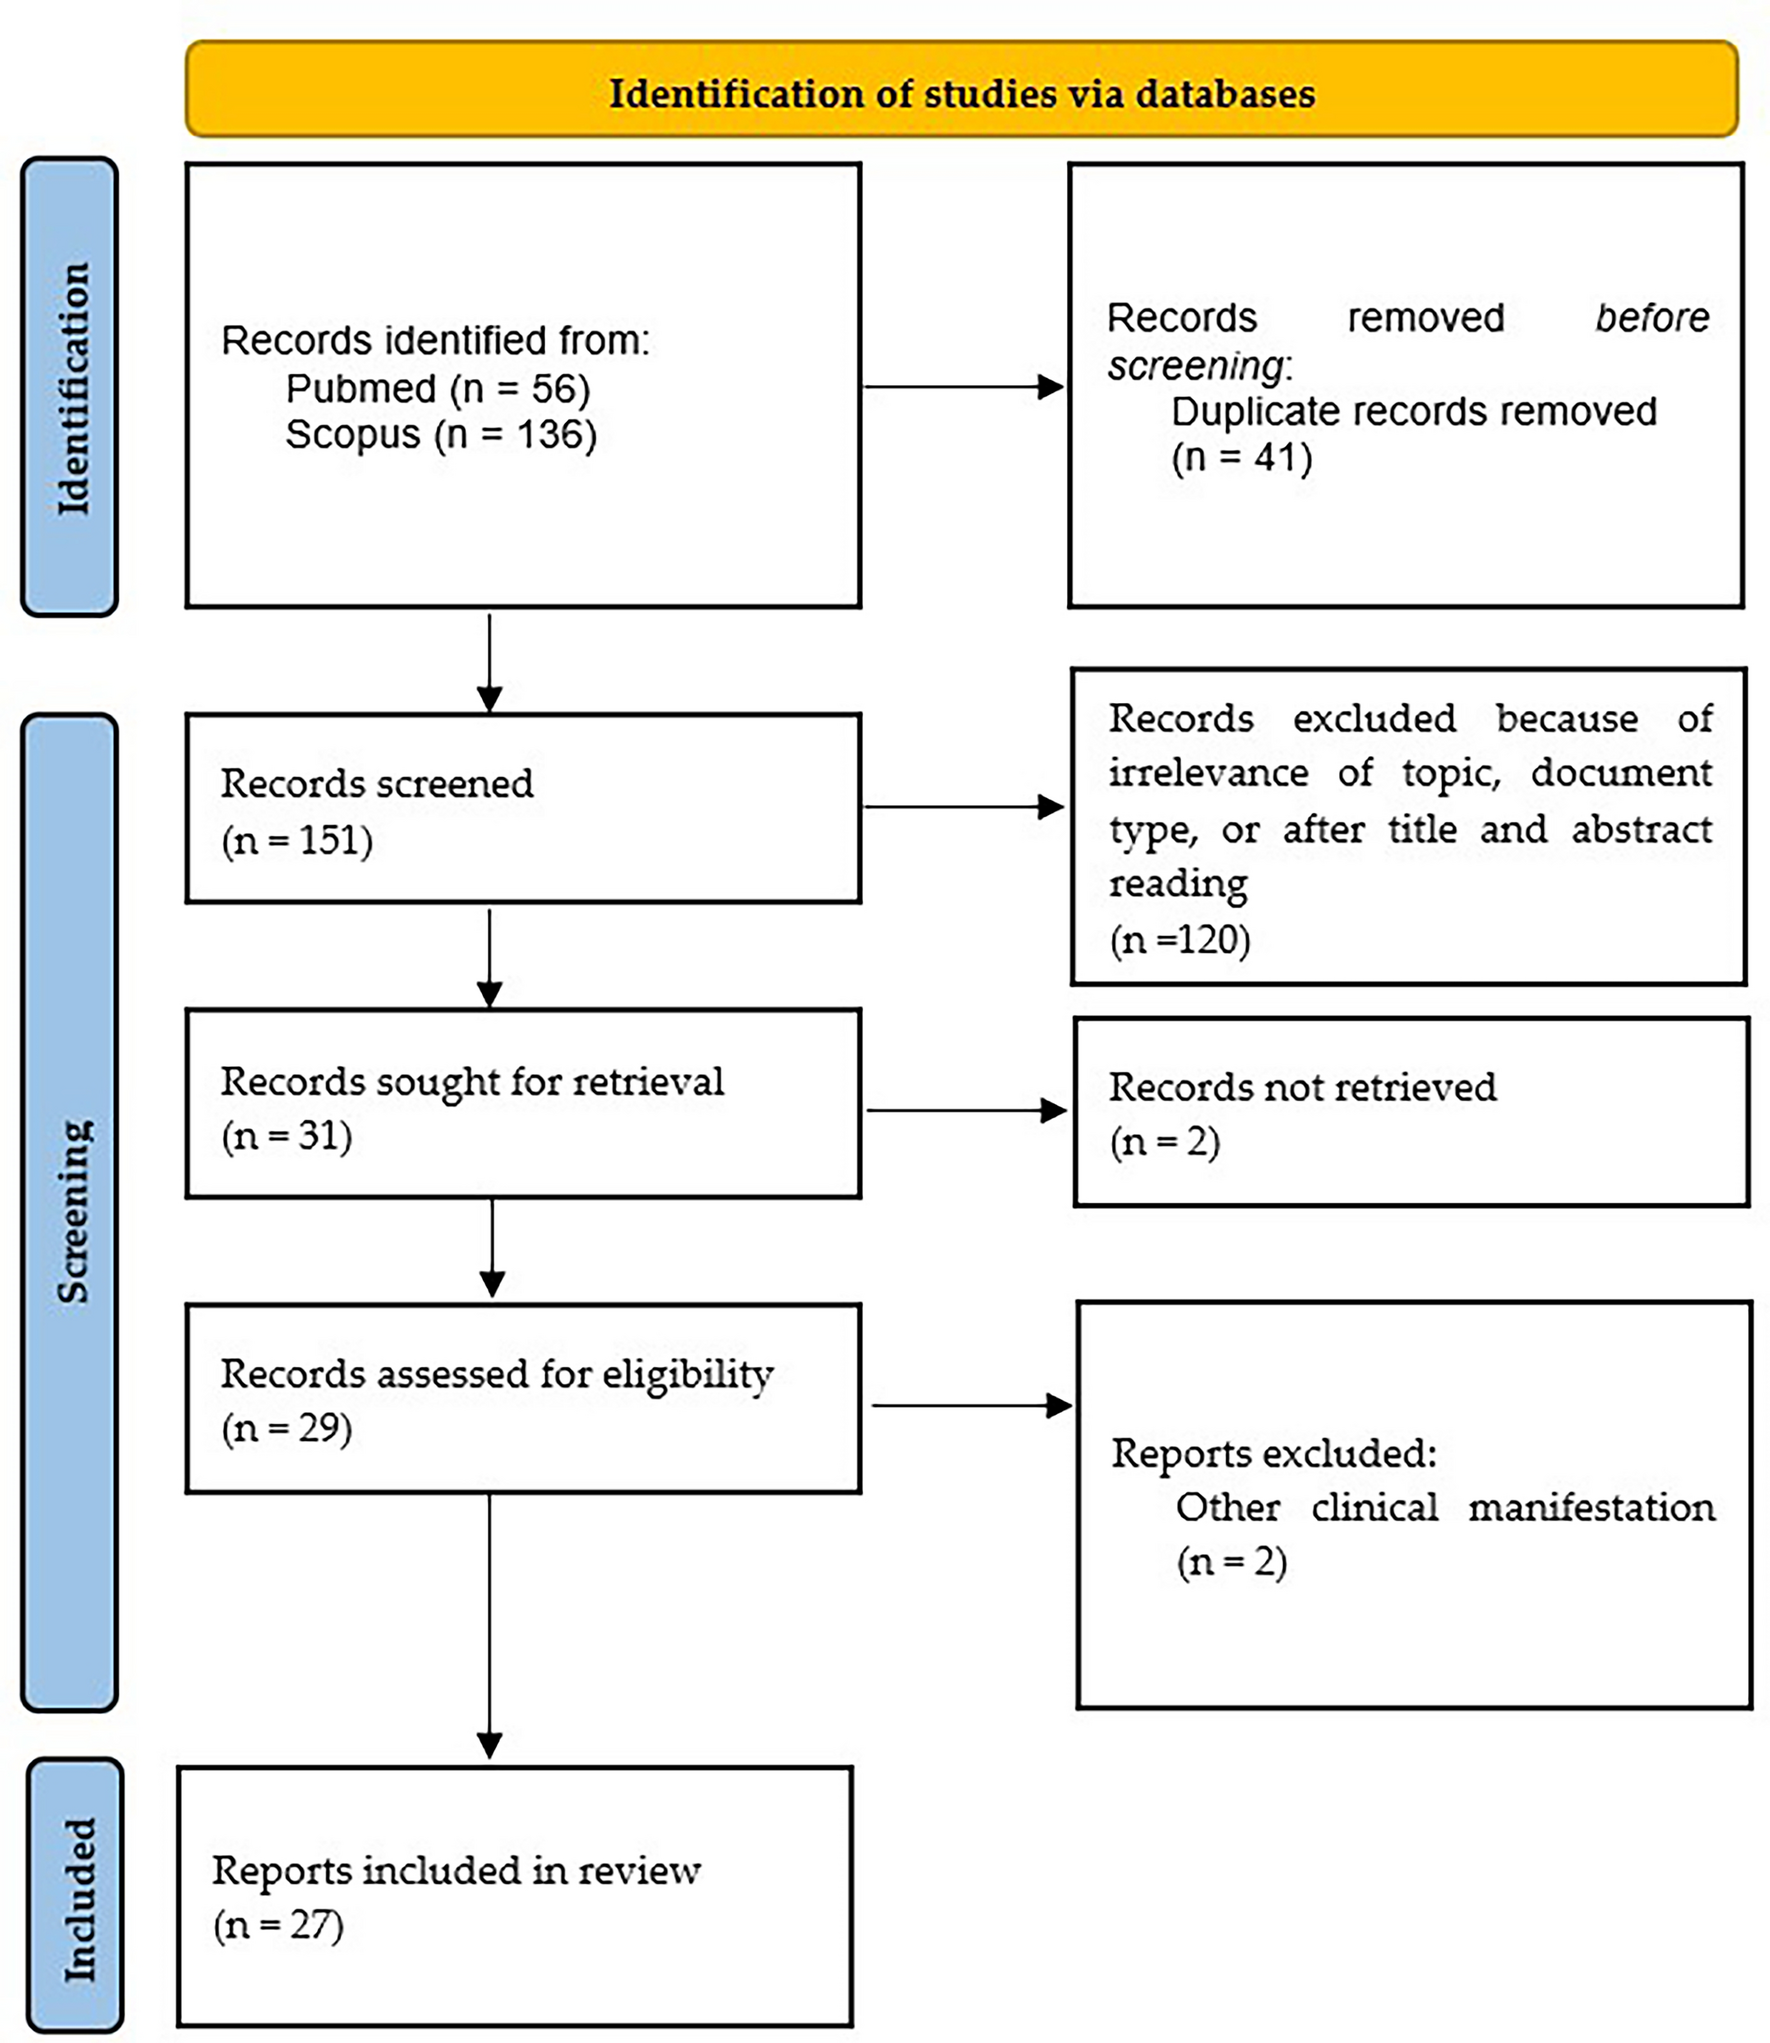
The results from the complete search can be seen in the PRISMA flowchart (Fig. 1). After database searching, 4679 records were identified. Of these, 16 studies met the inclusion criteria and were included in the review [22,23,24,25,26,27,28,29,30,31,32,33,34,35,36,37]. Cohen’s kappa statistic indicates perfect agreement between the two reviewers in our screening process (k = 1). See Supplementary Table S3 for Cohen’s kappa calculation table. The updated search found no additional studies that met our inclusion criteria.
Fig. 1
Flowchart of the literature search and study selection with the number of studies at each stage (n)—4679 studies were identified through database searches conducted on 18 January 2023. After screening 16 studies were eligible
Study CharacteristicsThe characteristics of all the included studies [22,23,24,25,26,27,28,29,30,31,32,33,34,35,36,37] are summarised in Table 1. The 16 included studies [22,23,24,25,26,27,28,29,30,31,32,33,34,35,36,37] took place between 2011 and 2022 across eleven countries in four different continents. Most of the studies included were observational in design, including cross-sectional (n = 11) [22, 23, 26, 27, 29, 31,32,33,34,35,36], cohort (n = 3) [24, 25, 28], and case–control (n = 1) [37] studies. However, one randomised control trial [30] was also eligible for inclusion. Across the studies, there were 252,490 hospital inpatients reported with the dementia and diabetes mellitus comorbidity. However, the sizes of the studies varied, ranging from a population of just 16 patients with the comorbidity [29] to the largest population of 143501 [35] (median = 337). The outcomes reported were hospital length of stay (n = 6) [23, 25, 29, 32, 35, 36], hospital mortality (n = 11) [22, 23, 26,27,28, 31,32,33,34,35, 37], and hospital readmission (n = 6) [24, 25, 30, 32, 35, 36]. However, no study was excluded based on missing data.
Table 1 Characteristics of included studies–study details and key aspects of the study design for all 16 included studiesQuality AssessmentThe appraisal tools for cross-sectional, cohort, case–control studies and randomised control trials were used to accommodate for the different study designs. See Supplementary Table S4 for the respective questions used from each tool. A summary of the quality assessment results can be seen in Supplementary Table S5. No studies were excluded based on quality assessment, as low-quality studies can still provide valuable insight.
Eleven studies [22, 23, 26, 27, 29, 31,32,33,34,35,36] were assessed by the cross-sectional tool. Of these, three were medium quality [22, 23, 27] and eight were high quality [26, 29, 31,32,33,34,35,36]. Generally, the studies performed well regarding questions relating to sampling, reducing confounding, outcome measures and statistical analysis. However, nine studies [22, 23, 26, 27, 31,
Comments (0)