Data Source
This study utilized the DeSC database (DeSC Healthcare, Inc.), a large commercial medical and dental claims database in Japan. Studies using this database can be found elsewhere [8, 9]. This database contains health insurance claims data from multiple types of health insurers: (i) National Health Insurance for individual proprietors and unemployees (Kokuho), (ii) health insurance for employees of large companies (Kempo), and (iii) the Advanced Elderly Medical Service System for those aged 75 years and over (Koki Koreisha Iryo Seido). Thus, the DeSC database included young, middle-aged, and elderly individuals. Medical and dental claims data for outpatients and inpatients were anonymized at the individual level. The database includes the following information: (i) unique identifier, (ii) age and sex, (iii) diagnoses based on the International Classification of Diseases, 10th Revision (ICD-10) codes, (iv) procedures, (v) drugs dispensed based on the Anatomical Therapeutic Chemical Classification System, and (vi) dates of enrollment and disenrollment in insurance. The DeSC database contains information on approximately 12,000,000 individuals, and its age distribution of the DeSC database is comparable to the Japanese population estimates [9].
Study Design and Patient Selection
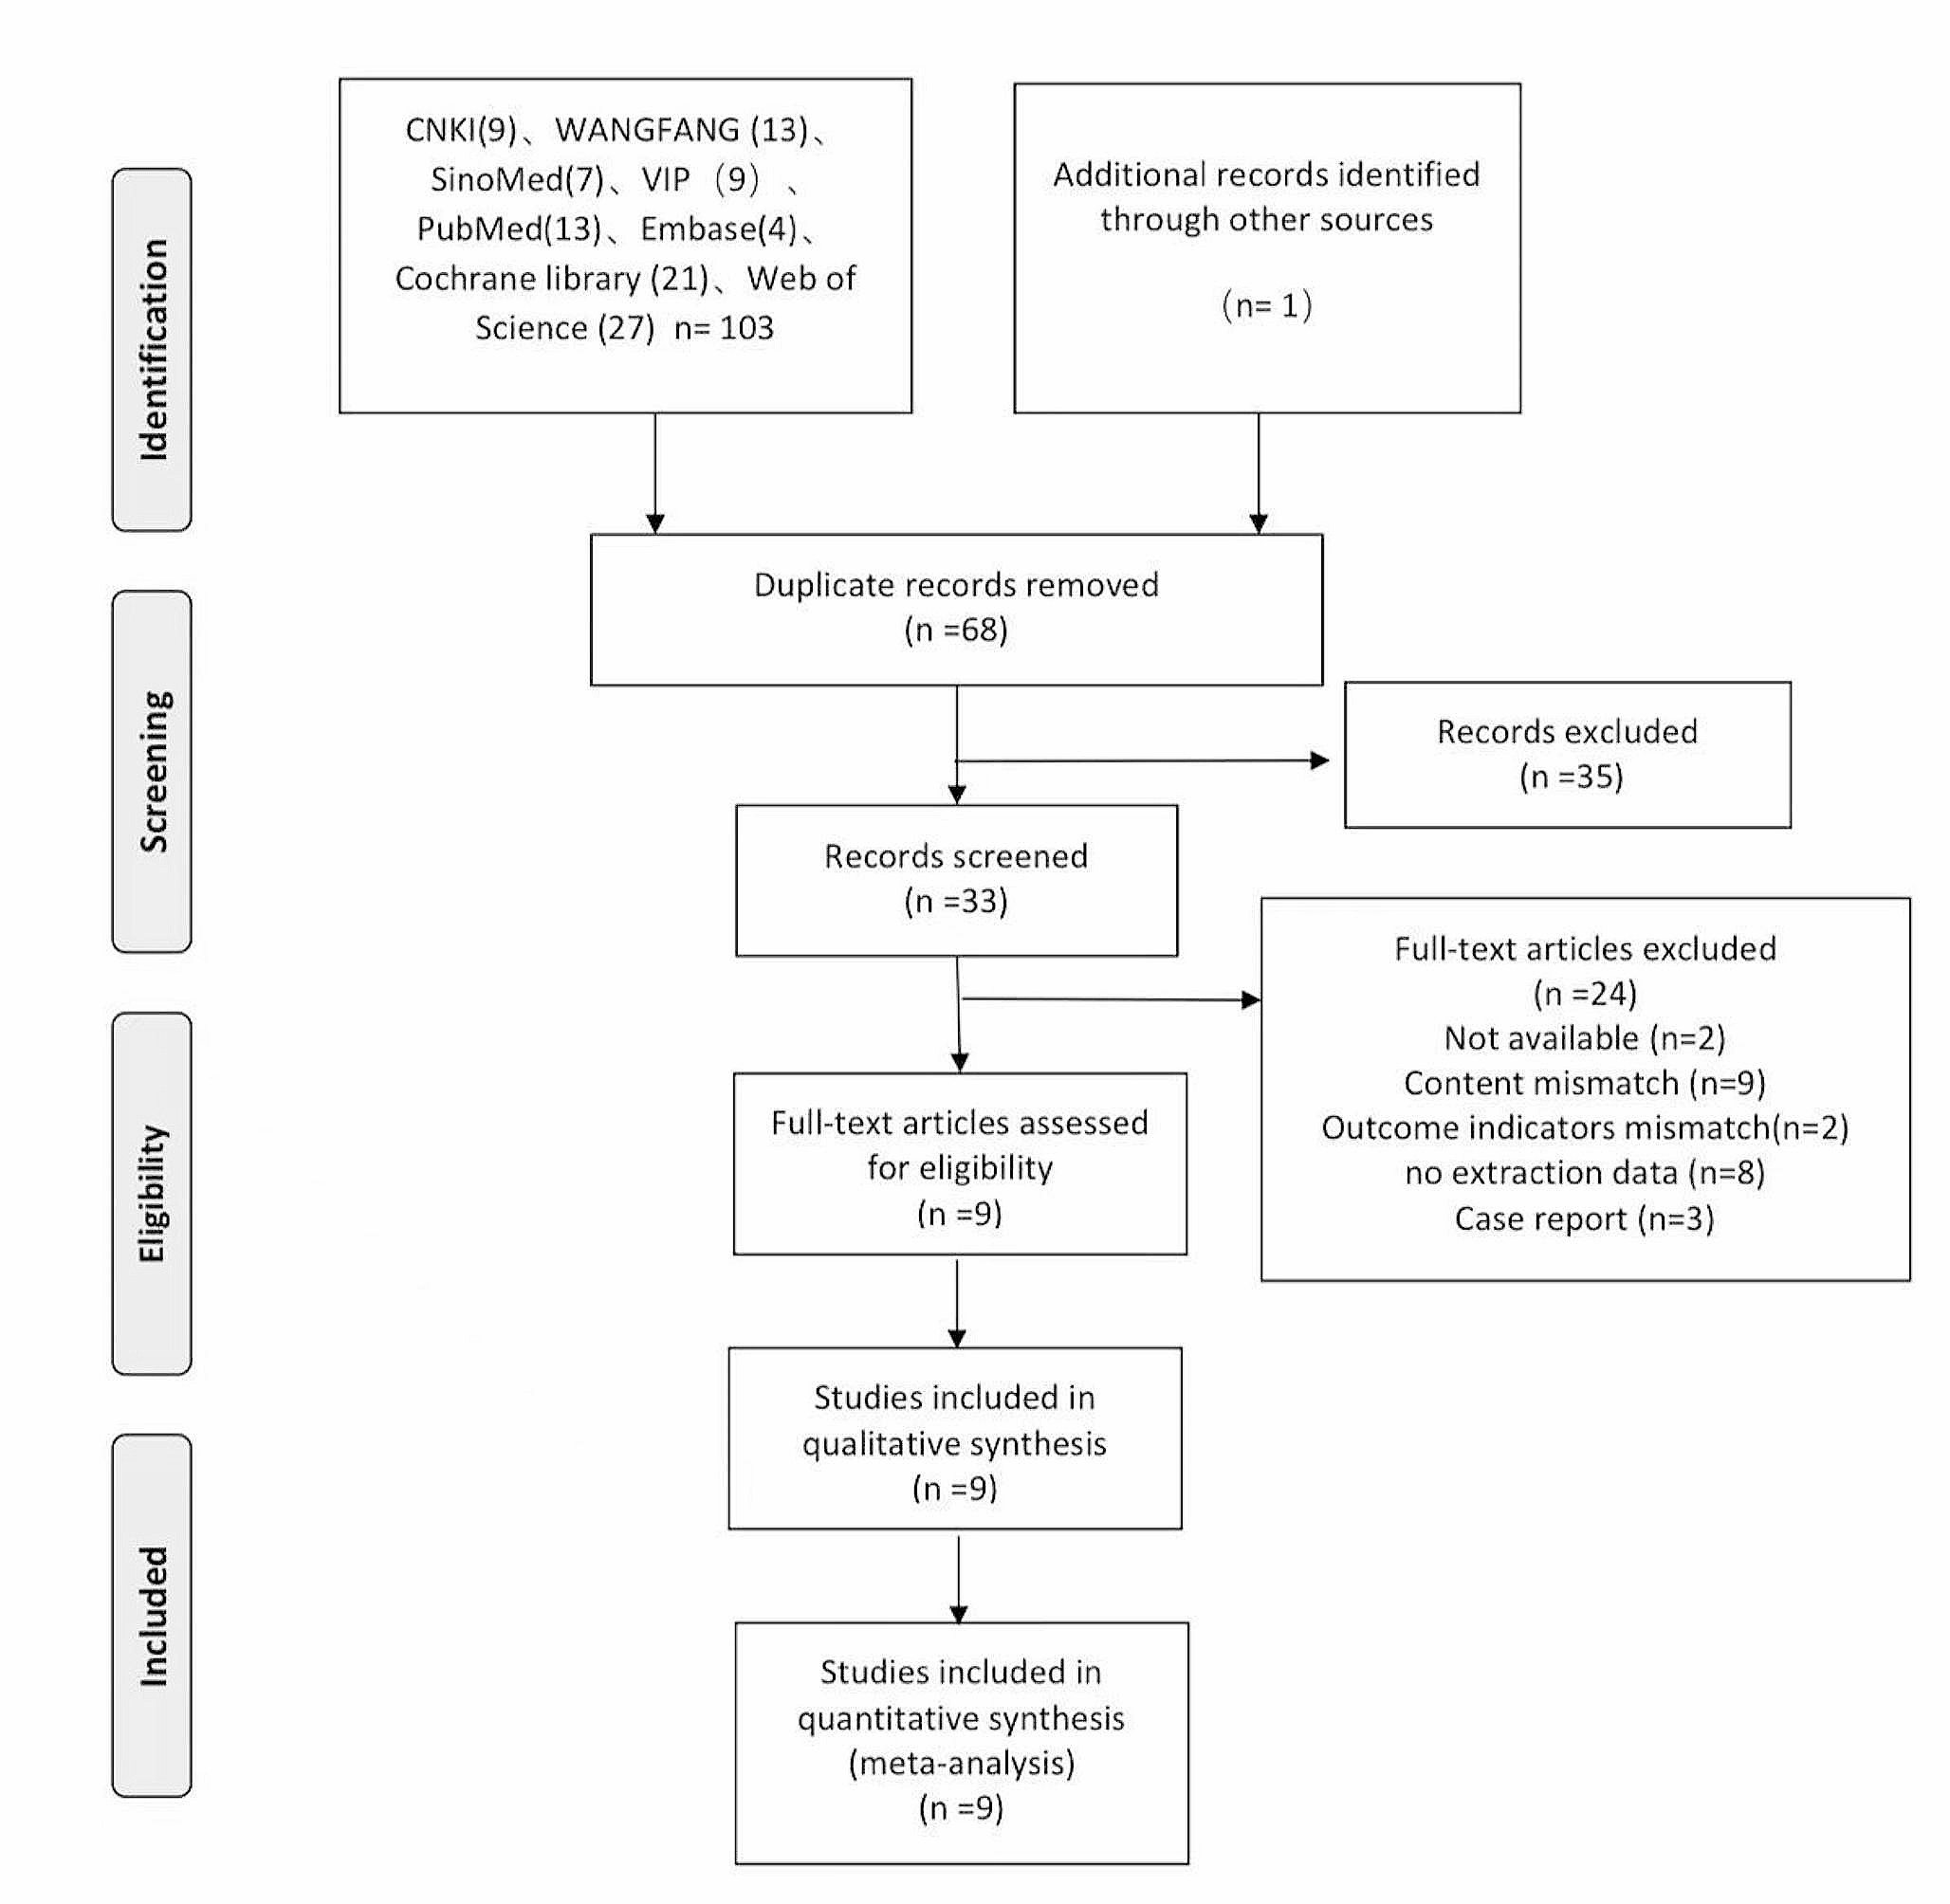
This retrospective cohort study used the data collected between April 2014 and March 2021. A new prevalent user design was used [10]. We included patients who (i) were diagnosed with stroke (ICD-10 I60–I63), (ii) underwent swallowing rehabilitation within a year from the diagnosis of stroke, (iii) were newly prescribed the target drugs listed in Online Resource 1 (initial pharmacotherapy for hypertension, diabetes mellitus, or hyperlipidemia), and (iv) had at least 1 year of any records in the DeSC database before cohort entry. We defined the patients’ age on the day of new use of the target drugs. We excluded patients who (i) were prescribed the target drugs within the previous year, (ii) were newly prescribed the target ODTs and non-ODTs at the same time, (iii) were under 65 years of age since those aged ≥ 65 years were reportedly more likely to experience dysphagia than the younger age groups [11], (iv) were prescribed the target drugs less than twice in the study period, and (v) had a gastrostomy before cohort entry. The patients were followed-up from the initiation of the target drugs to assess the outcomes.
Exposure of Interest
We compared patients who received targeted ODTs (ODT group) with those who received active comparators (non-ODT group). Target ODTs were defined as medications used for hypertension, diabetes mellitus, and hyperlipidemia (Online Resource 1). This is because the Japanese Guidelines for the Management of Stroke 2021 recommend medication to prevent recurrent strokes (grades A–C) [12]. Active comparators (non-ODTs) included all drugs with the same target disease as the ODTs.
Variables
We included the following variables in the model: age (65–74, ≥ 75 years), sex, diagnoses, procedures, and drug use history during the pre-prescription period. The variables included in the analyses were based on previous studies investigating aspiration, dysphagia, and salivary disorders [6, 13, 14]. Further details of these variables are provided in Online Resource 2. In this study, the pre-prescription period was defined as the period within 365 days of the initial use of ODTs or active comparators.
Outcome Measurements
The primary outcome was the target drug proportion of days covered (PDC) for 1 year as the patient’s medication adherence [15]. We defined the start date as the first fill date for each target drug and the end date as the date of the last fill. The evaluation period for PDC was set at 1 year, which is the minimum recommended evaluation period according to the guidelines of the National Association of Specialty Pharmacy Clinical Outcomes Committee Adherence Workgroup and the American Society of Health-System Pharmacists section of specialty pharmacy practitioner outcomes and value section advisory group [15]. If the follow-up period was less than 1 year, the PDC for the observed period was assumed to continue for 1 year. We defined the medication adherence threshold as a PDC of 80%, following a previous study of medication adherence [16]. The secondary outcomes were hospital admission for aspiration pneumonia (ICD-10: J69), cardiovascular events (i.e., heart failure (ICD-10: I50, I11), atrial fibrillation (ICD-10: I48), myocardial infarction (ICD-10: I21), angina pectoris (ICD-10: I20), stroke (ICD-10: I60–63), and composite event of cardiovascular diseases [17] within 1 year as a benefit of medication adherence.
Statistical AnalysisHd-PS Estimation
In this study, we used a large claims database in Japan to obtain a large study sample. We conducted a high-dimensional propensity score (hd-PS) matching analysis to balance patient backgrounds and account for confounding factors. Hd-PS analysis was proposed for studies using administrative claims databases to improve the ability to control confounding factors in comparative effectiveness [18]. We performed hd-PS matching between ODT and non-ODT groups. The detailed methods for hd-PS estimation have been described previously [19]. Briefly, the following five processes were conducted: (i) definition of different data dimensions; (ii) identification of empirical candidate covariates in each data dimension during the pre-prescription period; (iii) assessment of the frequencies of candidate covariates; (iv) ranking of candidate covariates of all dimensions by their potential as confounding factors based on Bross’s formula [20], and (v) selection of the top n potential covariates for propensity score modeling.
We structured the following ten dimensions: medical outpatient diagnoses, medical inpatient diagnoses, dental outpatient diagnoses, dental inpatient diagnoses, medical outpatient procedures, medical inpatient procedures, dental outpatient procedures, dental inpatient procedures, and outpatient and inpatient drug use. We included the 500 highest potential covariates and variables described in Online Resource 2 in the logistic regression model for receiving the target ODTs to estimate hd-PS.
Propensity Score Matching
We performed 1:1 nearest-neighbor matching with the caliper width set at 20% of the standard deviation of the propensity score. The balancing properties of the matching covariates were examined using absolute standardized differences between the groups. An absolute standardized difference of > 10% was considered to indicate an imbalance. The chi-squared test was used for categorical variables and Student’s t-test was used for continuous variables to compare the outcomes between the ODT and non-ODT groups.
Subgroup Analysis
We conducted subgroup analyses stratified by treatment with ODTs (hypertension, diabetes, and hyperlipidemia) to compare medication adherence between the ODT and non-ODT groups. Subgroup analyses were also performed, stratified by the presence of polypharmacy (non-polypharmacy, polypharmacy, and hyperpolypharmacy). All prescriptions were identified to determine the number of drugs administered by each patient. Patients were considered to have taken prescribed medications within 60 days prior to cohort entry [10]. We calculated the number of drug classes taken by each patient from the 86 classes (Online Resource 3). Based on the number of prescribed drugs, we classified the patients into three groups [21]: no polypharmacy, polypharmacy (five to nine classes), and hyper-polypharmacy (ten or more classes).
The threshold for significance was set at P = 0.05. The hd-PS estimation was performed using R version 3. 6. 1. (R Foundation for Statistical Computing, Vienna, Austria). The remaining statistical analyses were performed using Stata SE (version 17.0; StataCorp, College Station, TX, USA).


Comments (0)