
Remember me

This study included ten nonconsecutive patients with histologically confirmed EC (nine with SCC and one with AC) having undergone NRCHT+R at the University Hospital Carl Gustav Carus Dresden (UKD), Germany. The inclusion criteria for these analyses were patients who had (1) participated in the EVI study for fiducial marker placement (BO-EK-148042017) and undergone resection after NRCHT, (2) showed the presence of at least one fiducial marker on both the cranial and caudal GTV borders on postoperative imaging and in the resection specimen, and (3) had residual tumor after NRCHT+R. The Ethical Committee of the Dresden University of Technology (TUD), Germany, approved the study on 20.06.2022 (BO-EK-177042022). Written informed consent to use data for research purposes had been obtained previously from all patients.
Patient characteristics and treatment regimenAfter implantation of the fiducial markers during esophageal endoscopy [16], all patients underwent diagnostic [18F]-fluorodeoxyglucose positron-emission tomography and CT (FDG-PET-CT) within one to two weeks prior to NRCHT, which also served for radiation treatment planning purposes. Based on the information obtained from FDG-PET-CT and during endo-esophageal endoscopy, the GTV and CTV were defined following our internal guidelines: the CTV was created from the GTV using margins of 2.5 to 3 cm in the cranial and caudal directions, respectively, and a circumferential margin of 1.5 cm. Radiation treatment planning was performed using RayStation (versions 8B or 10B, RaySearch Laboratories AB, Stockholm, Sweden) applying an intensity-modulated proton therapy technique and correcting for the relative biological effectiveness (RBE) by a factor of 1.1. All ten patients received a total proton dose of 40 Gy (RBE) in 2‑Gy (RBE) fractions over the course of 4 weeks. Simultaneous chemotherapy was administered using carboplatin (AUC2) and paclitaxel (50 mg/m2 BSA) once weekly. All patients underwent surgery 5–7 weeks after the end of NRCHT. Tumor staging was performed according to the Union for International Cancer Control (AJCC/UICC, 8th edition) [17]. Treatment recommendations were made in the multidisciplinary tumor board of the NCT/UCC Dresden, and patients with cT3 and/or cN+ disease were treated with NRCHT+R; however, one of the patients with tumor stage cT2 cN0 underwent NRCHT due to suspicion of lymph node metastasis.
Sample processing and image registrationNative resection specimens on ice were sent from the Department of Visceral, Thoracic, and Vascular Surgery to the Institute for Pathology, both of the UKD, immediately following tumor resection. The specimen was removed from fixation, opened, and pinned on corkboard with the endoluminal side facing upwards and collected for CT imaging (Somatom Definition AS, Siemens Healthineers, Erlangen, Germany). Navigational charts revealing the positions of fiducial markers within the specimen were produced from co-registered CT and photography using custom software implemented in Python/SciPy [18]. Tissue blocks were systematically cut and labeled on the chart by the pathologists, such that their exact in vivo position could be reconstructed. Afterwards, the blocks were placed into paraffin wax-embedding cassettes for further processing and storage.
Immunofluorescence stainingHematoxylin and eosin (H&E) staining of the resected tissue specimen after FFPE was conducted by the pathologists for histological assessment of the presence and location of viable tumor cells for diagnostic purposes (Supplementary 1).
FFPE tumor blocks were subsequently obtained from the BioBank Dresden. On all FFPE blocks with residual tumor, multiplex immunofluorescence staining was established at the Institute of Immunology, Faculty of Medicine Carl Gustav Carus, TUD, Germany as previously described ([19]; Fig. 1; summarized in Supplementary 2).
Fig. 1
Multiplex immunofluorescence staining of tissue sections shows expression of tumor microenvironment markers. a Membrane expression (red) of FAK+ cells in tumor nests. b Membrane expression (yellow) of CD44+ cells in tumor nests and tumor stroma areas. e Nuclear expression (white) of Ki67+ cells in tumor nests. g Membrane expression (green) of ILK+ cells in tumor stroma areas. i Nuclear expression (magenta) of HIF-1α+ cells in tumor nests and tumor stroma areas. b,d,f,h,j Red encircling corresponds to the segmentation of marker positive cells
Image acquisition and analysisAcquisition of the multiplex immunofluorescence staining images was performed using the Vectra 3 automated imaging system (Akoya Biosciences, Marlborough, MA, USA). Digital image analysis of the scans from all tumor sections was conducted in QuPath (version 0.3.2 University of Edinburg, UK) [20]. Since biomarker expression in the tumor stroma has repeatedly been shown to be a prognostic factor for overall survival and tumor progression in different cancer types [21], we hypothesized that higher expression of Ki67+, ILK+, HIF-1α +, CD44+, and FAK+ in tumor nests than in tumor stroma is associated with the depth of tumor infiltration.
Pan-cytokeratin (PanCK) expression in tumor tissue sections is a well-established diagnostic and prognostic marker in many solid tumors, including esophageal cancer [22, 23]. It has been utilized as a standard to detect and discriminate the intraepithelial PanCK+ tumor area from the stromal area in immunohistochemically stained resection tissues, thus enhancing TME assessment [24,25,26]. Therefore, in the first part of the image analysis, a deep learning algorithm based on PanCK staining was used to discriminate tumor nests (PanCK+) from tumor stroma (PanCK-) and to generate the corresponding annotations (tumor nest, tumor stroma), while removing areas of artifacts and autofluorescence. After tissue annotation, all cells were segmented in the DAPI nuclear-stained channel using the StarDist cell segmentation tool [27]. Next, classifier algorithms were trained for each individual marker, from which a composite classifier was generated. Quantification was based on the number of nuclear (Ki67+, ILK+, HIF-1α+) or membrane (CD44+, FAK+) stainings specific for each marker.
Before implementing each of the algorithms, a validation set of images was used to verify the reliability of the algorithm and results were checked for plausibility by two independent observers (BI, ET; Supplementary Fig. 2).
Fig. 2
Boxplots showing the percentage of tumor cells positive for five markers of the tumor microenvironment within tumor nests and tumor stroma. Mann–Whitney test: ** p < 0.001, ns = not significant
The number of cells positively stained for each marker, including co-expression ratios, were extracted from QuPath using a script and percentages were further calculated in Microsoft-Excel (version 2016, Microsoft cooperation 2018, Redmond, WA, SA; see supplementary information for the script). This was done by dividing the total number of cells positive for each marker within a specific annotation (tumor nests or tumor stroma) by the total number of DAPI-stained cells with the same annotation.
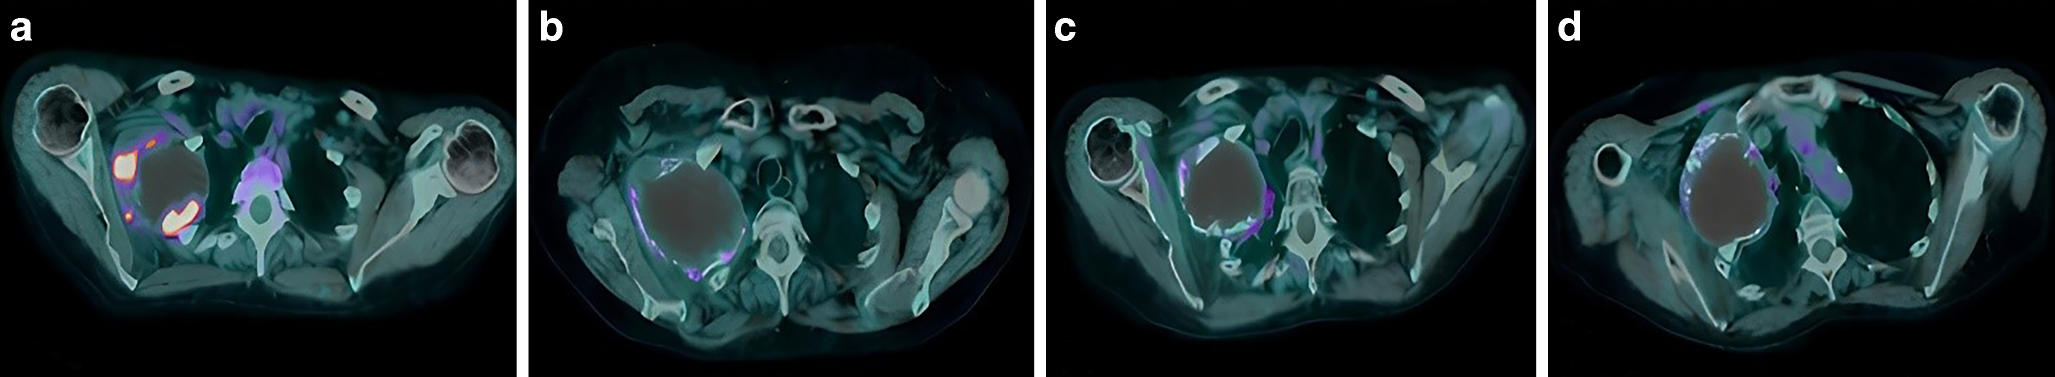
Calculation of the microscopic tumor extensionPatients’ pretreatment PET-CT images were exported as DICOM files and uploaded in the open-source software, 3D-Slicer (version 5.0.3 for Windows) [28]. The esophagus and fiducial markers implanted at the cranial and caudal tumor edges were segmented in 3D using the “fill between function” in the segment editor. Thereafter, the longitudinal distance between the fiducial markers representing the pretreatment in vivo macroscopic tumor was measured. Similarly, on the CT images of the tumor resection specimens revealing the ex vivo positions of fiducial markers, the distances between the fiducial markers were calculated. Finally, the tissue shrinkage rate (%) was calculated by dividing the ex vivo by the in vivo distances.
In patients with remaining tumor cells beyond the fiducial markers, thus resembling residual tumor in the CTV, the distance of the MTE was measured. For this, the tumor extension beyond the fiducial marker was established on the ex vivo FFPE tumor blocks (in millimeters). In order to translate this finding into the in vivo pretreatment situation, individual specimens’ shrinkage rates were multiplied by the calculated MTE and subsequently projected onto the PET-CT images using 3D-Slicer [28, 47].
Statistical analysesStatistical analyses were performed on the percentages of cells positive for the individual markers within the tumor nests and tumor stroma annotations from the specimens of each patient. All the graphs and statistical analyses were performed using GraphPad Prism software version 9.0 for Windows (GraphPad Software, San Diego, CA, USA). Mann–Whitney test was used to compare the expression of the markers between groups, and a p-value < 0.05 was considered significant. Bonferroni correction was used for multiple test adjustment. In addition, a heat map was created to show the co-expression between the markers.
Comments (0)