
Remember me


Between March 6, 2019, and September 14, 2020, 171 NPC patients were screened and 130 (median age 49.5 years and men 76.0%) were enrolled and constituted the intention-to-treat population. Four patients with no measurable lesions per the Independent Radiological Review Committee (IRRC) and one patient who had received only one prior line of chemotherapy were excluded from efficacy analysis. The FAS per IRRC included 125 patients. In addition, one patient who had no baseline measurable lesion according to investigators, and one patient who did not receive at least 2 prior lines of chemotherapy were excluded. The FAS per investigators included 128 patients. Forty-six (36.8%) patients in the FAS per IRRC were PD-L1-positive. Serum EBV copy number at baseline was ≥500 IU/mL in 103 (82.4%) patients. Seventy-seven (61.6%) patients had lung metastasis, 62 (49.6%) had bone metastasis, and 60 (48.0%) had liver metastasis. For prior targeted therapies, 36 patients (27.7%) received prior nimotuzumab, 4 (3.1%) received endostatin and 2 (1.5%) received cetuximab. Forty-six (36.8%) patients had received at least three prior lines of systemic therapy (Table 1).
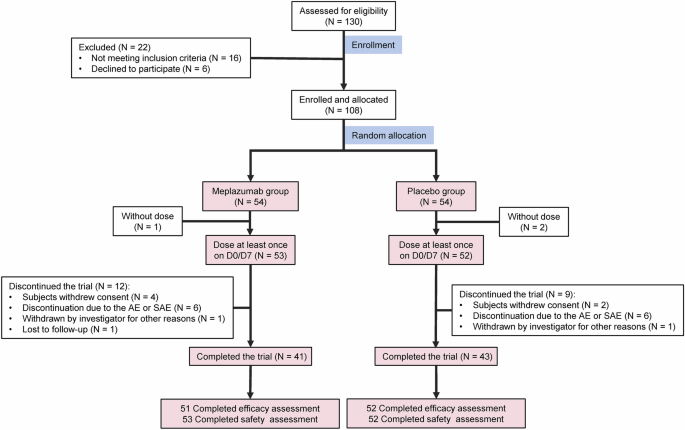
Table 1 Patient demographics and baseline characteristics-ITTThe data cutoff date was September 28, 2022. The median follow-up was 29.6 months. The median treatment duration was 4.1 months (range, 0.03–40.9 months). Eight (6.4%) patients were still receiving treatment. One hundred seventeen (93.6%) patients discontinued treatment because of radiologic disease progression (n = 82), clinical deterioration without radiologic evidence (n = 3), adverse events (n = 5), withdrawal of consent (n = 4), loss to follow-up (n = 2), death (n = 4), and other causes (n = 17) (Fig. 1). Sixty-five out of 93 patients (69.9%) who had disease progression continued treatment with penpulimab and 53.9% went on to receive additional anticancer treatment.
Fig. 1
The study flowchart. PD progressive disease
Efficacy measuresIn the FAS per IRRC, 1 (0.8%, 95% CI = 0.0–4.4%) patient achieved complete response (CR) and 34 (27.2%, 95% CI = 19.6–35.9%) achieved partial response (PR) (Fig. 2a). The ORR was 28.0% (95% CI = 20.3–36.7%). The median time to response was 1.8 months (95% CI = 1.6–7.4 months), and the median duration of response was 14.8 months (95% CI = 8.9–25.3 months). At 9 months, 66.8% (95% CI = 48.1–80.0%) of the patients were in response (Fig. 2b). At the data cutoff, 10.4% patients were still in remission. Additionally, 27 patients had SD and 51 developed PD. The disease control rate (DCR) was 49.6% (95% CI = 40.5–58.7%).
Fig. 2
Treatment response and survival outcomes. a Waterfall plot of the best percentage changes for the sum of target lesion diameters for patients received at least one time of radiographic evaluation. *This patient had a >20% increase in the sum of diameter, but with absolute increase <5 mm, per the IRRC and, therefore, stable disease (SD) was documented instead of progressive disease (PD). ^The indicated lesion in this patient is lymph node. b Swimmer plots of time to tumor response (months) of individual patients with metastatic nasopharyngeal carcinoma as assessed by the independent radiological review committee (IRCC) according to the Response Evaluation Criteria in Solid Tumors (RECIST), version 1.1. Each swim lane represents one patient in the full-analysis set (FAS) per IRRC. Patient responses are color coded. CR complete response, NE not evaluable, PD progressive disease, PR partial response, SD stable disease. Kaplan–Meier-estimated progression-free survival (PFS) curves (c) and overall survival (OS) curves (d) of NPC patients in the FAS per IRRC
Eighty-six PFS events occurred, and the median PFS was 3.6 months (95% CI = 1.9–7.3 months) (Fig. 2c). The 6-month and 12-month PFS rate was 42.1% (95% CI = 32.9–51.0%), and 24.7% (95% CI = 17.0–33.1%), respectively. At the data cutoff, 48 (36.9%) deaths were reported in the FAS. The median OS was 22.8 months (95% CI = 17.1 months to not reached) (Fig. 2d). The 12 and 24-month OS rate was 66.1% (95% CI = 56.7–74.0%) and 48.6% (95% CI = 38.9–57.7%), respectively.
SafetyAll 130 patients were included in the safety analysis. TRAEs occurred in 71.5% of the patients. The three most frequent any grade TRAEs were hypothyroidism (30.0%), anemia (15.4%), and aspartate aminotransferase (AST) increased (14.6%). Fourteen (10.8%) patients experienced grade ≥ 3 TRAEs (Table 2). The rate of irAEs was 48.5% (63/130). The most frequent irAEs were hypothyroidism (20.8%), blood thyroid stimulating hormone increased (12.3%), rash (6.2%), and AST increased (6.2%). Ten (10/130, 7.6%) patients experienced grade 3 or higher irAEs, including grade 4 abnormal hepatic function in 1 patient. No grade 5 irAEs were reported (Supplementary Table 1). Four (3.1%) patients permanently discontinued penpulimab due to TRAEs/irAEs, including increased transaminase levels, disseminated herpes zoster, pemphigoid, and pleural effusion.
Table 2 Treatment-related adverse events, all grades (occurring in ≥5% of patients) and grade 3–5Subgroup analysisIn the subgroup analysis of 60 patients with liver metastases at the baseline, the ORR and DCR were 30.0% (95% CI = 18.8–43.2%) and 40.0% (95% CI = 27.6–53.5%), respectively. The median PFS and OS 1.9 months (95% CI = 1.8–6.6 months) and 18.6 months (95% CI = 9.4–not estimable), respectively. Objective response was observed across all subgroups stratified by demographic and clinical characteristics, except in patients aged ≥65 years (only two patients).
Among 122 patients assessed for PD-L1 expression, the ORR was 43.5% (95% CI = 28.9–58.9%) vs. 19.7% (95% CI = 11.5–30.5%) in the patients with a tumor proportion score (TPS) ≥ 50% (n = 46) vs. < 50% (n = 76) (Supplementary Table 2). Higher PD-L1 expression was also associated with longer median PFS (7.6 months, 95% CI = 3.6–12.0 months vs. 1.9 months, 95% CI = 1.8–5.6 months; HR = 0.61, 95% CI = 0.40–0.93) as well as OS (not reached, 95% CI = 22.4 months to not estimable vs. TPS < 50%: 18.6 months, 95% CI = 11.5–24.3 months; HR = 0.52, 95% CI = 0.30–0.92) (Fig. 3a, b).
Fig. 3
Survival outcomes stratified by key baseline characteristics. Kaplan–Meier-estimated progression-free survival (PFS) curves and overall survival (OS) curves of NPC patients stratified by PD-L1 expression (TPS ≥ 50% vs. <50%) (a, b) and (TPS ≥ 1% vs. < 1%) (c, d), EBV DNA levels (≥ 500 IU/mL vs. <500 IU/mL) (e, f), and baseline lactate dehydrogenase (LDH) levels (≥the upper limit, ULN vs. <ULN) (g, h)
In addition, 89.3% of the patients had a TPS ≥ 1% and they had a notably higher ORR than those with TPS < 1% (32.1%, 95% CI = 23.5–41.7% vs. 0%). They also had longer median PFS (3.8 months, 95% CI = 1.9–7.6 months vs. 1.8 months, 95% CI = 1.6–1.9 months; HR = 0.41, 95% CI = 0.22–0.74) and OS (24.2 months vs. 11.5 months; HR = 0.44, 95% CI = 0.22–0.90) (Fig. 3c and d).
Lower baseline EBV DNA levels predicted better efficacy.24 Patients with EBV DNA level < 500 IU/mL (n = 22) had higher ORR than those with EBV DNA level ≥ 500 IU/mL (45.5%, 95% CI = 24.4–67.8% vs. 24.3%, 95% CI = 16.4–33.7%). Lower baseline EBV DNA level was also associated with longer PFS (11.3 months, 95% CI = 1.8 months to not estimable vs. 2.3 months, 95% CI = 1.9–3.8 months; HR, 0.45, 95% CI = 0.25–0.81) and OS (not reached, 95% CI = 23.1 months to not estimable vs. 18.6 months, 95% CI = 11.5 to 25.7 months; HR = 0.32, 95% CI = 0.14–0.74) (Fig. 3e, f). Eighty-eight patients were evaluated for EBV DNA levels after two cycles of treatment and 46.6% experienced > 50% decline in EBV DNA levels. Nevertheless, they experienced no notable improvement in PFS and OS compared to those with ≤50% decline or an increase in EBV DNA levels (PFS: 9.1 months vs. 1.9 months; OS: not reached vs. 30.7 months).
Sixty-one (48.8%) patients had higher baseline lactate dehydrogenase (LDH) levels (≥the upper limit, ULN). Higher baseline LDH level was associated with poor response (ORR = 16.4%, 95% CI = 8.2–28.1% vs. 39.1%, 95% CI = 27.1–52.1%), shorter median PFS (1.8 months vs. 7.5 months; P < 0.001) and OS (9.9 months vs. not reached) (Fig. 3g, h).
Comments (0)