
Remember me


This study was a double-blinded, randomized, prospective trial that was conducted from January 2020 to June 2021. A total of 211 patients from a single tertiary care facility were assessed for eligibility. Patients aged ≥ 50 and ≤ 90 years, who were diagnosed with BPE-associated LUTS and did not receive medical treatment for BPE in the last 2 weeks, were eligible. The exclusion criteria included a previous history of acute urinary retention (AUR) or prostate surgery, patients with chronic urinary retention, or prostate malignancy, and other causes of LUTS (urinary bladder stones, neurogenic bladder, or urethral stricture). 94 patients were excluded according to the exclusion criteria and 24 patients refused to participate. 93 patients were enrolled and consented to the study and its purpose. The study was approved by our institute’s ethical committee.
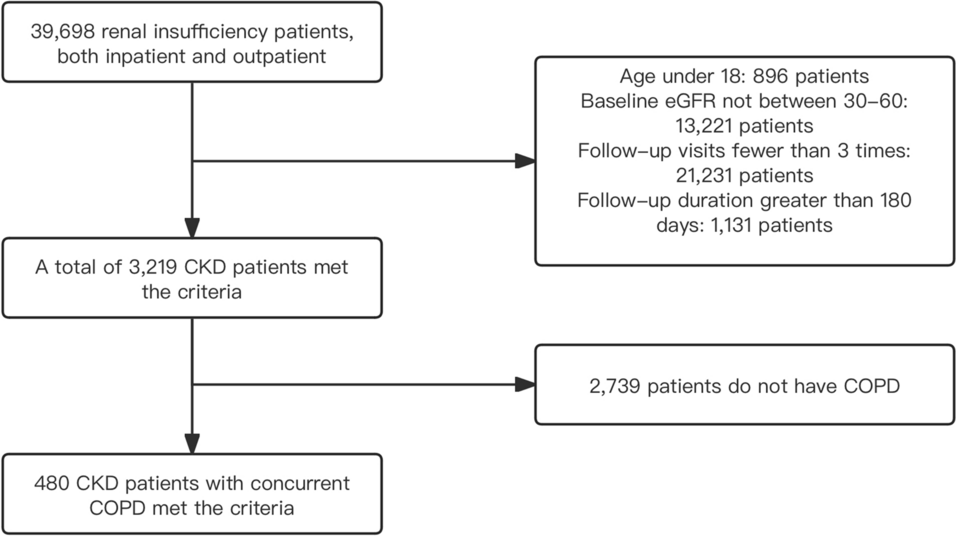
Before randomization, patients were evaluated by general history taking (smoking, lifestyle, past medical history, current medications, sexual life, and assessment of ejaculation activity), and physical examination (measurement of body mass index (BMI), systolic blood pressure (SBP), and diastolic blood pressure (DBP)). IPSS questionnaires were administered, and PVR urine volume and Qmax were evaluated by an abdominopelvic ultrasound and uroflowmetry respectively. Participants were randomized into two groups in a manner of 1:1 ratio (Group A received Tamsulosin 0.4 mg and Group B received Tamsulosin 0.8 mg). All study subjects entered the double-blinded phase by giving the investigator coded pill boxes to deliver to the participants. Each box contained 28 compartments for the 28 days of the study. We chose to perform a preliminary study for a short period of time (4 weeks) for two reasons. The first was justified by the fact that most side effects of alpha blockers tend to express themselves in the initial doses. Secondly, we had concerns that subjects may not exhibit compliance with the drug under trial if the study duration was prolonged, especially Egyptian patients have a reputation of being non-compliant. So, to avoid a big segment of the patients aborting the trial, we chose to start with 4 weeks. In the event that the bigger dose proved its potency and safety, a second study would be designed on a longer scale. Each compartment had either 2 tablets of Tamsulosin 0.4 mg (for group B) or a tablet of Tamsulosin 0.4 mg and a placebo one with inactive ingredients (for group A). Both tablets were taken together as one dose. After 4 weeks of treatment, patients were re-evaluated by IPSS questionnaire, measurement of Qmax, PVR urine volume, SBP, and DBP, and asking about headache, dizziness, and ejaculation abnormality. There were 3 patients who dropped out of the study, 2 of them were due to adverse events (dizziness), and one failed to continue the study. Figure 1 demonstrates our consort flowchart.
Fig. 1
Flow diagram of the number of patients enrolled, randomized, and completing the study per treatment group
Study assessmentEfficacy was determined by assessment of the primary endpoints, which were the changes in IPSS, PVR urine volume, and Qmax before and after the treatment. Regarding secondary endpoints, safety was assessed by summarizing the incidence of adverse effects and measurement of SBP and DBP.
Statistical analysisBased on the postulated improvement of 50% of cases in Tamsulosin 0.4 mg compared to that of 80% of cases in Tamsulosin 0.8 mg, the alpha error is 5% and the power of the study is 80%. Therefore, the required sample size is 90 patients, 45 in each group. The program for sample size calculation is STATA 10.
The collected data were coded, tabulated, and statistically analyzed using IBM SPSS statistics (Statistical Package for Social Sciences) software version 22.0, IBM Corp., Chicago, USA, 2013. Quantitative normally distributed data was described as mean ± SD (standard deviation) after testing for normality using the Shapiro–Wilk test, then compared using independent t test (two independent groups) and paired t test (paired data). Qualitative data were described as numbers and percentages and compared using the Chi-square test. A P value < 0.050 was significant, otherwise was non-significant.
Comments (0)