
記住我
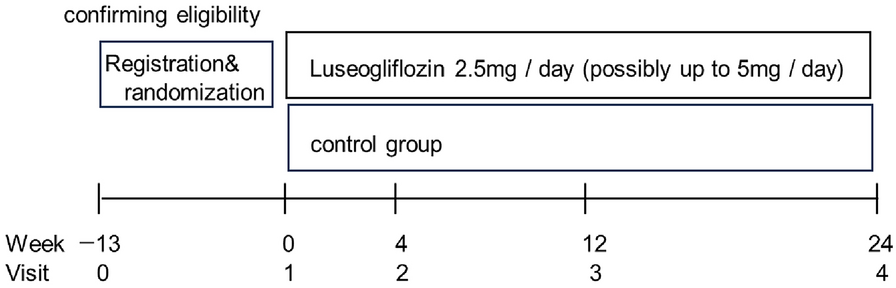


We conducted a single-arm exploratory study at Kunisaki Makoto Clinic in Fukuoka, Japan. We recruited people with T2DM who had not achieved their glycemic targets, defined as HbA1c levels of 7.0% to < 8.5% at screening (SCR) that did not improve or improved by ≤ 0.2% during the 12 weeks before SCR despite conventional guidance on lifestyle changes, including diet and exercise therapies, and treatment with anti-diabetic drugs for at least 12 weeks. A full list of the eligibility criteria is provided in Supplementary Table S1.
All procedures were conducted in accordance with the Declaration of Helsinki and the local regulations. All participants gave written informed consent. Site monitoring was conducted by EPS Corporation (Tokyo, Japan). Since the study site did not have its own ethical review body, this study was reviewed and approved by the certified ethical review committee established by Saga Memorial Hospital (ID. 16000061). The study was registered in the Japan Registry of Clinical Trials (jRCT ID: 1070220007).
ProceduresAll participants used the TOMOCO™ app and the Fitbit device in addition to conventional diet/exercise therapy and anti-diabetic drug for the 12 weeks of observation period. The conventional therapy, including anti-diabetic drugs, remained unchanged throughout the observation period. Participants visited the study site every 4 weeks to undergo blood tests including HbA1c, body weight measurements, and received feedback/advice from health care providers (HCPs) based on the TOMOCO™ and Fitbit records (Supplementary Fig. S1).
Additionally, a questionnaire survey was conducted at baseline and at 12 weeks. At baseline, the participants were asked about their awareness of the importance of diet and exercise therapy in diabetes treatment and how they were implementing it. At 12 weeks, they were asked about how helpful TOMOCO™ and Fitbit were for diet and exercise therapy. A full list of the questionnaire and answer options are provided in Supplementary Table S2.
The primary endpoint was the mean change in the HbA1c levels from baseline to 12 weeks, and the secondary endpoints were the mean change in body weight from baseline to 12 weeks and the response to the questionnaire.
Lifestyle Improvement Support AppThe TOMOCO™ lifestyle improvement support app is specifically designed to support lifestyle changes in people who are at high risk of lifestyle-related diseases, e.g., diabetes, hypertension, dyslipidemia and cardiovascular diseases, identified by abnormalities in their metabolic parameters including waist circumference, body mass index, blood glucose levels, lipid concentrations, blood pressure, and smoking habits. The system consists of a smartphone app (TOMOCO™ app) and a web-based interface (TOMOCO™ web system). The TOMOCO™ app features interactive virtual characters called “concierges” who accompany the study participants toward their goals for lifestyle improvement. The participants input their daily records, such as diet, exercise, and medications, and the concierge then sends encouraging messages according to the programmed algorithm and gives rewards such as items that can be used in the app based on the participant’s achievements on a daily basis. In addition, the points awarded according to the achievements compared with other TOMOCO™ users are displayed on each participant’s app in a ranking format (Supplementary Figs. S2 and S3). The TOMOCO™ web system was synchronized with the TOMOCO™ app and monitored by the HCPs in the present study. It was used in the participants’ consultations during their study visits (Fig. 1).
Fig. 1
Combined use of a lifestyle improvement support app (TOMOCO™) and a wearable device (Fitbit). HCP health care provider, TTM transtheoretical model
The TOMOCO™ app also assessed the participant’s stages of behavioral changes at baseline using a transtheoretical model (TTM), which is scored in five stages: 1, precontemplation; 2, contemplation; 3, preparation; 4, action; and 5, maintenance. People in stages 1, 2, or 3 were considered to be unaware of the need to improve their lives or to have an understanding of the need but have not yet taken action [17, 18].
Wearable DeviceThe Fitbit Charge 5 activity tracker was used in this study. This device tracked physical activities, such as step count, heart rate, sleep hours, and sleep quality, throughout the entire study period. The participants were instructed to wear the Fitbit constantly, except when charging the battery. The Fitbit-tracked step count data, which accurately reflect physical activity, were transferred to the TOMOCO™ in this study (Fig. 1).
Data CollectionThe TOMOCO™ data were extracted by Habitus Care Inc., and the Fitbit data were collected via Selfbase™ (Tech Doctor Inc., Tokyo, Japan). Other data were collected using an electronic data capture system (Marvin version 2.6.16; XClinical GmbH, Munich, Germany). All data were sent to the data center (INTAGE Healthcare Inc., Tokyo, Japan) for analysis.
Sample Size CalculationThe sample size was calculated for the change in the HbA1c levels from baseline. Based on previous studies [19, 20], we estimated a mean ± standard deviation (SD) change in the HbA1c levels from baseline to 12 weeks of 0.3 ± 0.7%. For a two-sided significance level of 5%, a sample size of 45 would provide a power of 80% for the analysis (paired t test). Therefore, we set a target of 60 enrolled participants to account for potential dropouts or failure to obtain values for evaluation.
Statistical AnalysisWe analyzed the results in the full analysis set (FAS), which was defined as the group of participants who started using the TOMOCO™ app in combination with Fitbit after enrollment and who had HbA1c data at baseline and 12 weeks.
The percentage of days during which the TOMOCO™ app was active (days of activation at least once a day / days of observation × 100) and the Fitbit-wearing time per day (hours) are expressed as median, range, and interquartile range to show usage levels. Unless otherwise noted, values are expressed as mean ± SD or median and range. The percentage of responses to the questionnaire was calculated. Pre- and post-intervention data were compared using paired t tests. Subgroup analyses were carried out with stratification by preselected participant characteristics acquired at SCR and the TTM score at baseline, and the results were compared in an inter-category manner using Student’s t test or analysis of variance. A significance level of 5% was used for all tests. No adjustment for multiplicity was performed because this was an exploratory study. Statistical analysis was conducted using SAS Release 9.4 TS Level 1 M5, 64bit (SAS Institute Inc., Cary, NC, USA).
留言 (0)