Subjects
The study sample was drawn from an earlier cross-section survey of 435 children in a single primary school selected using a cluster sampling. This observational study was conducted on children aged 4 to 7 years old in Xiangtan, Hunan province, located in South Central China. Details of children are described in elsewhere [15]. In this study, 21 were excluded due to incomplete dietary assessment or not collect the blood sample.
Fatty acids analysis
Venous whole blood samples were collected and centrifuged at 3,000 × g for 10 min to separate the erythrocytes and plasma. These samples were stored at − 80 ℃ after separation. For the analysis of erythrocyte FAs profiles, 50 µl erythrocyte after thawing and 200 µl internal standard working solution (IS) was firstly added in 10 ml glass vial. Then, 1 mL 3 N methanolic hydrochloric acid was added for transmethylation at 90 ℃ for 1.5 h in hermetic condition. After cooling the vials to room temperature, 2 mL hexane was added, and the vial was vortexed for 10 s. The upper (hexane) layer was transferred and evaporated to dryness under N2. Finally, the residue was dissolved in 1 mL hexane before the analysis. The samples (1 µL) were analyzed using a gas chromatography mass spectrometer (GCMS-QP2010, Shimadzu Corp., Kyoto, Japan) and separated using an HP-88 column (dimensions: 100 m × 0.25 mm × 0.20 μm; Agilent Technologies, Santa Clara, CA, USA). The SupelcoTM 37 Component FA methyl esters Mix (Sigma-Aldrich, St. Louis, MO, USA) was used to identify key FAs via chromatograms. Quantification was based on calibration with methyl nonadecanoate (Aladdin, Shanghai, China) as the IS. The detailed analysis procedure was reported in our previous study [16]. The results of erythrocyte FAs profiles were expressed in µg/mL.
Overweight and obesity assessment
Weight (kg) and height (cm) were measured with an electronic height and weight measurement instrument. Body Mass Index (BMI) was calculated by weight (kg) dividing square of height (m). The evaluation criteria of overweight and obesity for children based on WHO Child Growth Standards (2006). Z score of BMI-for-age were calculated. Overweight was BMI for 1≦ 2 and Obesity was>2 [17]. Besides, children with overweight or obesity were included in group of overweight or obesity.
Dietary pattern assessment
Food frequency questionnaire was used to collect the dietary intake information. The estimated portion size and frequency over the previous 12 months of each food item for each child’s diet intake was recorded by asking for their caregivers. The frequency was recorded in terms of times per day, week, month, or year; portion sizes were expressed in grams or milliliters. The mean daily intake of each food item was calculated using the estimated portion size and frequency. Total of 55 food items were recorded and further categorized into 19 food groups based on similarities in nutrient profiles or processing methods. The 19 food groups were rice, wheat floor, coarse cereals, tubers, soybean and its products, meat, poultry, egg, fish, shrimp, crab and shellfish, milk and its products, leafy vegetable, leaf-off vegetable, fresh beans, fungi and algae, fruits, beverage, nuts, and snacks. The details had been reported in our previou study [15].
FAs related dietary patterns were constructed using RRR analysis with the intakes of 19 food groups as independent variables and erythrocyte SFAs, MUFAs, n-3 PUFAs and n-6 PUFAs concentration as response variables, respctively. The RRR methods are conducted in the special procedure PLS of the SAS System for Windows, release 9.4 (SAS Institute, Inc.). The number of dietary patterns is equal to the number of selected responses for RRR. Factor loadings for independent variables represented the correlation coefficients between food items and dietary patterns. Factor loadings for response variables represented the correlation coefficients between erythrocyte FAs and dietary patterns. The variables with factor loadings >|0.2| were considered to contribute significantly to the dietary pattern. The factor score as the sum of the products of the factor loading coefficients and standardized intake of each food group associated with the pattern were calculated, which can be used in subsequent statistical analysis. A higher factor score represented children more preferred to this dietary pattern [18].
Other related variables
Sociodemographic information was collected during the FFQ interview, and comprised children’s age, sex, caregiver’s group (parents or grandparents/others), occupation (unemployed, non-public institution, or public institution), education level (junior and below, senior, or college and above), and annual family economic income. The age was divided into two groups (4 to 5 years or 6 to 7 years). The annual family income was subdivided into below 20,000 yuan, 20,000 to 50,000 yuan, and 50,000 yuan group and above.
Ethics approval
All participants provided written informed consent. The study protocol was approved by the Ethics Committee of the Hunan Provincial Center for Disease Control and Prevention (HNCDC-BJ20190003).
Statistical analysis
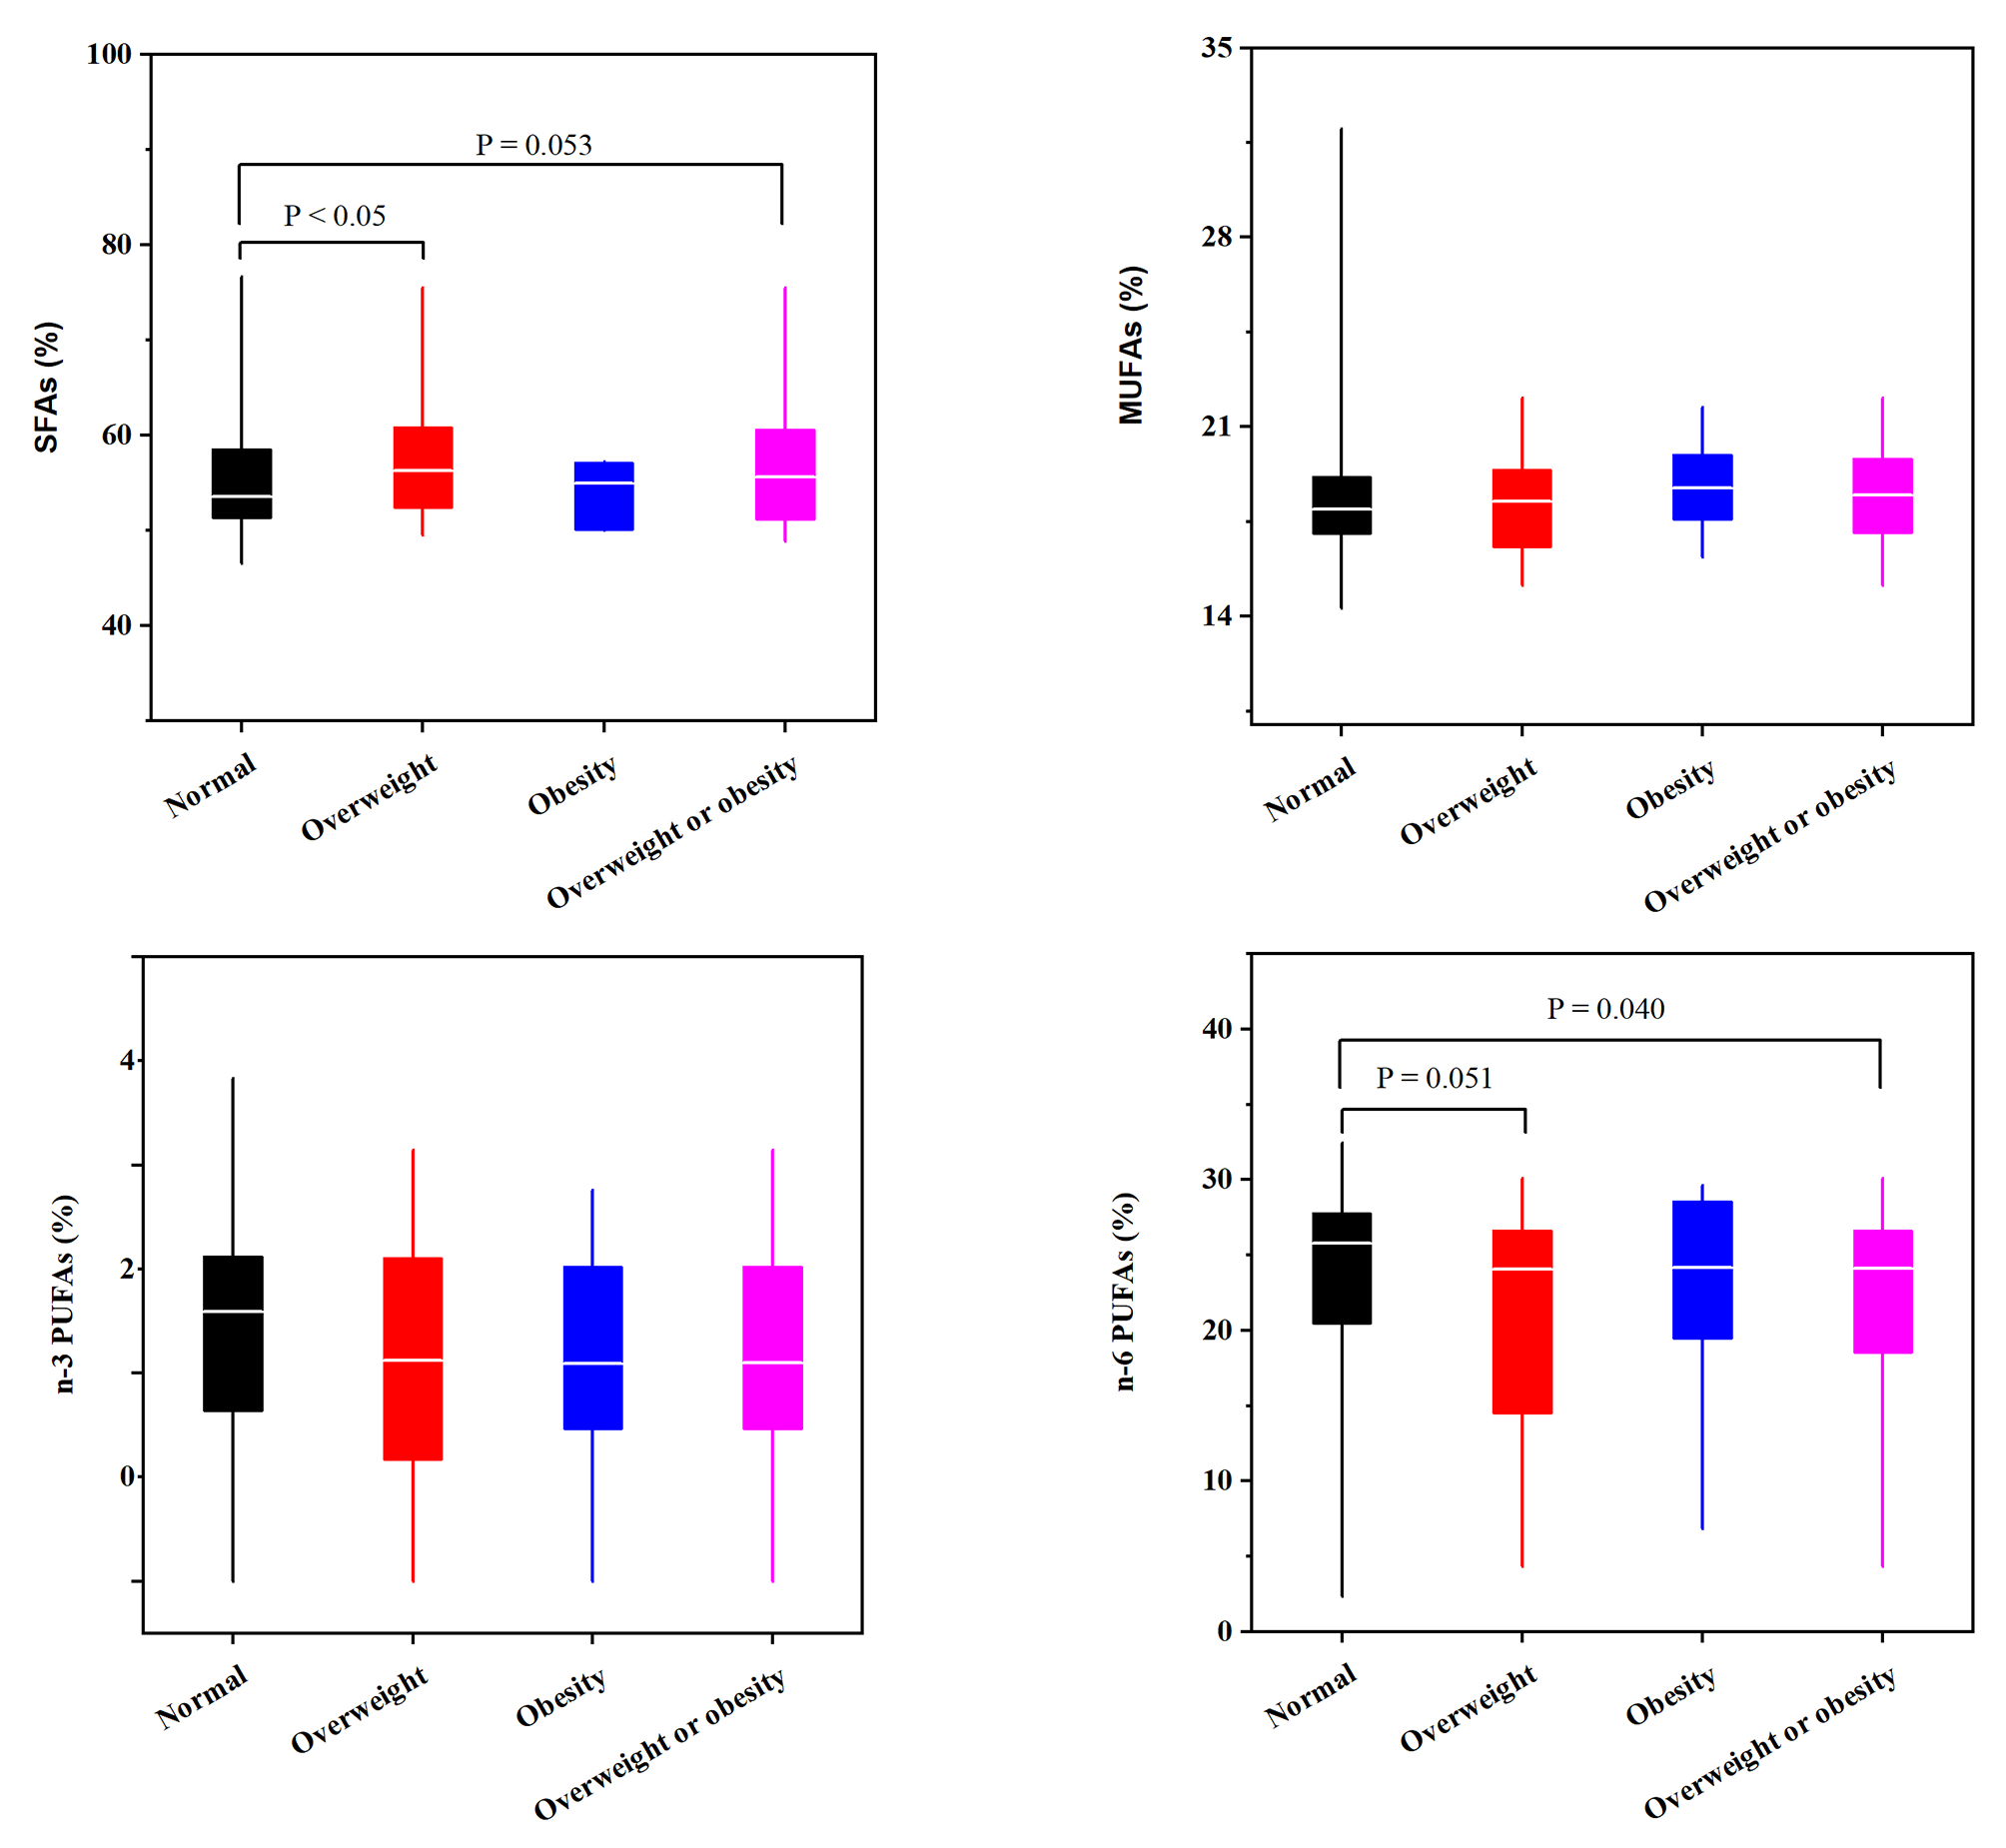
Categorical variables were expressed as numbers and percentages. Continuous variables were expressed as median (M) and interquartile range (IQR) due to skewed data. The differences of overweight and obesity with normal children on demographic characteristics were determined by Chi-square test. Mann-Whitney Test was run to determine the differences of FAs profiles between normal and overweight and obesity children. The associations of FAs related dietary patterns with overweight and obesity among children were explored by logistic regression analysis. The factor score of FAs related dietary patterns as independent variables, and overweight, obesity, and overweight or obesity as dependent variables, were conducted, respectively. Model 1was unadjusted; model 2 was adjusted for age, sex, caregiver’s groups, caregiver’s occupation, education, family economic level. The odds ratio (OR) and 95% confidence interval (CI) were calculated to determine the strength of associations. P < 0.05 was considered to indicate statistical significance. Statistical analyses were performed using SPSS software (version 13.0; SPSS, Inc., Chicago, IL, USA).


留言 (0)