
記住我
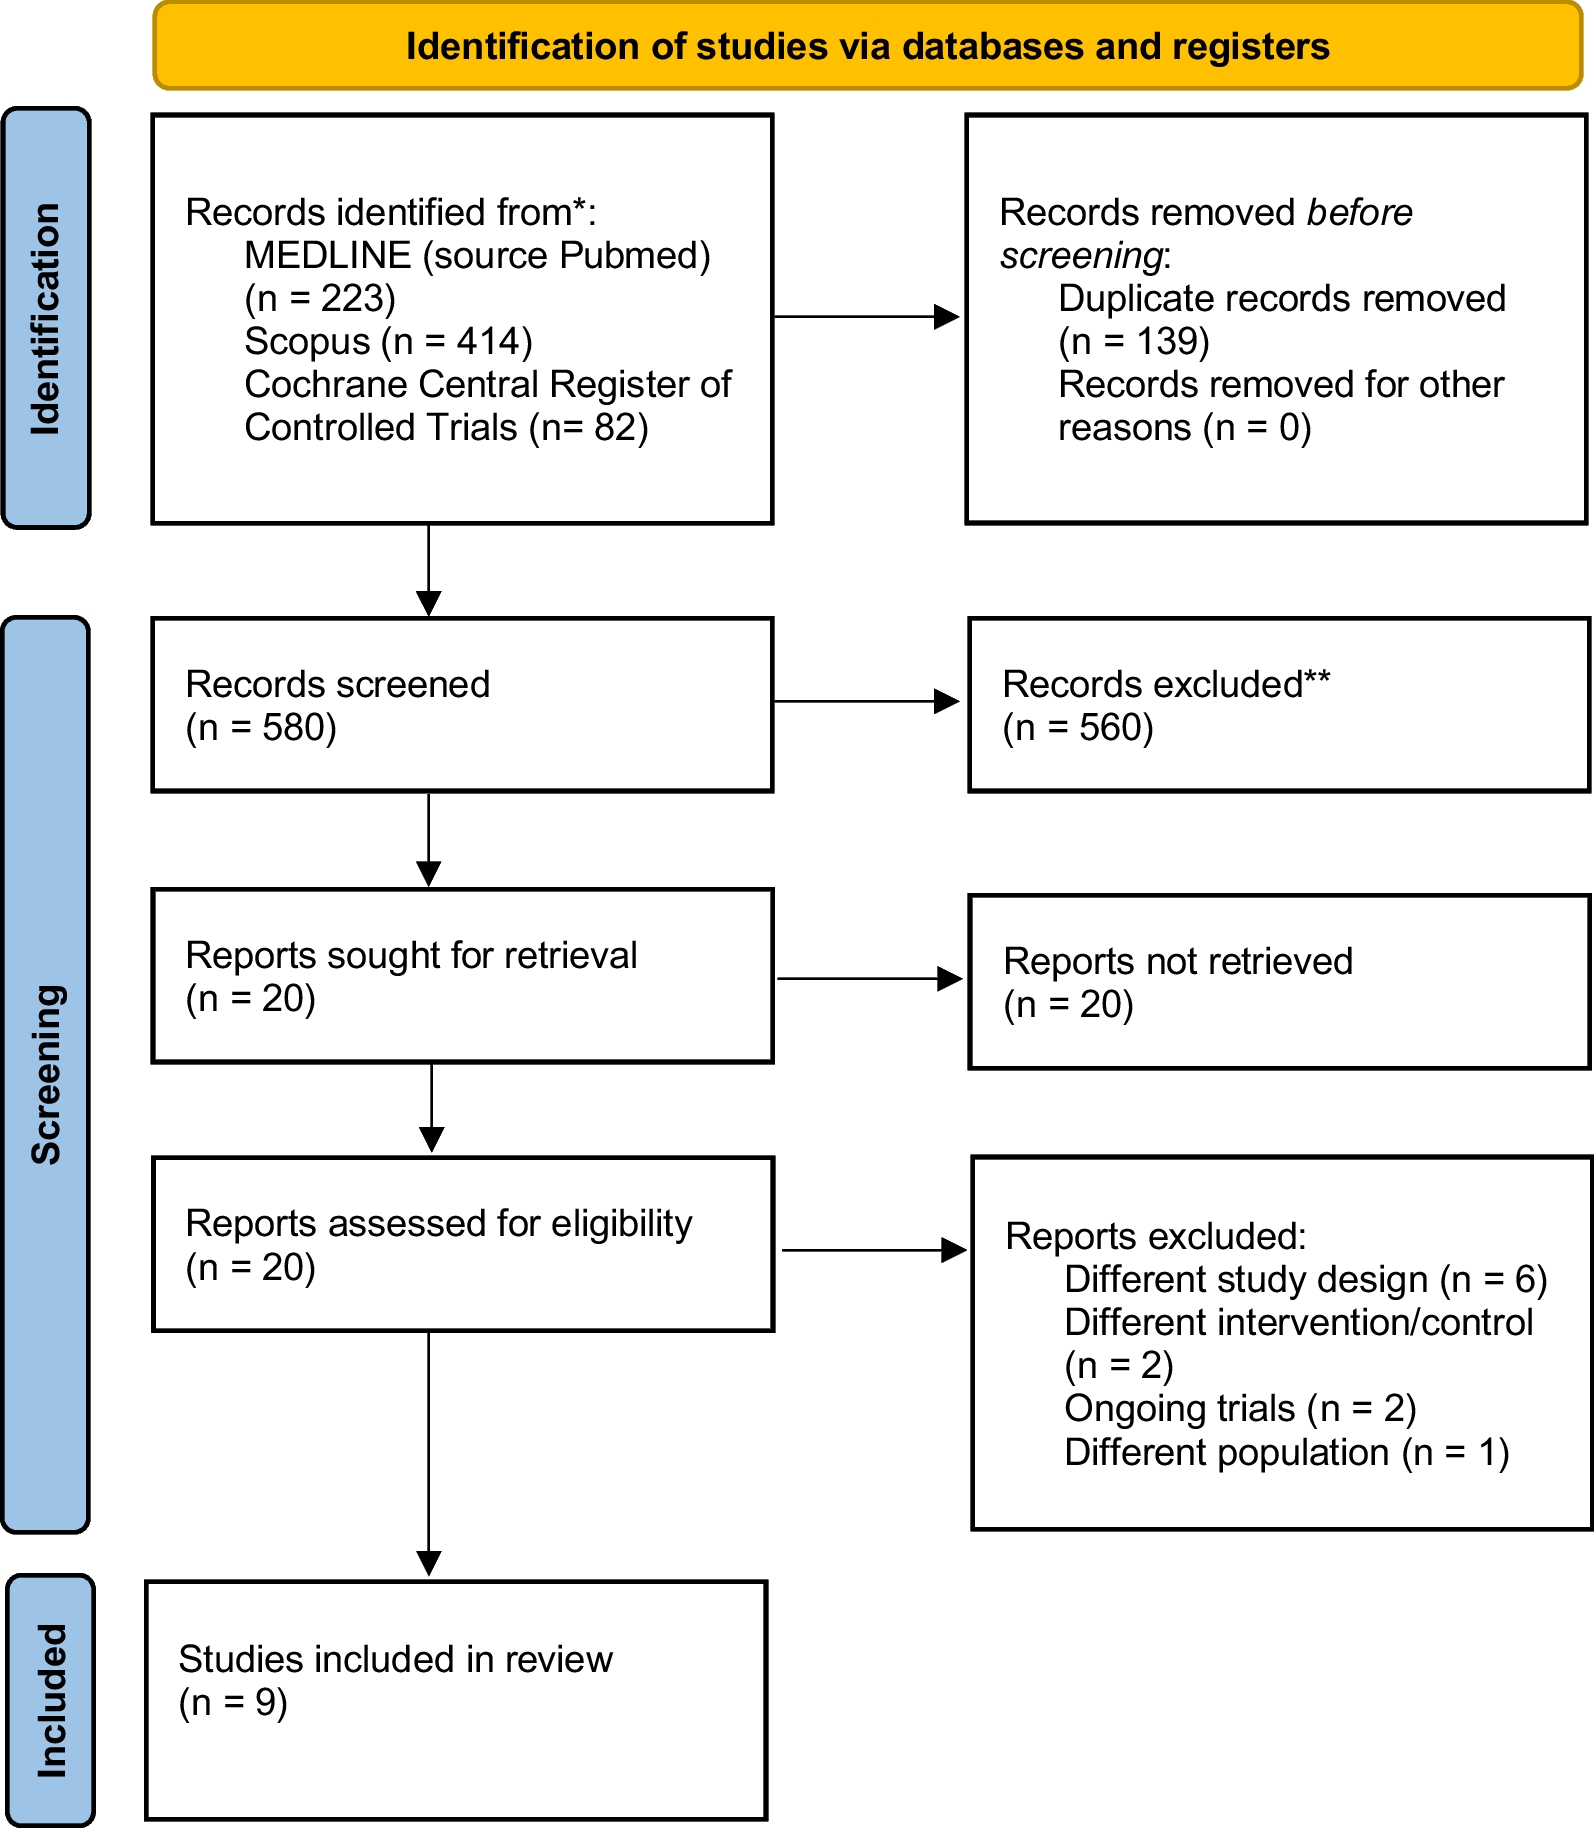
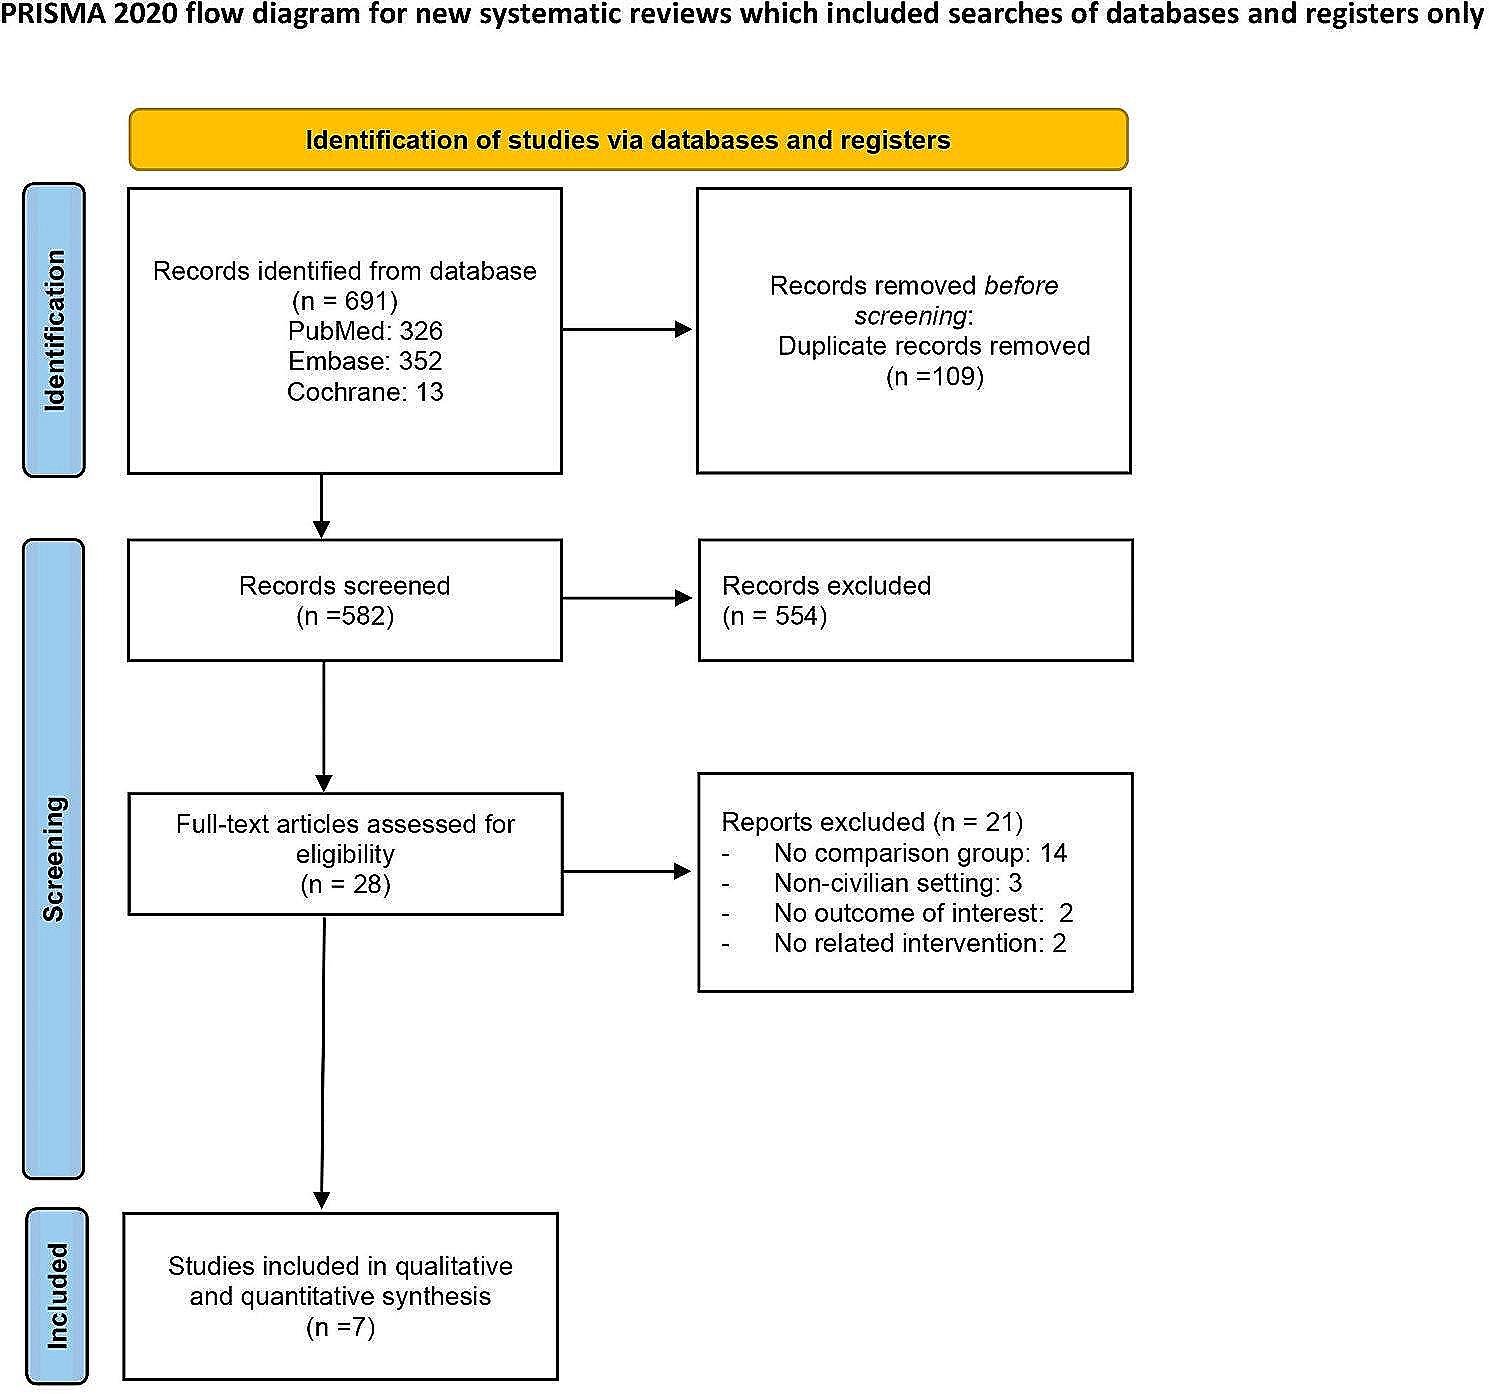


In total, 719 articles were retrieved, including 223 from PubMed, 414 from Scopus, and 82 from Cochrane Central Register of Controlled Trials by the search strategy, as shown in Fig. 1. Excluding duplicates, 580 articles underwent primary screening and 20 underwent secondary screening. Ultimately, 9 articles were included in the final analysis [10, 11, 20,21,22,23,24,25,26]. Of the total of 862 patients included in the articles under review, 423 were treated with operative treatment, and 439 were treated with conservation treatment. Seven RCTs [10, 20,21,22,23,24, 26] involved patients with flail segment and clinical flail chest, one study [11] involved patients with flail segment but no clinical flail chest, one study [25] involved patients with simple rib fractures without clinical or radiological flail chest, and one study included only men [23]. The characteristics of the included studies are summarised in Table 1.
Fig. 1
PRISMA flow chart of study screening and selection. The search strategy in MEDLINE, Scopus, and Cochrane Central Registry of Controlled study yielded 580 studies. We reviewed 20 studies for inclusion and exclusion criteria and finally included 9 studies in the meta-analysis
Table 1 Characteristics of the included studiesAssessment of biasThe identified studies exhibited heterogeneity in their inclusion criteria, surgical techniques, time to surgery, definition of flail chest, assessed outcomes, and length of follow-up. Therefore, we used random effect models for the analysis. The risk of individual within-study bias is represented in the Rob 2 traffic-light diagram shown in Additional file 1: Fig. S1. All of the Rob 2 assessment domains excluding the measurement of outcome domain had at least one or some concerns. One RCT raised high risk in its deviation from the intended intervention domain. Two RCTs were assigned a low risk of bias.
OutcomesMortalityAll of the studies reported mortality. Complete data were extracted from all studies, with no statistical heterogeneity noted between groups (I2 = 11%, P = 0.35). There was no significant difference in the mortality rate between the groups (RR = 0.53; 95% CI 0.21 to 1.38; P = 0.19) (Fig. 2A).
Fig. 2
Forest plot of studies for operative vs non-operative management. Forest plots of studies examining A mortality, B the incidence of pneumonia, C the need for tracheostomy, D the duration of echanical ventilation, E the length of ICU stay, and F the length of hospital stay for operative vs non-operative management. M-H, Mantel–Haenszel; CI, confidence interval; and SD, standard deviation; IV, inverse variance
Incidence of pneumoniaComplete data were shown in 8 studies [10, 11, 20,21,22,23,24,25], with statistical heterogeneity noted between groups (I2 = 57%, P = 0.02). A combined 144 events occurred in the 738 patients. There was a significant difference favouring the operative group (RR = 0.57; 95% CI 0.35 to 0.92; P = 0.02) (Fig. 2B).
Need for tracheostomyComplete data were shown in 6 studies [10, 11, 20, 22,23,24], with statistical heterogeneity noted between groups (I2 = 63%, P = 0.02). A combined 105 events occurred in the 588 patients. There was no significant difference between the groups (RR = 0.70; 95% CI 0.38 to 1.30; P = 0.26) (Fig. 2C).
Duration of mechanical ventilationComplete data were shown in 7 studies [10, 11, 20,21,22,23,24], with statistical heterogeneity noted between groups (I2 = 94%, P < 0.001). There was a significant difference favouring the operative group (MD -4.62; 95% CI -7.64 to -1.60; P = 0.003) (Fig. 2D).
ICU length of stayComplete data were shown in 8 studies [10, 11, 20,21,22,23,24, 26], with statistical heterogeneity noted between groups (I2 = 96%, P < 0.01). There was a significant difference favouring the operative group (MD -3.05; 95% CI -5.87 to -0.22; P = 0.03) (Fig. 2E).
Hospital length of stayComplete data were shown in 7 studies [10, 11, 21,22,23,24, 26], with statistical heterogeneity noted between groups (I2 = 97%, P < 0.001). There was no significant difference between the groups (MD -3.79; 95% CI -9.33 to 1.75; P = 0.18) (Fig. 2F).
Trial sequential analysisWe performed TSA for mortality after adjusting for the information size considering the presence of heterogeneity and used data from all 9 RCTs involving 762 patients. The calculated information size, adjusted for required diversity, and targeting a 5% risk of type I error, 20% risk of type II error, and low risk of bias trials investigating the expected effect (relative risk reduction [RRR] of 30%), amounted to 2290 patients. The cumulative Z curve only intersected the futility boundaries but did not intersect the monitoring boundary, indicating an insufficient number of studies to show substantial evidence for a -30% RRR in mortality with operative treatment (Fig. 3A). Given an accumulated information size of 2290 patients and no monitoring boundary crossings up to this point, we currently possess only 33.3% of the necessary information size required to make a definitive judgment on accepting or rejecting a 30% RRR for all-cause mortality.
Fig. 3
Trial sequential analysis results. A Trial sequential analysis for mortality. B Trial sequential analysis for duration of mechanical ventilation
Additionally, we performed TSA for the secondary outcome of the duration of mechanical ventilation, utilizing data from 7 of the RCTs involving 520 patients. The cumulative Z curve intersected both the futility boundaries and the monitoring boundary before reaching the information size, indicating firm evidence of the effect of operative treatment on the duration of mechanical ventilation compared to conservative treatment (Fig. 3B).
Quality of evidenceVery low or low confidence was assigned to this meta-analysis of the primary outcomes. This suggested that the actual effect might differ from the estimated effect due to severe risk of bias and issues of imprecision that could potentially introduce bias into the meta-analysis. The quality assessment is detailed in Table 2. No publication bias was apparent after inspection of the funnel plots of the primary outcomes.
Table 2 Assessment sheet of overall quality of evidence by Grading of Recommendation, Assessment, Development, and Evaluations (GRADE) guidelinesSensitivity analysisResults of the sensitivity analysis of outcomes using the low risk of bias studies, excluding Marasco et al. [26], are presented in Additional file 2: Fig. S2, and those of the outcomes using the studies of the flail segments of rib fractures, excluding Pieracci et al. [25], are presented in Additional file 3: Fig. S3. The results of these analyses were consistent with the main results.
留言 (0)