
記住我


All participants in this cohort study were from the National Free Prepregnancy Checkups Project (NFPCP), which was a national preconception healthcare service supported by the National Health Commission and the Ministry of Finance of the People’s Republic of China. This project encouraged married couples of reproductive age (20–49 years) to join the project based on their fertility willingness. It would offer free pre-pregnancy eugenics health care services to these couples, including health education, health examinations, risk assessments, and counseling guidance. Based on the assessments of the risk of genetics, reproduction, disease susceptibility, and exposure to environmental toxins, couples were categorized as either the general population or high-risk population, with the latter indicating abnormalities in one or more aspects. For couples planning for pregnancy without identified risk factors, it was recommended to receive regular health education and guidance. However, for couples with identified risk factors, it was advisable to receive further counseling, examination, treatment, and referral. When necessary, it was advised to postpone pregnancy. More detailed information on the design, organization, and implementation of the NFPCP has been described previously [10,11,12].
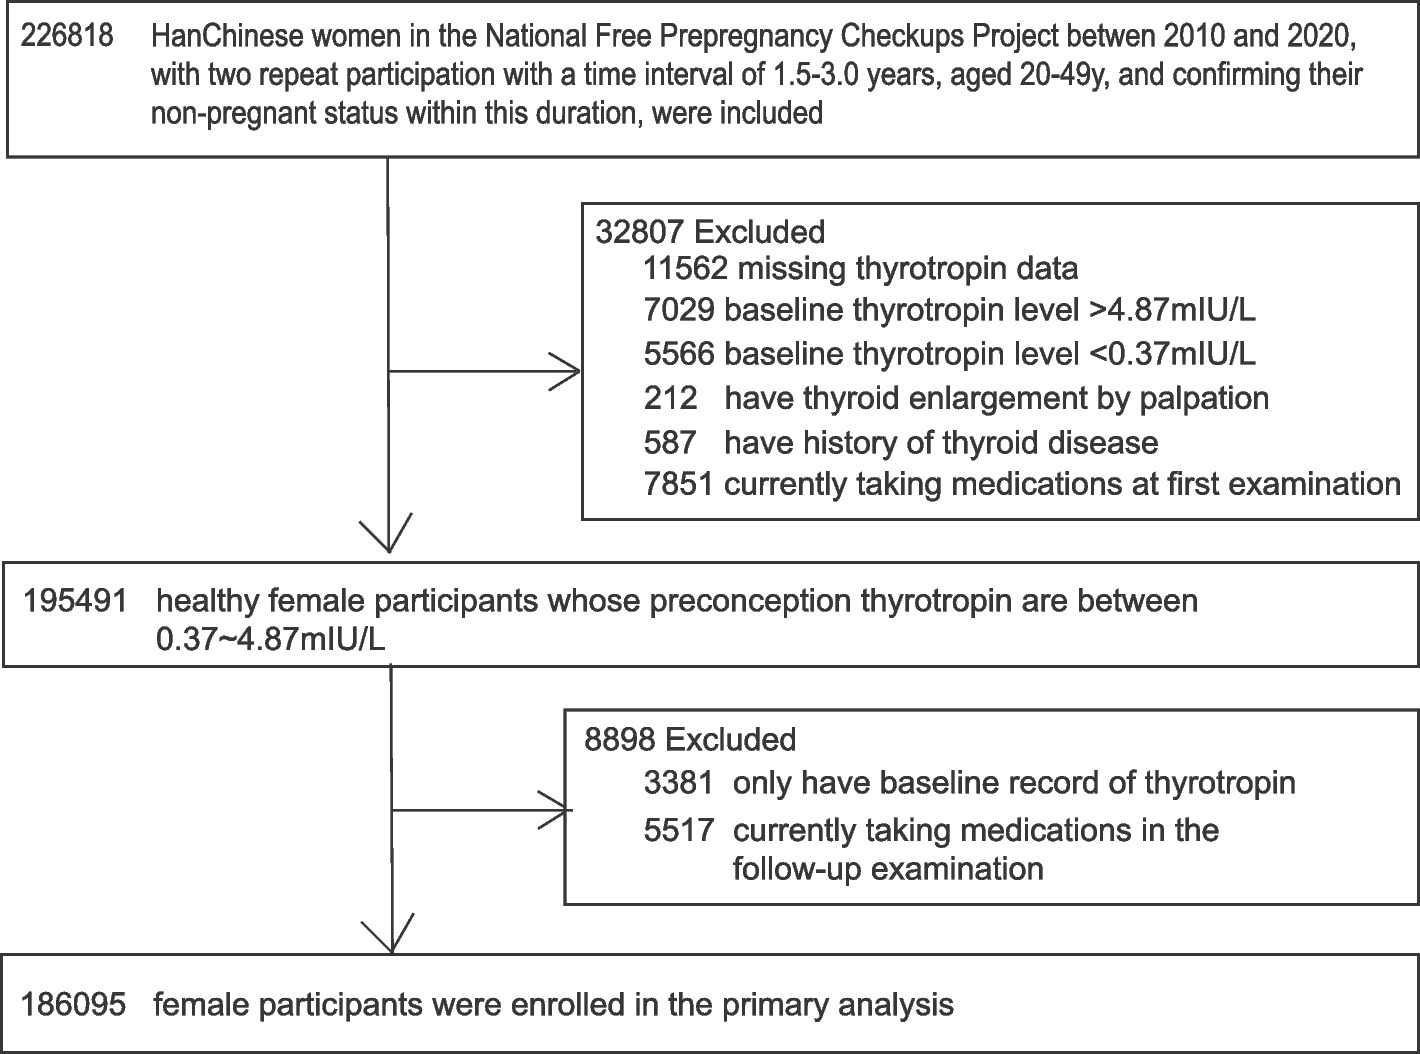
Because Han Chinese female participants account for more than 90% of the total population in the NFPCP and to avoid differences in preconception thyrotropin levels among female participants by ethnicity, only female Han Chinese participants who were aged 20–49 years and participated consecutively in the NFPCP from 2010 to 2020 were included in this large-scale retrospective cohort study. The baseline screening was established as the initial NFPCP participation within the period from January 1, 2010, to May 31, 2018, while the follow-up screening represented a subsequent participation occurring within a time interval of 1.5 to 3.0 years. Participants confirmed non-pregnancy during the follow-up period by consistently reporting the same gravidity in the two preconception examinations, alongside recording non-pregnancy during their initial NFPCP involvement.
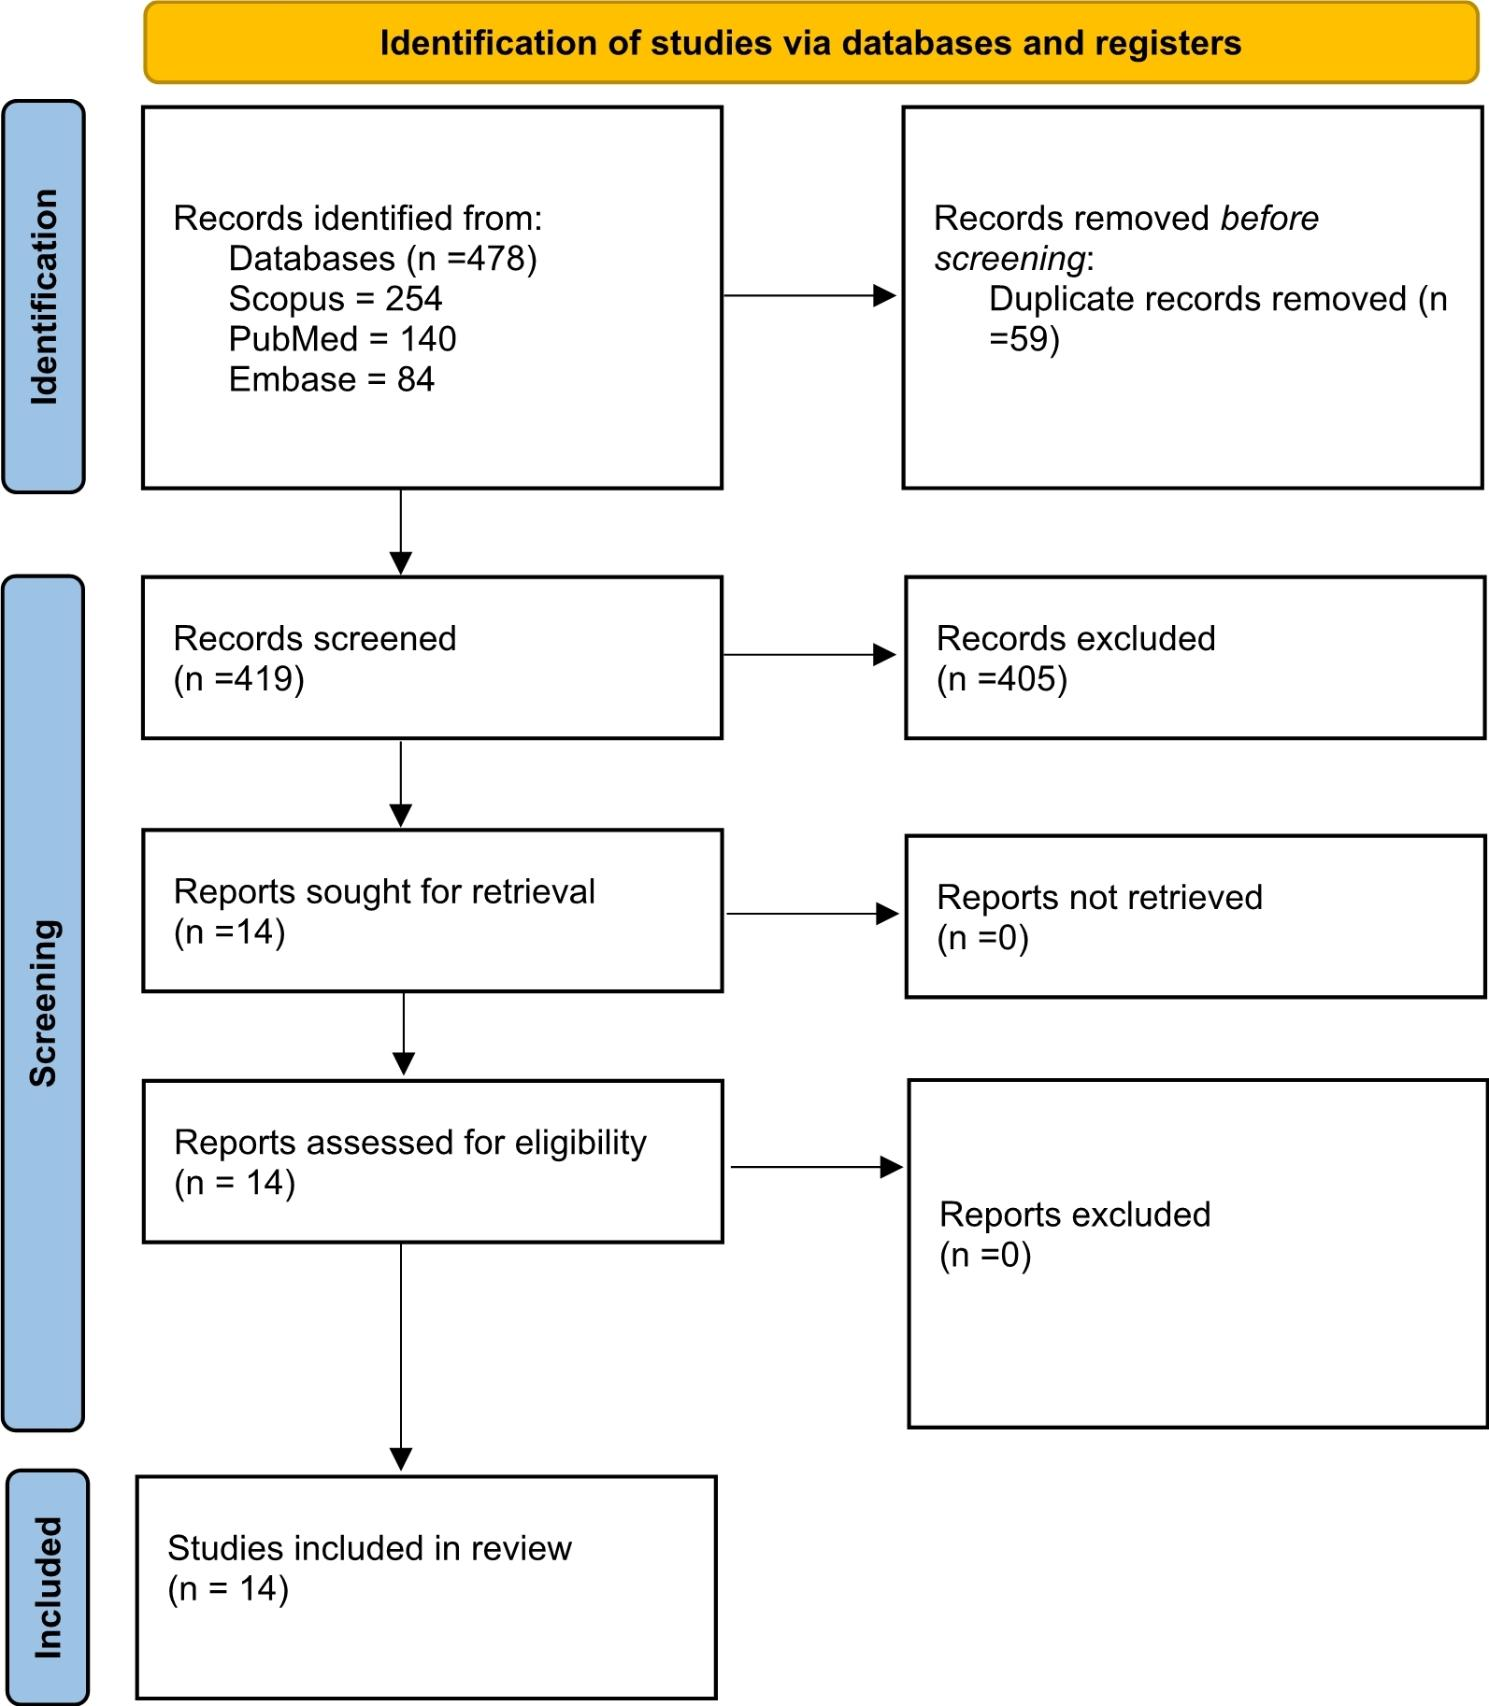
Since certain medications could influence thyrotropin levels, participants who self-reported of currently taking medication, including prescription, over-the-counter, or traditional Chinese medicine, to treat any diagnosed disease at the time of the two NFPCP screening were excluded. Moreover, participants with missing or abnormal baseline thyrotropin levels, palpable thyroid enlargement, and history of thyroid disease were excluded. Then, participants without a recorded follow-up thyrotropin were excluded. Finally, 186,095 euthyroid female participants were enrolled in the analysis (Fig. 1).
Fig. 1
Flowchart of the study cohort selection criteria
This study was approved by the Institutional Research Review Board at the National Research Institute for Family Planning in Beijing, China. Written informed consent was provided by every participant before enrollment. This study followed the Strengthening the Reporting of Observational Studies in Epidemiology (STROBE) reporting guidelines.
Data collection and outcomesBlood samples and information were collected by trained healthcare staff in local maternal and child service centers or family-planning service institutions. Information on the participants’ demographics, past medication, disease history, obstetric history, dietary nutrition, lifestyle, environmental toxins, psychosocial factors, laboratory tests, and physical examination were recorded in the preconception medical chart.
The outcome was abnormal thyrotropin levels in the follow-up thyrotropin examination, including subnormal thyrotropin and supranormal thyrotropin.
Serum thyrotropin measurementsPreconception blood samples were collected in the morning from participants after at least 8 h of fasting and immediately sent to local laboratories of maternal and child service centers. Measurement of serum thyrotropin levels were based on the National Guide to Clinical Laboratory Procedures. As all participants came from 2,526 counties of 31 provinces, it was impractical for all laboratories across the different counties to use a uniform thyrotropin detection kit or detection method. Thus, all laboratories within each county consistently used a single type of thyrotropin assay, either electrochemiluminescence immunoassay or enzyme-linked immunosorbent assay kits.
As reported in previous analyses using the same database, a population-specific thyrotropin reference range for preconception thyrotropin levels were established based on the 2.5th and 97.5th percentiles of thyrotropin level of 1,646,039 Han Chinese women who delivered a healthy infant and did not have any of the following conditions: 1) abnormal body mass index (BMI) at baseline; 2) exposure to cigarette smoke or alcohol; 3) history of adverse pregnancy outcome, anemia, diabetes, hypertension, or thyroid disorders; 4) current use of medications. Consistent with our previous study, preconception thyrotropin level of 0.37–4.87 mIU/L was defined as reference range, < 0.37mIU/L was defined as subnormal thyrotropin level, and ≥ 4.88 mIU/L was defined as supranormal thyrotropin level [5].
In addition, to avoid variability or systematic differences among various local laboratories or assays, preconception thyrotropin values were converted to multiples of the median (MOM) for analysis. The thyrotropin MOM value was calculated by dividing the participant’s thyrotropin value by the median thyrotropin value in the reference population of the county where they registered for preconception health examinations.
Assessment of covariatesCovariates obtained from the baseline preconception examination included age, BMI, parity, education level, alcohol consumption, active smoking, passive smoking status, diabetes, hypertension, and iodine nutrition status. Participants self-reported their birth date, educational attainment, drinking, active smoking and passive smoking status. Age was categorized into five groups (i.e., 20–24.9 years, 25–29.9 years, 30–34.9 years, 35–39.9 years and ≥ 40 years). Technicians measured height and weight to derive BMI. BMI was calculated as weight in kilograms divided by height in square meters (kg/m2), while body weight and height were measured with light indoor clothes without shoes and accessories. Underweight, normal weight, overweight and obesity were defined as BMI < 18.5 kg/m2, 18.5 kg/m2 ≤ BMI ≤ 23.9 kg/m2, 24.0 kg/m2 ≤ BMI ≤ 27.9 kg/m2, and BMI ≥ 28 kg/m2, respectively, according to the BMI standard classifications in China. Parity was divided into 2 categories: = 0 or ≥ 1. Higher education level was defined as high school or above. Alcohol consumption was defined as frequently drinking; active smoker was defined as participants currently with at least 1 cigarette a day; whereas passive smoker was defined as involuntary inhalation of smoke from cigarettes or other tobacco products smoked by other people. Diabetes was defined as fasting plasma glucose level of 7.0 mmol/L (126 mg/dL) or higher, or self-reported physician-diagnosed diabetes. Blood pressure was measured on the right arm of the participants using an automated blood pressure monitor after a 5-min rest. Hypertension was defined as systolic blood pressure ≥ 140 mmHg and/or diastolic blood pressure ≥ 90 mmHg or physician-diagnosed hypertension. Iodine nutrition status at the province level were classified into three levels: excessive iodine intake (Jiangsu, Sichuan, Qinghai, Anhui), more than adequate iodine intake (Hebei, Zhejiang, Shanghai, Gansu, Yunnan, Xinjiang, Xizang, Henan, Hunan, Hubei, Inner Mongolia) and adequate iodine intake (Guangdong, Shandong, Guangxi, Fujian, Tianjin, Hainan, Liaoning, Beijing, Guizhou, Shanxi, Ningxia, Jiangxi, Jilin, Shanxi, Heilongjiang).
Statistical analysisMean and standard deviation (SD) were adopted to express continuous variables with normal distribution, and median and interquartile range (IQR) were adopted to express nonnormally distributed variables. Categorical variables were summarized as numbers and percentages. The differences in the characteristics of participants with different thyrotropin levels were tested using Analysis of Variance or the Kruskal–Wallis test for continuous variables, as appropriate, and the chi-square test for categorical variables.
Multivariate-adjusted Cox proportional hazards models were used to estimate hazard ratios (HRs) and 95% confidence intervals (CIs) for the associations between normal thyrotropin levels at baseline and outcomes (including subnormal and supranormal thyrotropin level). Baseline thyrotropin levels were stratified into five groups: 0.37–1.00 mIU/L, 1.01–2.00 mIU/L (referent), 2.01–3.00 mIU/L, 3.01–4.00 mIU/L, 4.01–4.87 mIU/L. In these models, we adjusted for age, BMI, parity, education level, alcohol consumption, passive smoking status, diabetes, hypertension, and iodine nutrition status. Participants (less than 2.5%) with missing covariates data were removed from each model.
To determine an optimal thyrotropin reference range in euthyroid women of reproductive age indicating minimal risk of developing thyrotropin abnormality, the following approach was adopted. Restricted cubic splines (RCS) were constructed to display the fully adjusted relationship of normal thyrotropin level or thyrotropin MOM value with abnormal thyrotropin outcome. To determine the number of knots to use, 3 to 10 knots were assessed, and optimal knots that had the lowest Akaike information criterion were used. The nonlinearity of each dose–response association was tested by Wald statistics. The covariates in dose–response association analysis models were the same as those in the previous Cox proportional hazards regression model. The initial thyrotropin values that corresponded to the lowest statistically significant HR > 1.00 was determined as possible cutoffs for the optimal thyrotropin range. Statistical analysis was performed using R software version 4.0.3. All statistical tests were two-sided, and P < 0.05 was considered statistically significant. Data were analyzed between June 1 and October 1, 2023.
留言 (0)