
記住我
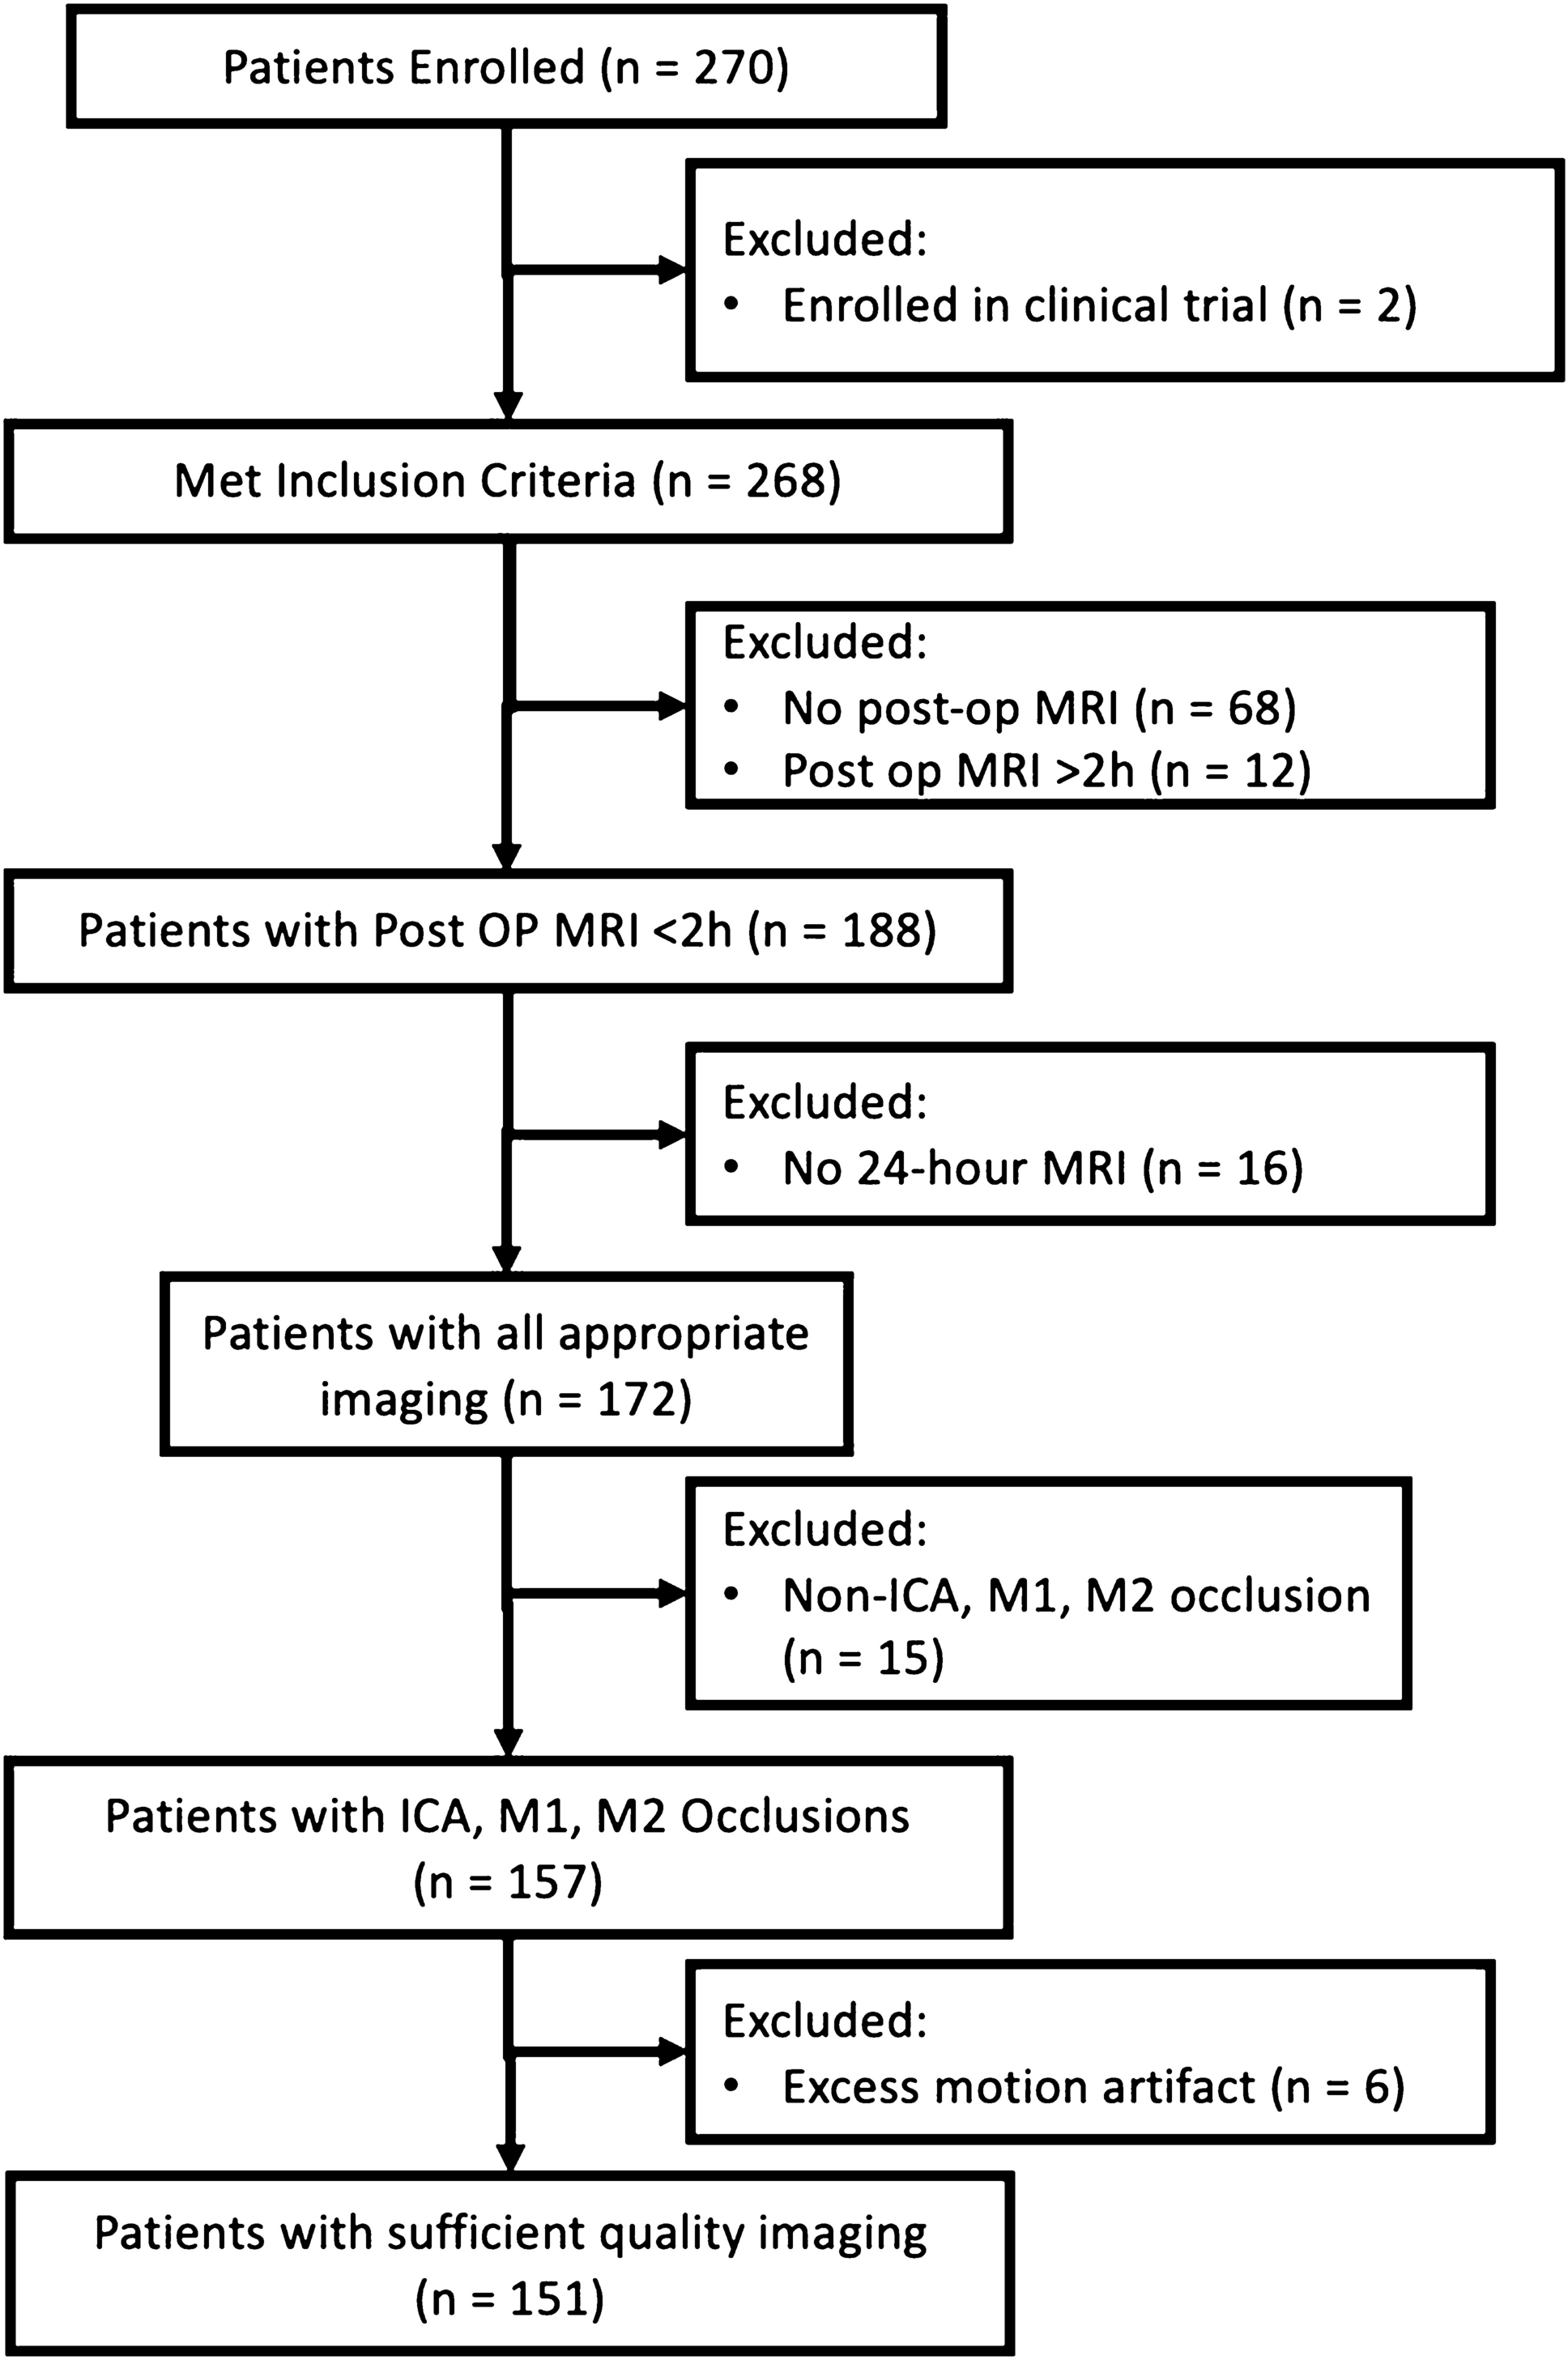
This single-center, retrospective study was approved by the institutional review board, and the informed consent was waived (IRB No. 2111–165-1276). We enrolled patients who performed non-contrast head CT scans between January 2009 and October 2021 in Seoul National University Hospital. We included patients who were 19 years or older, initially diagnosed with spontaneous acute intracerebral hemorrhage by non-contrast head CT, and subsequent follow-up images within 24 h to evaluate hematoma size change. The exclusion criteria were (1) patients with traumatic brain hemorrhage, (2) patients with secondary ICH (e.g., vascular malformation, hemorrhagic transformation of acute ischemic stroke, or moyamoya disease), (3) lack of follow-up images within 24 h or underwent surgical treatment before subsequent follow-up images, or (4) suboptimal CT image quality. Finally, 572 patients were enrolled for a hematoma expansion dataset. The detailed patient enrollment process was described in Fig. 1.
Fig. 1
Flowchart indicating the included and excluded patients
Head CT acquisition and image interpretationThe non-contrast head CT scans were performed with one of the CT scanners of various vendors, which varied over time within our institution: 320-slice multidetector CT scanner (Aquilion ONE, Canon Medical Systems), 256-slice scanner (iCT256, Philips Medical Systems), 64-slice scanner (Brilliance 64, Philips Medical Systems; SOMATOM Definition, Siemens Healthineers; Discovery 750 HD, GE Healthcare), or 16-slice scanner (Sensation 16, Siemens Healthineers). The image acquisition parameters were relatively constant as follows: peak tube voltage, 120 kV; tube current, 150 ~ 400 mAs with automatic exposure control; reconstruction matrix size, 512 × 512; reconstruction field of view, 24 cm × 24 cm and slice thickness, 3 mm or 5 mm. All CT images were reconstructed using a kernel appropriate for brain evaluation (Supplementary Table 1).
One radiologist with 12 years of experience in neuroradiology (I.H.) measured hematoma volume in initial and follow-up CT images using picture archiving and communication system workstation (INFINITT M6 and Xelis, INFINITT Healthcare, Seoul, Korea). If the patient underwent more than two follow-up imaging, the hematoma volume was measured based on the images that appeared largest upon visual inspection. On multi-planar reformatted images, the investigators measured largest diameter (D1) and two perpendicular diameters (D2 and D3) using electric caliper. The volume of the hematoma was determined using the ellipsoid approximation as follows: volume = 0.523 × D1 × D2 × D3. Hematoma expansion was defined as ≥ 6 mL absolute or ≥ 33% relative increase on follow-up [13]. The same investigator (I.H.) also semi-automatically determined hematoma region-of-interest mask on the initial CT scans for training the segmentation model, using threshold method in NordicICE software (version 4.1.2, NordicNeuroLab, Bergen, Norway).
Clinical variablesThe collected clinical variables included sex, age, Glasgow coma scale (GCS) group, systolic blood pressure (SBP), diastolic blood pressure (DBP), fibrinogen, international normalized ratio (INR), platelet count (platelet), antiplatelet use, time to initial CT scan, activated partial thromboplastin time (aPTT), initial hematoma volume, percent hematoma change, and absolute hematoma change. GCS scores were categorized based on their summation: severe brain injury (≤ 8), mild injury (9–12), and minor injury (≥ 13). Time to initial CT scan was defined as the duration between symptom manifestation and the CT scan.
Image preprocessingTo accommodate hematoma characteristics in non-contrast CT, all CT images were normalized within a range of 0 to 100 Hounsfield units. The images were resized to a standard dimension of 512 × 512. Data augmentation was conducted using the “ShiftScaleRotate” and “RandomScale” functionalities from the Python “albumentation” library [14].
DatasetWe prepared a large dataset for developing multitask deep learning model for (1) hematoma segmentation and (2) prediction of hematoma expansion. For the hematoma slice classification and segmentation model, details are provided in the supplemental materials. For the HE prediction model, the trained hematoma slice classification model was used to extract slices indicative of hematoma. From a total of 24,238 slices from 572 patients, 6044 slices were identified from 569 patients as having hematoma. The training set comprised 4834 slices from 458 patients, while the test set consisted of 1210 slices from 111 patients. We summarized the distribution and statistical analysis of HE and non-HE patients scanned with each type of CT scanner in the datasets in Supplementary Table 2. Stratification was applied based on the distribution of HE and non-HE cases. In the training set of 4834 images, 1152 slices came from 92 HE patients, and 3682 slices were from 366 non-HE patients. In the test set, from the total of 1219 images, 261 were from 22 HE patients and 949 from 89 non-HE patients. To compare the results of HE prediction including and excluding clinical variables, we considered unavailable clinical elements and excluded them. Consequently, the final data set for evaluation of models employed 107 patients: 21 HE patients and 86 non-HE patients (Supplementary Table 3).
Deep learning algorithmFor hematoma slice classification model, we designed a model to distinguish hematoma slices from a patient’s non-contrast head CT images (Fig. 2a). A pre-trained “SEResNeXt-50” architecture, enriched with attention mechanisms attention [15,16,17], was employed. SEResNeXt-50, an enhanced variant of ResNeXt-50 which itself is based on VGG and ResNets architectures, combines repetitive layering with a split-transform-merge strategy for deep feature learning in image classification, and integrates Squeeze-and-Excitation blocks to emphasize crucial features in convolutional layers, significantly improving image classification performance [15, 16]. The model was implemented using PyTorch, with a learning rate of 1e-4, a weight decay of 1e-6, and a batch size of 8. This fine-tuned model accepts 2D CT images of size 512 × 512 as input and determines the presence or absence of a hematoma.
Fig. 2
The workflow of hematoma expansion prediction model. This figure illustrates a multi-task deep learning approach for hematoma expansion prediction in non-contrast head CT images, encompassing slice classification, segmentation, and expansion prediction of hematoma. a The classification phase utilizes the SEResNeXt-50 model, enhanced with attention mechanisms to distinguish normal from hematoma-containing slices. b The segmentation phase using the U-Net model facilitates feature extraction associated with hematomas and utilizes the size of the segmented hematoma regions as a weighting factor in subsequent prediction models. c For prediction of HE, the convolutional neural network employs CT image and feature extracted from the segmentation model. The DL score through the model is calculated with weighting factor derived from the size of the hematoma region. The process for acquiring the normalized DL score is performed on a per-slice basis for each patient. Consequently, multivariate logistic regression is utilized, combining the normalized DL score with clinical variables obtained from the patient, to predict the HE. Note: CT = computed tomography, HE = hematoma expansion, DL = deep learning
For hematoma segmentation model development, we targeted the segmentation of hematoma regions within images containing hematoma (Fig. 2b). The prevalent U-Net architecture for segmentation was adopted [18]. This model operates with a learning rate of 0.001 and utilizes a combined loss function derived from the Dice coefficient and binary cross entropy.
For expansion prediction model, we aimed to predict hematoma expansion (HE) by training our model to process hematoma images as inputs and predict the HE as outputs (Fig. 2c). The model, termed the Image-to-HE model, relies exclusively on hematoma images for HE prediction. It accepts a single slice as input and extracts features post-encoder from the trained hematoma segmentation model. After feature extraction, a concatenation process in the convolutional neural network deduces the HE probability, referred to as the DL score. The model then uses the hematoma region size, produced by the trained hematoma segmentation model, as a weight. This weight is introduced to reflect the hematoma size across multiple CT images for a single patient, ensuring proportionality to the hematoma’s size. The Image-to-HE model predicts a patient-specific HE outcome using the normalized DL score (nDL score).
The Clinical-to-HE model forecasts HE using multivariate logistic regression on clinical variables, notably without incorporating image data.
The Integrated Image and Clinical-to-HE model (Integrated-to-HE) incorporates both image-derived and clinical variables. This comprehensive model uses the normalized DL score as a regressor within a multivariate logistic regression framework, aligning it with clinical variables to predict patient-specific HE.
Statistical analysisOnly clinically significant variables, as determined by a univariable logistic regression p value, were used as inputs for the models. For the selection of clinical variables, a logistic regression analysis with a forward selection method was employed. The variables found to be statistically significant were chosen for the model. These statistical analyses were conducted using statistical software (MedCalc, Mariakerke, Belgium). The performance of the classification and prediction models was evaluated using accuracy, sensitivity, specificity, and area under the curve (AUC) metrics. The segmentation model’s performance was assessed using the Dice coefficient metric. Model performances were compared using accuracy, sensitivity, specificity, and AUC scores on the test set. Also, model performances were assessed using AUC to measure the ability to distinguish between classes through the receiver operating characteristic (ROC) curve and calibration plots to compare predicted probabilities against actual outcomes. Models were compared using their log-likelihoods, with odds ratios and 95% confidence intervals calculated for each variable; the overall significance between models was determined through the likelihood ratio test (LRT), which follows a chi-squared distribution. The model fit and complexity of the Clinical-to-HE and Integrated-to-HE models were assessed using Akaike’s information criterion (AIC) with lower values indicating a better fit.
Qualitative analysisFor analysis of our deep learning model, we applied the gradient-weighted class activation mapping (Grad-CAM) technique as a method to understand and visualize which image regions our deep learning model focuses on for predicting hematoma expansion [19]. This technique creates a localization map by utilizing the gradients flowing into the final convolution layer of the model, highlighting the important regions for analysis. We implemented Grad-CAM from the last convolution layer of the Integrated-to-HE model to visually represent the area deemed significant by the model in non-contrast head CT images for hematoma expansion prediction.
留言 (0)