
記住我

This was a single-center, open-label, phase IV trial conducted from January to June 2021 at the Cincinnati Children’s Hospital Medical Center. Adult participants provided written informed consent. Minors provided written assent, and their legal guardians provided written permission. The Cincinnati Children’s Hospital Medical Center Institutional Review Board approved this study, and it was conducted according to the guidelines of the Declaration of Helsinki and the International Conference on Harmonisation. The trial is registered at ClinicalTrials.gov (NCT04684381).
2.2 Selection of ParticipantsParticipants with SCD as well as healthy volunteers were enrolled. The main inclusion criteria for the SCD group were age ≥ 5 years and a diagnosis of SCD (either homozygous sickle cell anemia, sickle-β0-thalassemia, or sickle-hemoglobin C disease). The main exclusion criteria for the SCD group were hospitalization in the preceding 2 months; chronic kidney disease stage 4 or 5; severe chronic liver disease (Child-Pugh score 10–15); transfusion in the preceding 3 months; or the use of any l-glutamine supplement in the preceding 30 days. The main inclusion criteria for healthy volunteers were age ≥18 years; no known hematologic illness; and no known renal or hepatic impairment. Main exclusion criteria for healthy volunteers were transfusion in the preceding 3 months and an abnormal Hb profile by Hb electrophoresis.
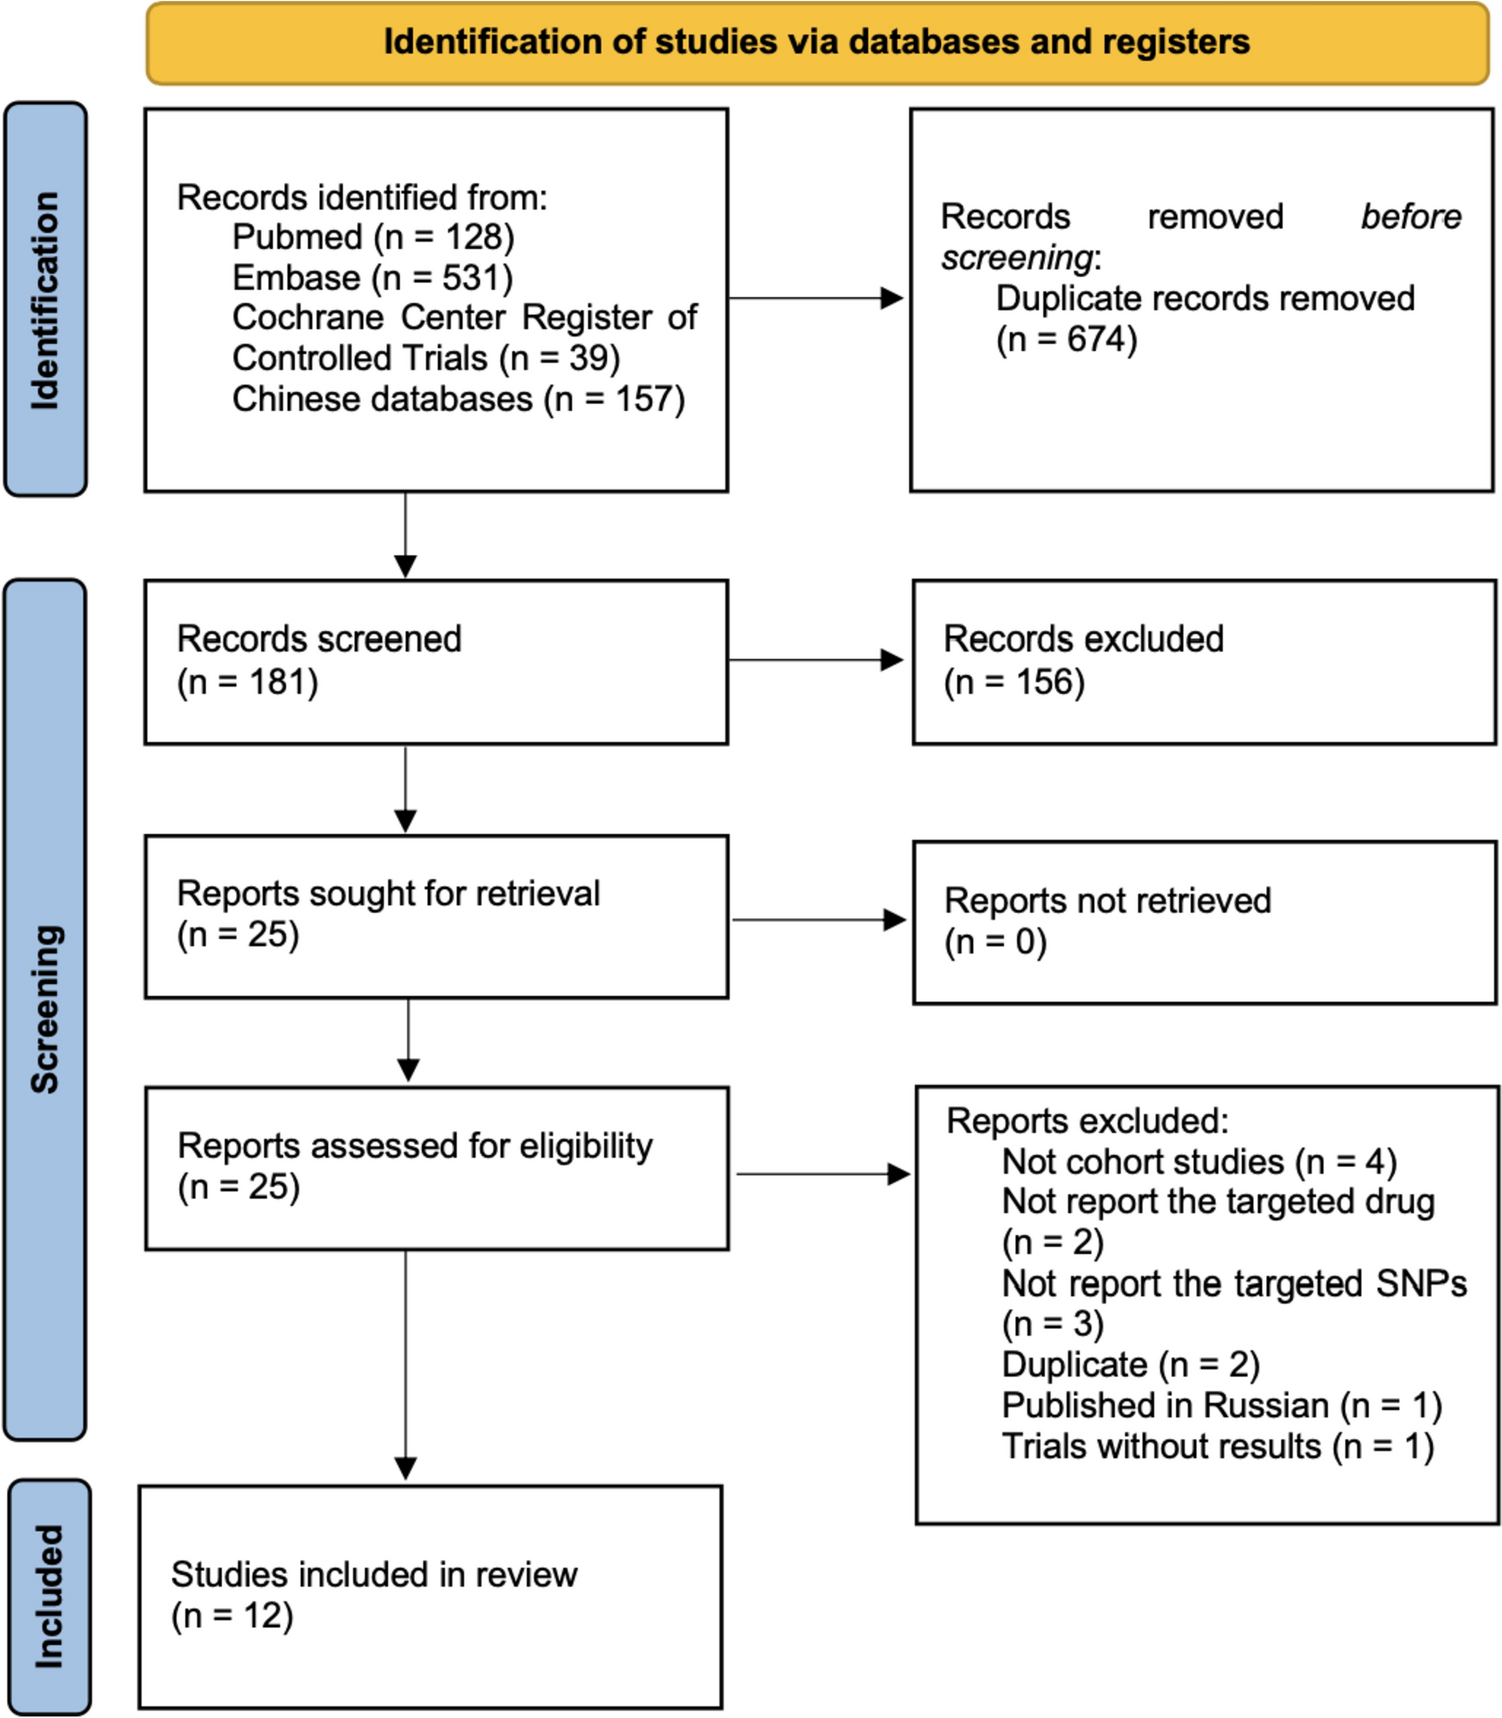
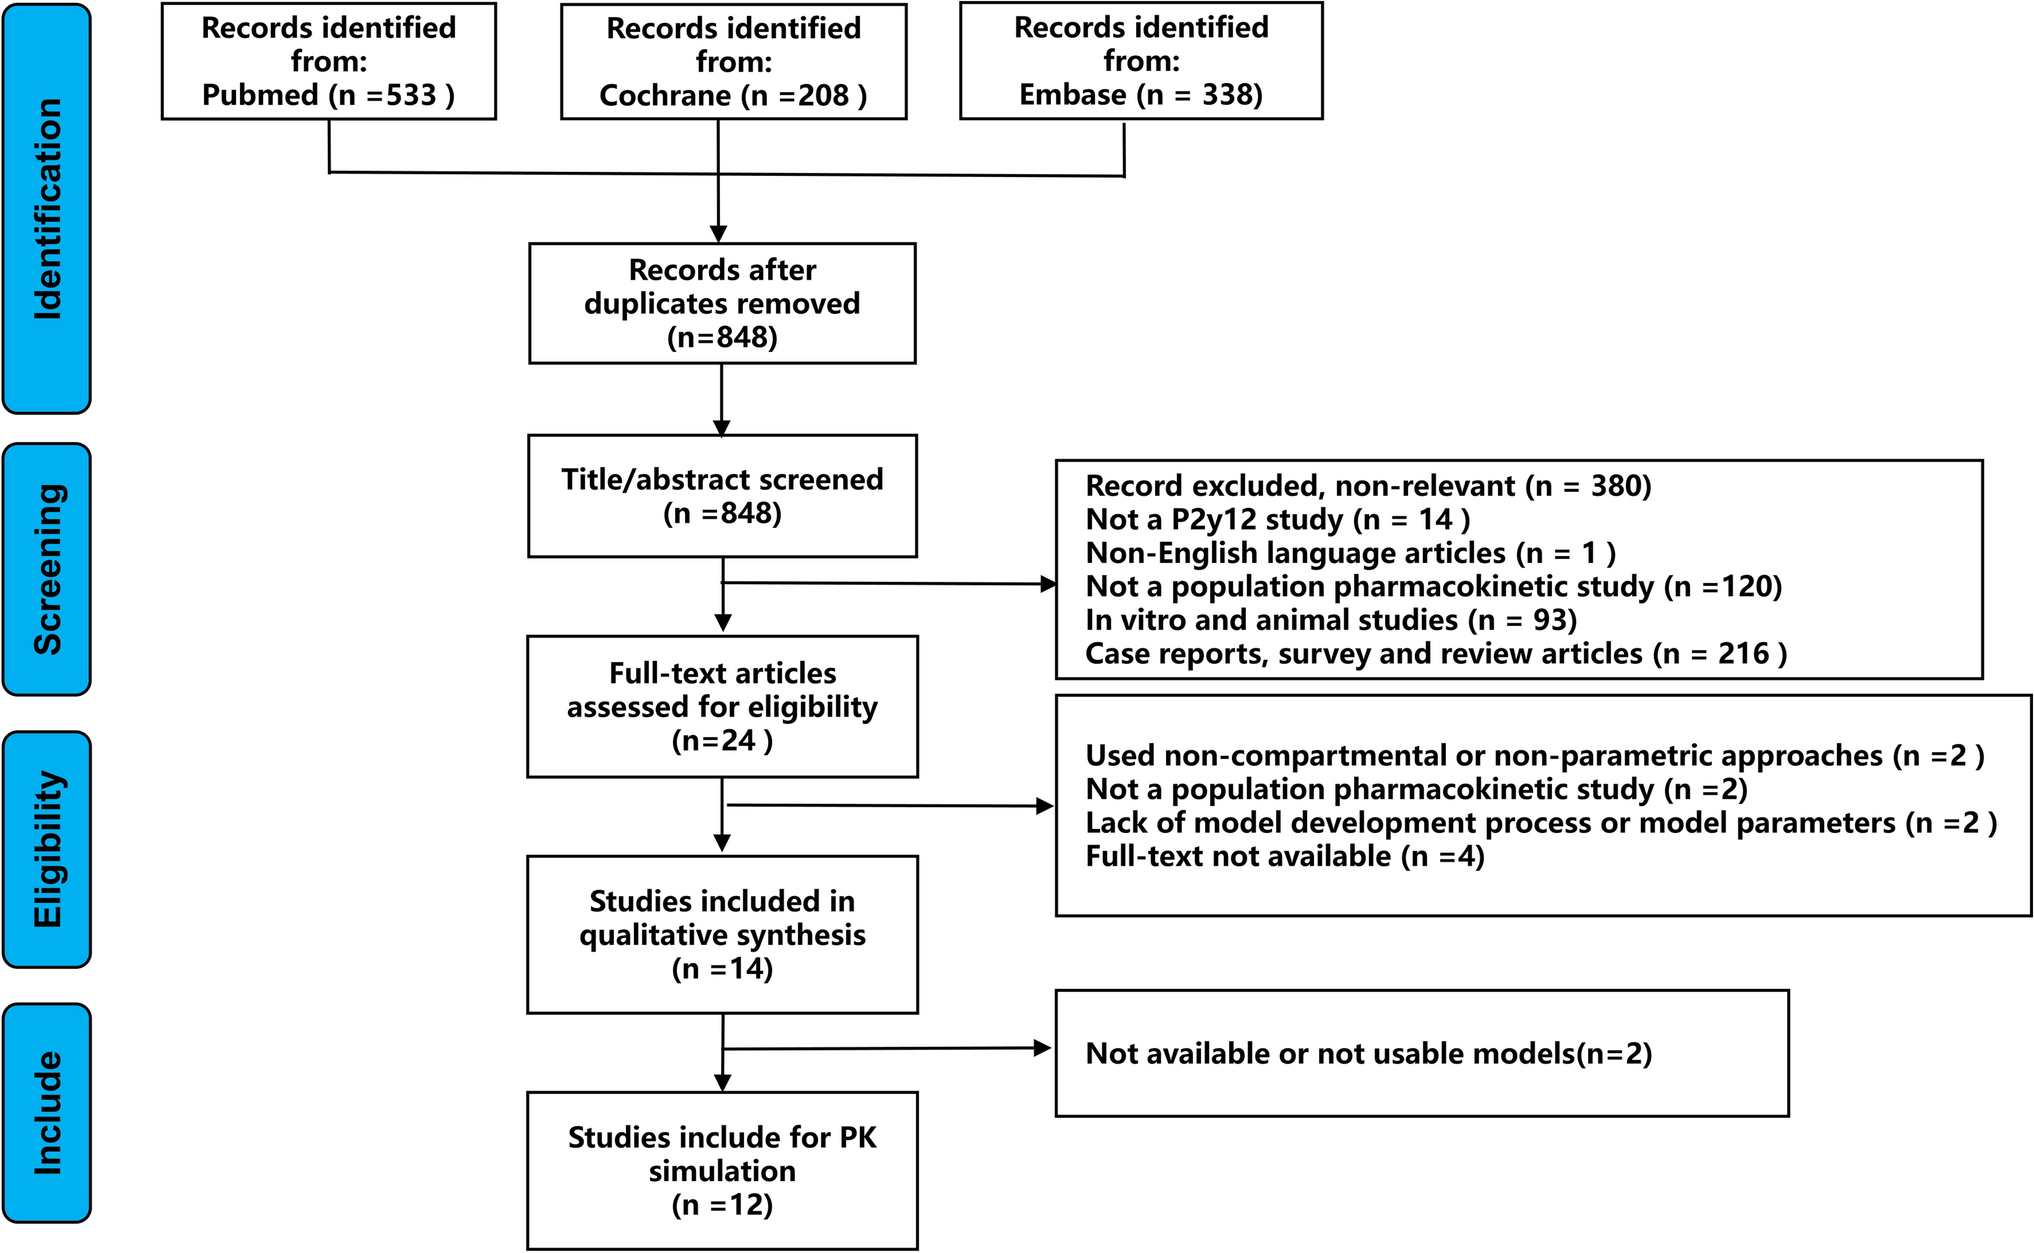
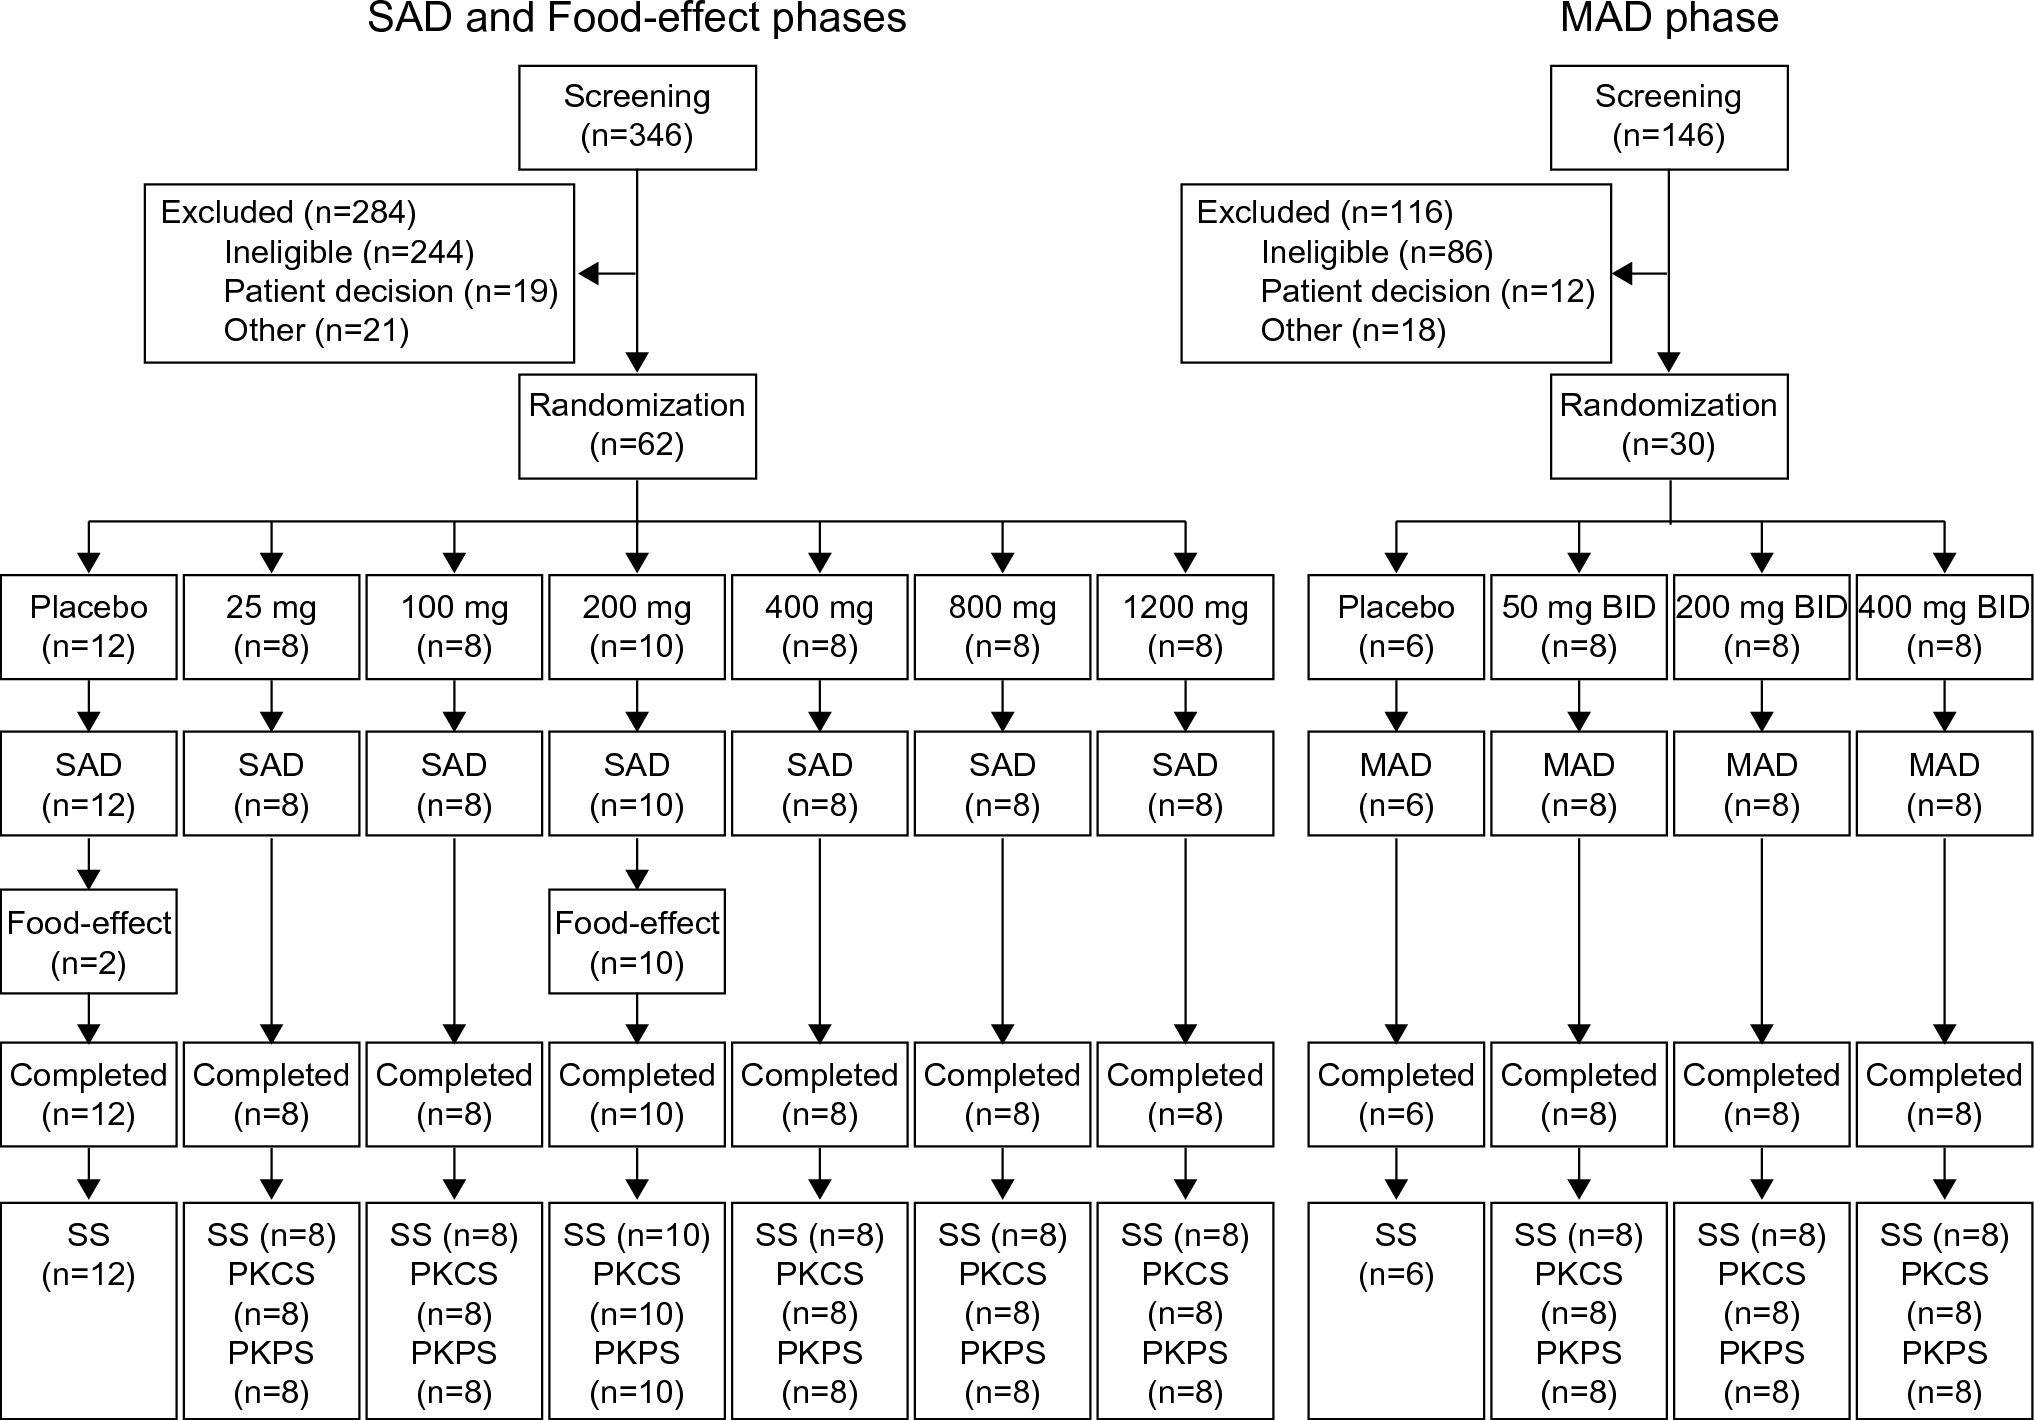
Sample size and allocation groups were pragmatically chosen in advance to be able to describe the pharmacokinetics of l-glutamine in a population that varied by age, genotype, and hydroxyurea co-treatment, as well as to allow a comparison with healthy volunteers. Twelve participants were allocated to three groups: pediatric SCD, age <18 years (N = 4); adult SCD, age ≥18 years (N = 4); and healthy volunteers, age ≥ 18 years (N = 4). Enrollment into each group stopped when its intended sample size was reached. Participants who did not complete at least the third study visit were withdrawn and replaced; their data were saved but not used in this analysis (Fig. 1 of the Electronic Supplementary Material [ESM]).
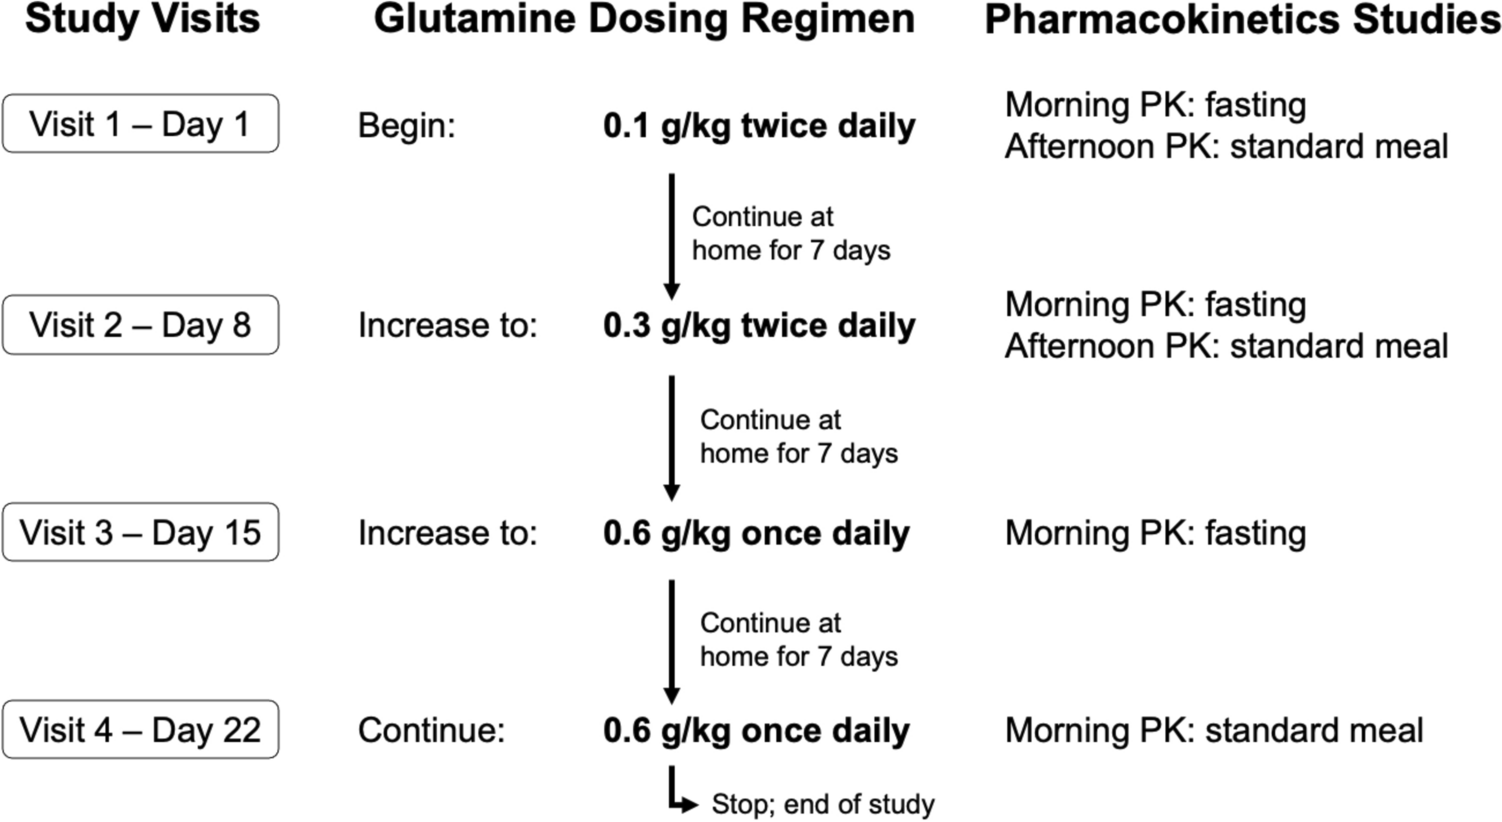
2.3 Study Interventionl-glutamine powder (Endari®) was dissolved in 120 mL of water and taken by mouth at 3 ascending dose levels for 3 consecutive weeks as shown in the study schema (Fig. 1). Weight-based doses (0.1 g/kg twice daily, 0.3 g/kg twice daily, and 0.6 g/kg once daily) were supplied as re-packaged Endari® powder for specific individualized doses (i.e., not rounded to the nearest Endari® packet size). Between study visits, participants continued to take l-glutamine until the next weekly study visit, when the dose was increased (visit 2) or continued unchanged (visit 3). Study medication was stopped at the end of visit 4, but patients could choose to continue l-glutamine for clinical care using commercially available products. Concomitant treatment with hydroxyurea was allowed, but the dose must have been stable in the 3 months preceding enrollment and unchanged during the trial. Other disease-modifying pharmacotherapies were similarly allowed. Participants with SCD who began a new disease-modifying therapy or had dose adjustments during the trial would be withdrawn. Long-term transfusion therapy was an exclusion criterion, and transfusions were a reason for early withdrawal from the study. Standard clinical care was not restricted.
Fig. 1
Study schema.l-glutamine dosing regimen and pharmacokinetic studies are shown by study visit. PK pharmacokinetics
2.4 Data Collection and Laboratory AnalysisBlood samples for the PK analysis were collected at baseline (immediate pre-dose) and 30, 60, 120, 180, and 240 min after the morning dose of l-glutamine (visits 1, 2, 3, and 4) and after the second dose in the afternoon (visits 1 and 2) using the same timing. To assess potential food–drug interactions in the PK analyses, l-glutamine was administered either following an overnight fast (a.m. doses on visits 1, 2, and 3) or after standardized meals (lunch on visits 1 and 2, and breakfast on visit 4) as illustrated (Fig. 1). Plasma was separated by centrifugation within 1 h of collection and frozen immediately (− 20 °C) until analysis in batches. The concentration of l-glutamine and other amino acids including a major l-glutamine metabolite, l-glutamate, were measured by ion-exchange chromatography (L-8900 Amino Acid Analyzer; Hitachi, Bethesda, MD, USA) using a Clinical Laboratory Improvement Amendments-certified process.
2.5 Descriptive Non-compartmental Pharmacokinetic AnalysisA descriptive non-compartmental PK analysis (NCA) was conducted using Phoenix WinNonlin® Professional Version 8.4 (Certara USA Inc., Princeton, NJ, USA). Parameters obtained included: (1) time to peak concentration (Tmax); (2) actual and dose-normalized peak concentrations (Cmax); and (3) the apparent terminal elimination half-life (T1/2), calculated as 0.693/λz. Considering l-glutamine is an endogenous amino acid, Cmax values were obtained by subtracting baseline concentrations from peak values. The apparent terminal elimination rate constant, λz, was estimated by linear regression on the terminal phase of the semi-logarithmic plasma concentration-versus-time curve. At least three data points with measurable concentrations were required to calculate λz. Points prior to and including Cmax were not used. The λz was only calculated when the coefficient of determination (r2) for the linear regression was ≥ 0.8.
2.6 Population PK Modeling2.6.1 Base Model DevelopmentTo better understand the covariate effects on PK parameters, population PK analyses were performed by nonlinear mixed-effect modeling using NONMEM (ICON, Ellicott City, MD, USA) [21]. Perl speaks NONMEM (PsN) version 3.6.2 [22] and Pirana version 2.7.1 (Certara USA Inc.) were used as the interface. NONMEM version 7.4 with the first-order conditional estimation with η–ε interaction algorithm was employed to estimate the typical population parameters, random effect of inter-individual variability, and residual errors simultaneously. The inter-individual variability was assessed using the following model (Eq. 1):
$$P_ = P_ \times \exp \left( } \right),$$
(1)
where Pi is the estimated parameter value for individual I, Ppop is the typical population value of the PK parameters such as clearance and volume of distribution, and ηi is an inter-individual random effect for individual i. Inter-occasion variability was also evaluated [23]. For the full dataset, four occasions were defined. The intra-individual variability was described by a proportional and additive error model (Eq. 2).
$$Y_ = C_ \times \left( } \right),$$
(2)
where Yi,j is the observed concentration, Cpred,i,j is the predicted concentration for individual i, and ε is a residual error.
For the PK analysis, the individual baseline l-glutamine concentration was subtracted from each l-glutamine measurement to obtain the absolute concentrations of l-glutamine due to the drug intake, assuming that the endogenous l-glutamine level is constant. Different base models including one-compartment and two-compartment with first-order or Michaelis–Menten disposition models were tested. A first-order absorption with or without a lag time was evaluated as the absorption model. Efforts were also made to model the parent drug, l-glutamine, and its metabolite, l-glutamate, simultaneously. However, the parameter for describing the glutamine-glutamate conversion was small and near the zero boundary, indicating the concentration of l-glutamate is small and could be ignored.
2.6.2 Covariate AnalysisVariables such as body weight, age, height, body surface area, sex, l-glutamine dose levels, food intake, serum creatinine, Hb genotype (HbAA [healthy volunteers], sickle-hemoglobin C disease or homozygous sickle cell anemia), baseline l-glutamine concentration, and baseline l-glutamate concentration were evaluated as potential covariates using the stepwise selection method. The meal effect was considered as a categorical covariate and was coded as 0, 0.5, or 1 for fasting, snack intake, and full meal intake, respectively. If the participant consumed a snack and a full meal between two consecutive measurements, the meal was coded as 1.5. For covariate model selection, the change in the objective function value (OFV) between two nested models was assumed to follow the χ2 distribution, and forward inclusion and backward elimination with a significance level of < 0.05 (− 3.84 points in OFV) and < 0.01 (− 6.64 points in OFV) were used, respectively. In accordance with allometry theory, body weight was found to be significantly correlated to l-glutamine clearance (CL/F) and volume of distribution (V/F) at initial evaluation, where F represents relative bioavailability. We therefore used allometrically scaled body weight to account for differences in body size as follows (Eq. 3):
$$P_ = P_ \times \left( }} }}} \right)^ ,$$
(3)
where BWi is body weight for individual i, BWstandard is 70 kg, and power is the coefficient set at 0.75 for CL/F and 1 for V/F. Other patient characteristics and laboratory measurements were tested as formulated for categorical or continuous covariates as demonstrated by Eqs. 4 and 5, respectively:
$$P_ = P_ \times \left( ^} \right),$$
(4)
$$P_ = P_ \times \left( } }}} \right)^ ,$$
(5)
where Pi, COVcat, and COVcon are the parameters for individual i, COVmedian is the standardized value for a continuous covariate, and Ɵ represents the power factor of the relationship.
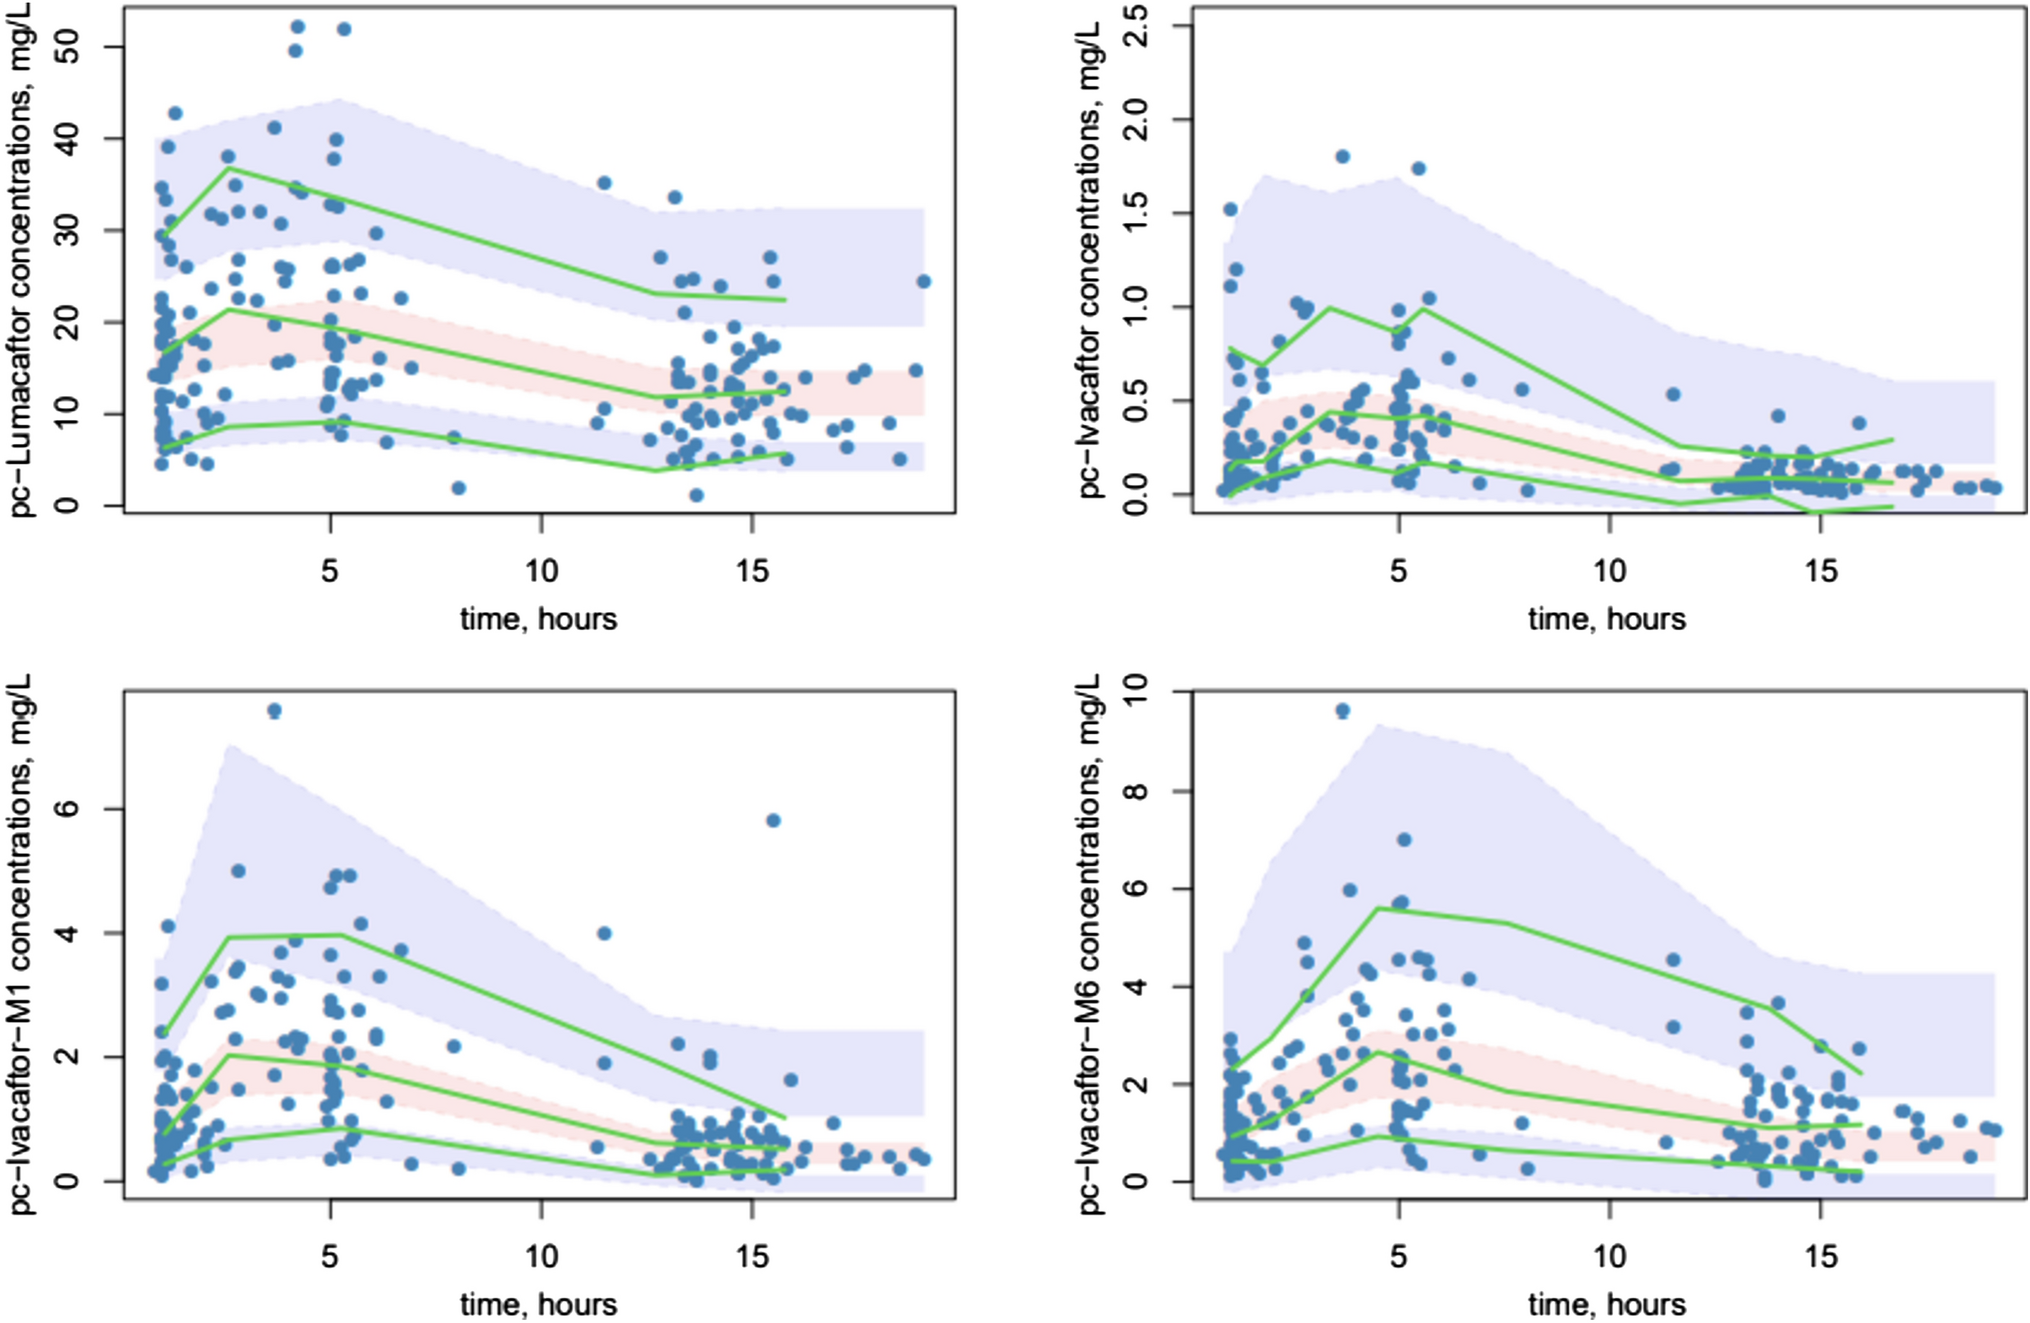
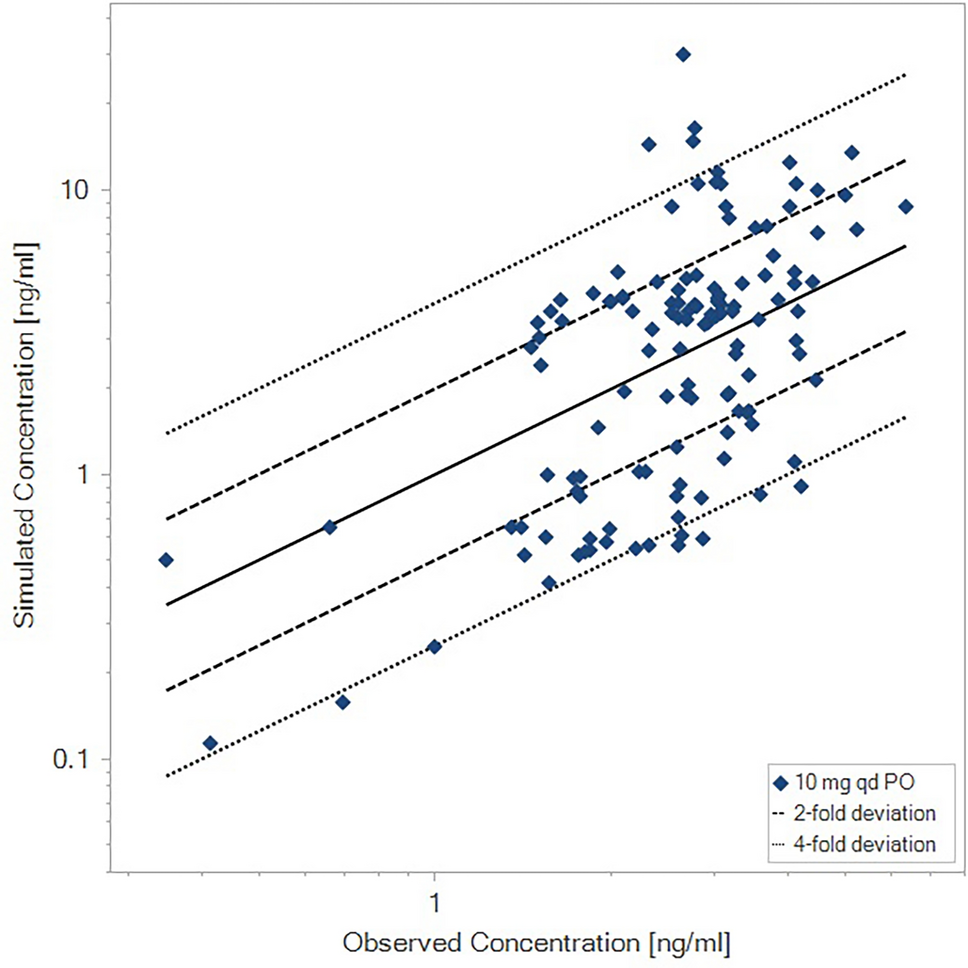
2.6.3 Model EvaluationThe following criteria were considered for model selection: successful convergence, OFV (or Akaike Information Criterion), precision of parameter estimates, and plausibility of parameter estimates. In addition, diagnostic goodness-of-fit plots and graphical assessments were performed using R version 3.6.2 and Xpose version 4.4.0 [24]. The following diagnostic plots were used to evaluate the models: observed value (DV) versus population predicted value (PRED), DV versus individual predicted value (IPRED), conditional weighted residuals versus PRED, and conditional weighted residuals versus time after dose to identify a bias corresponding to model misspecification. A non-parametric bootstrap analysis was employed to evaluate the stability of the final model using Perl-speaks-NONMEM (PsN) version 3.5.3. The resampling was done 1000 times, and 95% confidence intervals of parameter estimates from the bootstrap analysis were compared to the final model estimates. The visual predictive check was used for the final evaluation [25]. One thousand replicates of simulated datasets were generated using the final model, and the distribution of simulated observations was compared with the actual observations.
2.7 Additional Statistical AnalysisA Student’s t-test was used for the comparison of PK parameters (e.g., Cmax, area under the curve) between dose groups. P-values <0.05 from two-sided tests were considered statistically significant.
留言 (0)