
記住我

Hippocampal sclerosis (HS) is the most common form of drug-resistant epilepsy in adults. The pathological characteristics of HS include neuronal loss and chronic fibrillary gliosis centered on the pyramidal cell layer and/or neuronal loss involving the CA1 subfields. These effects are accompanied by granule cell dispersion, mossy fiber sprouting, and interneuronal alterations.1 The hippocampal formation comprises a number of distinct interacting subregions, which distinct interacting subregions operating together in the form of complex heterogeneous structures referred to as subfields. These subfields present distinct cytoarchitectures, connectivity, and functions, whether in a healthy or diseased state.2–5 An understanding of the internal network architecture could help to elucidate the mechanisms underlying intractable epilepsy and neurocognitive impairment. Advances in neuroimage segmentation and volumetry have made it possible to visualize the internal structures of the hippocampus in vivo.6 The study of hippocampal subfields has attracted particular attention in the research of Alzheimer disease (AD).7 Hippocampal subfield analysis based on PET-MRI has proven far more effective than global hippocampal assessments in detecting pathological changes associated with AD.8 In cases of medial temporal lobe epilepsy (MTLE), 18F-FDG PET has been used to observe brain glucose metabolism and lateralize seizure focus in assessing the suitability of patients for epilepsy surgery and predicting surgical outcomes.9,10 Neuroimaging has seldom been used to observe glucose metabolism in the hippocampal subfields of patients with MTLE.
The objectives in the current study were as follows: (1) compare the severity of hypometabolism among hippocampal subfields in cases of HS; (2) examine the relationship between metabolism in the hippocampal subfields and postoperative seizure outcomes; and (3) assess the correlation between neuropsychological function and the severity of hypometabolism in the hippocampal subfields of patients with MTLE.
PATIENTS AND METHODS SubjectsThis study was based on a database review of epilepsy surgeries performed between May 2000 and January 2023. We first included patients who underwent resection surgery for drug-resistant MTLE with a pathological diagnosis of HS. Note that the inclusion criteria included both preoperative 3T high-resolution MRI and 18F-FDG PET. For a portion of these patients, we were able to obtain postoperative follow-up data for at least 1 year, which enabled us to determine postoperative seizure outcomes based on Engel classification. Seizure outcomes were categorized as seizure-free since surgery (class IA) and non–seizure-free since surgery (class other than IA).11,12 Epilepsy-related information data video-electroencephalograph (EEG), neuroimaging results, and neuropsychological test results were collected. A validated Chinese version of the Wechsler Memory Scale-III13 was used for preoperative neuropsychological assessment. The Verbal Paired Associates subtest (VP), Word List subtest (WL), and Logical Memory subtest (LM) were used to assess verbal memory. The Faces Memory subtest (FM), Visual Reproduction subtest (VR), and Spatial Memory subtest (SM) were used to assess nonverbal/spatial memory.
18F-FDG PET and MRI ProtocolThe patients refrained from ingesting any food or drink (including IV glucose-containing fluid) for at least 6 hours before the PET examination. To prevent the administration of 18F-FDG during or shortly after a seizure, efforts were made to ensure that there were no clinical or electroencephalographic signs of a seizure for at least 2 hours before administering the 18F-FDG tracer. To avoid the effects of hyperglycemia on 18F-FDG uptake in the brain, blood sugar levels were monitored to ensure that they remained below 150 mg/dL. After administering 18F-FDG intravenously at 5 MBq/kg, the patients were brought to a dim quiet room to rest for roughly 30 minutes without any visual stimulation, including reading or watching TV/smartphone. No clinically overt seizures were noted among any of the patients during this 30-minute rest period. The patients then underwent a 15-minute PET scan in static acquisition mode using the GE Healthcare Discovery STE PET/CT system (before October 2019), GE Healthcare Discovery MI DR PET/CT (after October 2019), or SIGNA PETMR system (after October 2019).
All MRI data (Signa HDxt 3T GE system, Signa HDxt 1.5T GE system, or Simens Magnetom 1.5T system) were collected using an 8-channel phased-array neurovascular coil. The parameters used for 3-dimensional magnetization-prepared rapid acquisition with gradient echo (3D MPRAGE) imaging were as follows: repetition time, 9.16 milliseconds; echo time, 3.39 milliseconds; flip angle, 20 degrees; field of view, 384–320 mm; number of excitations, 2; and slice thickness, 1.5 mm.
18F-FDG PET and MRI ProcessingThe 18F-FDG PET images were aligned with 3D MPRAGE images via 3D voxel registration using the normalized mutual information method.14 Three-dimensional MPRAGE images were segmented into gray matter (GM), white matter, and cerebrospinal fluid. The 18F-FDG PET images underwent voxel-based partial volume correction via the Müller-Gärtner method using the PETPVE12 toolbox.15 The entire volume of GM in the brain was used as a reference for intensity normalization in the quantitative analysis of the partial volume-corrected 18F-FDG PET images. A brain GM mask was established using a 0.5-thresholded and binarized probabilistic GM density map. SUVr maps were generated for each patient by normalizing 18F-FDG uptake and calculating the average SUVr for each region of interest (ROI). Intensity-normalized SUVr maps underwent spatial smoothing using a Gaussian smoothing kernel with a 6-mm full-width at half-maximum. 18F-FDG PET data of healthy control subjects were unavailable; therefore, we computed an asymmetry index rather than a Z-score for each ROI using the following formula: (ipsilateral side SUVr − contralateral side SUVr) × 2/(ipsilateral side SUVr + contralateral side SUVr). The ipsilateral side was defined as the side on which epilepsy was detected and surgery was performed. A more negative asymmetry index value indicates more pronounced hypometabolic activity and lower SUVr on the ipsilateral side relative to the contralateral side.
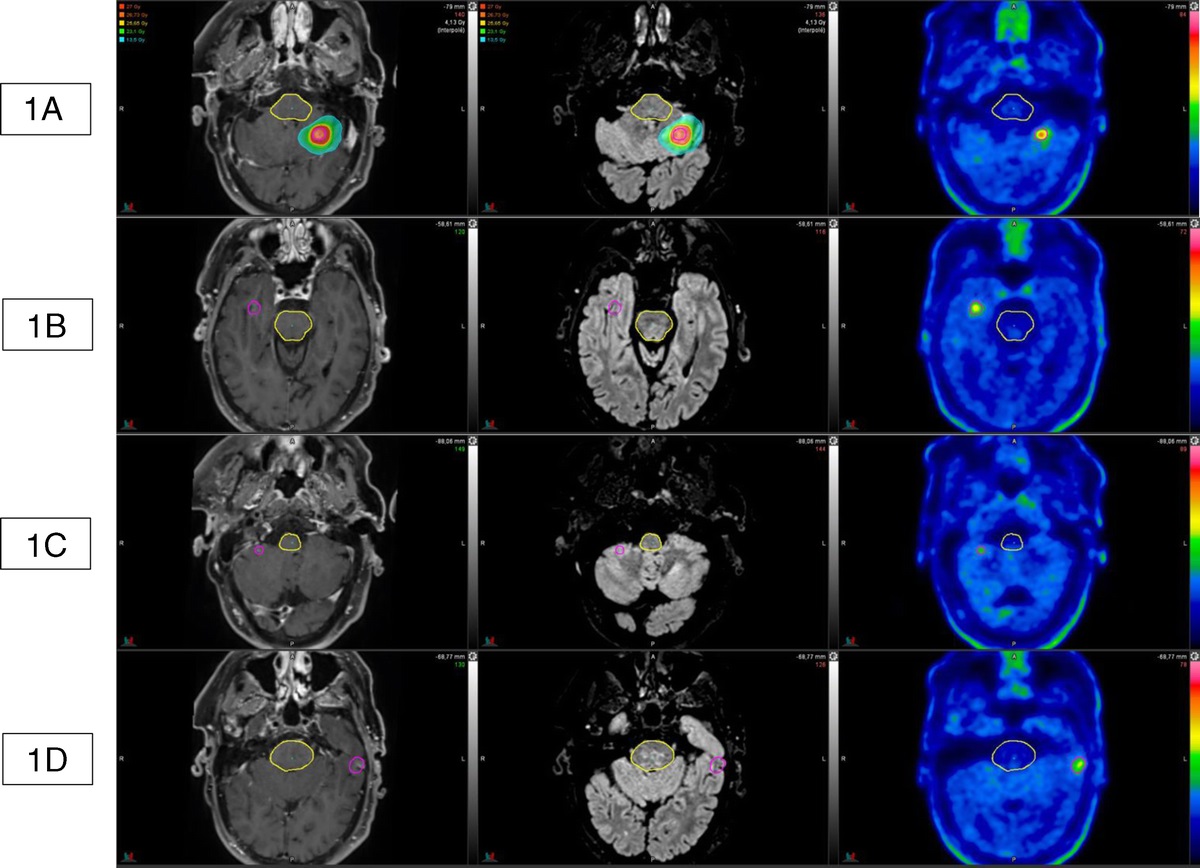
Segmentation of Hippocampal Subfields of InterestThe automated segmentation of hippocampal subfields was performed on 3D MPRAGE images using FreeSurfer version 7.1.1. The standard FreeSurfer “recon-all” pipeline was used to generate morphometric data for each individual. The automated labeling of hippocampal subfields was conducted via adaptive segmentation guided by the segmentation of the whole hippocampal nuclei.6,16Figure 1 illustrates the anatomical locations of hippocampal subfields in 3D MPRAGE images from a patient diagnosed with HS. Labels were created for the entire hippocampus and its 5 subfields: CA1-head, CA1-body, CA3-head, CA3-body, CA4-head, CA4-body, subiculum-head, subiculum-body, granule cell and molecular layer of the dentate gyrus (GC-ML-DG)–head, and GC-ML-DG–body. In accordance with the FreeSurfer segmentation methodology,6 CA2 was integrated within CA3. Note that the accuracy of the hippocampal subfield labels was verified visually for each patient. To ensure that the volume of the ROIs exceeded 216 mm3 under a smoothing size of 6 mm, we consolidated CA3 and CA4 within a single subfield, referred to as CA2–4. To facilitate quantitative analysis, we merged the head and body of the 4 hippocampal substructures and extracted 4 ROI SUVr for further evaluation. The volumes of individual hippocampal subfields and the entire hippocampus on both sides were normalized by dividing them by the estimated total intracranial volume. The asymmetry index for volume was calculated as follows: (ipsilateral side volume − contralateral side volume) × 2/(ipsilateral side volume + contralateral side volume). The ipsilateral side was defined as the side on which epilepsy was detected and surgery was performed. A more negative asymmetry index value indicated a smaller volume on the ipsilateral side relative to the contralateral side.
 FIGURE 1:
 Anatomical locations of hippocampal subfields in the sagittal, coronal, and axial sections in a patient with HS. These subfields include the subiculum, CA1, CA2–4, and GC-ML-DG.
Statistical AnalysisIn this cross-sectional study, the mean volume and SUVr among ROIs were calculated for both the ipsilateral and contralateral sides. The ipsilateral and contralateral sides were also compared in terms of SUVr and volume measurements of the hippocampal subfields. After correcting for the false discovery rate, a P value of less than 0.05 was deemed significant. Linear partial correlation analysis was conducted between the asymmetry index and various clinical variables with age of onset as a covariate. All statistical analysis was performed using MATLAB software (MathWorks, Inc, Natick, MA). Univariate logistic regression was used to gauge freedom from postoperative seizure, using hippocampal subfield volume/SUVr as a predictor. The level of significance was set at P < 0.05 with Bonferroni correction for multiple comparisons. The Wilcoxon signed rank test was used to compare degrees of asymmetry across subfields. This retrospective study received approval from the Institutional Review Board of Taipei Veterans General Hospital (2021-05-013AC), with a waiver for individual consent.
RESULTSA total of 29 patients (11 males) ranging in age from 15 to 58 years fulfilled the inclusion criteria (13 left MTLE and 16 right MTLE), and 15 patients remained seizure-free at 1-year postsurgery (Table 1). Five patients underwent 1.5T MRI, and 24 patients underwent 3T MRI. Among all patients, the main EEG findings included frontotemporal spikes and ictal EEG evolution on the side of mesial temporal sclerosis.
TABLE 1 - Epilepsy-Related Characteristics of Study Subjects (n = 29) Number or Median Value (Min–Max) Gender, male/female, n 11/18 Age of seizure onset, y 10 (1.3–34) Age at time of epilepsy surgery, y 29 (15–58) Duration of epilepsy, y 19 (2–48) History of febrile seizure, n 5 History of CNS infection, n 5 History of head injury, n 1 FSIQ 87 (53–111) Side of surgery, left/right, n 13/16 Surgery type, CAH/SAH, n 12/17 Handedness, left/right, n 0/29 Seizure outcomes,* seizure-free/non–seizure-free, n 15/11*Seizure outcomes could be determined for only the 26 patients who underwent postoperative follow-up for more than 1 year.
CNS, central nervous system; FSIQ, full-scale intelligence quotient; CAH, corticoamygdalohippocampectomy; SAH, selective amygdalohippocampectomy; min, minimum; max, maximum.
The normalized volumes of the CA1, CA2-4, subiculum, GC-ML-DG, and whole hippocampus were significantly lower on the ipsilateral side than on the contralateral side (P < 0.001). Age at seizure onset was positively associated with the normalized volume of the ipsilateral CA1 and CA2-4 (P < 0.05), which means that seizure onset at a later age was associated with larger volumes in the ipsilateral CA1 and CA2-4 subregions. The duration of epilepsy was negatively associated with the normalized volume of the ipsilateral CA1, CA2-4, subiculum, GC-ML-DG, and whole hippocampus (P < 0.05), which means that epilepsy for a longer duration was associated with smaller volumes in the ipsilateral CA1, CA2-4, subiculum, GC-ML-DG, and whole hippocampus. Normalized volumes in the CA1, CA2-4, subiculum, GC-ML-DG, and whole hippocampus (ipsilateral and contralateral) did not vary as a function of MTLE side, gender, or febrile seizure history, with the exception that the normalized volume of the whole contralateral hippocampus was smaller in males than in females (P < 0.039). The degree of volume asymmetry between the ipsilateral and contralateral sides was most pronounced in GC-ML-DG followed by CA2-4, both of which significantly exceeded that of the CA-1 and subiculum (Table 2).
TABLE 2 - Volume and SUVr AI Among Hippocampal Subfields Hippocampal Subfields AI (Volume) AI (SUVr) Differences in AI Scores Between Hippocampal Subfields (P for AI [Volume]/P for AI [SUVr]) vs CA1 vs Subiculum vs CA2–4 vs GC-ML-DG CA1 −0.221 ± 0.238 −0.198 ± 0.129 0.387/0.163 0.007*/<0.001* 0.001*/<0.001* Subiculum −0.208 ± 0.190 −0.173 ± 0.112 0.387/0.163 0.016*/<0.001* 0.004*/<0.001* CA2–4 −0.277 ± 0.255 −0.288 ± 0.162 0.007*/<0.001* 0.016*/<0.001* 0.350/0.056 GC-ML-DG −0.284 ± 0.251 −0.273 ± 0.145 0.001*/<0.001* 0.004*/<0.001* 0.350/0.056*P < 0.05.
AI, asymmetry index = 2 × (ipsilateral − contralateral)/(ipsilateral + contralateral).
The SUVr of the CA1, CA2-4, subiculum, GC-ML-DG, and whole hippocampus was significantly lower on the ipsilateral side than on the contralateral side (P < 0.001, Table 3). No correlations were observed between SUVr on either side of the hippocampus (including the whole hippocampus or any of its subfields) and the age of seizure onset or duration of epilepsy. No correlation was observed between the MTLE side and SUVr in the whole hippocampus or any of its subfields. The SUVr of the whole contralateral hippocampus, CA-1, subiculum, and GC-ML-DG was higher among male patients than among female patients (P < 0.05). The SUVr in the ipsilateral hippocampus and its subfields was lower among patients with a history of febrile seizure than among patients without a history of febrile seizure. The degree of SUVr asymmetry between the ipsilateral and contralateral sides was highest in the CA2-4 followed by the GC-ML-DG, both of which significantly exceeded that of the CA-1 and subiculum (Table 2).
TABLE 3 - SUVr of Whole Hippocampus and Its Subfields on Ipsilateral and Contralateral Sides Hippocampus Regions Ipsilateral Side Contralateral Side P* CA1 0.651 ± 0.106 0.792 ± 0.116 <0.001 CA2–4 0.604 ± 0.131 0.800 ± 0.130 <0.001 Subiculum 0.765 ± 0.122 0.907 ± 0.123 <0.001 GC-ML-DG 0.631 ± 0.128 0.825 ± 0.134 <0.001 Whole hippocampus 0.656 ± 0.107 0.801 ± 0.119 <0.001No significant correlation was observed between seizure-free status after surgery and the normalized volume of the ipsilateral hippocampus or contralateral hippocampus or the asymmetry index of the hippocampus or any hippocampal subfield.
SUVr and SUVr Asymmetry of the hippocampus and Postoperative Seizure OutcomesNo significant correlation was observed between seizure-free status after surgery and SUVr in the ipsilateral hippocampus or contralateral hippocampus or the asymmetry index of the hippocampus or any hippocampal subfield.
Volume and Glucose Metabolism of the Hippocampus and Neuropsychological Function Volume Asymmetry of the Hippocampus and Neuropsychological FunctionIn cases of left MTLE, volume asymmetry index scores for the CA1 were positively correlated with logical memory scores for immediate recall (LM-I_SS) (R = 0.767, P = 0.044; Supplementary Table S1, https://links.lww.com/CNM/A459). In cases of right MTLE, no correlation was observed between neuropsychological function and volume asymmetry in the whole hippocampus or any hippocampal subfield (Supplementary Table S2, https://links.lww.com/CNM/A460).
SUVr Asymmetry of the Hippocampus and Neuropsychological FunctionIn cases of left MTLE, the LM-I_SS and logical memory scale scores for delayed recall (LM-II_SS) were positively correlated with SUVr asymmetry index scores for the CA1 (immediate, P = 0.021; delayed, P = 0.043), CA2-4 (immediate, P = 0.022; delayed, P = 0.007), subiculum (immediate, P = 0.009; delayed, P = 0.015), GC-ML-DG (immediate, P = 0.015; delayed, P = 0.032), and whole hippocampus (immediate, P = 0.018; delayed, P = 0.023) (Table 4). In cases of right MTLE, facial memory scale scores for delayed recall (FM-II_SS) were positively associated with the SUVr asymmetry index of the subiculum (P = 0.006) (Table 5).
TABLE 4 - Spearman Partial Correlation Coefficients (Using Age of Seizure Onset as a Covariate) Between Asymmetry Index of PET SUVr and Neuropsychological Examination Results Among Patients With Left MTLE CA1 CA2–4 Subiculum GC-ML-DG Whole Hippocampus R P R P R P R P R P VP-I_SS, n = 4 −0.667 0.535 NA NA NA NA −0.946 0.211 NA NA VP-II_SS, n = 4 −0.980 0.128 NA NA NA NA −0.953 0.197 NA NA WL-I_SS, n = 9 −0.226 0.591 −0.107 0.801 −0.368 0.369 −0.149 0.724 −0.007 0.988 WL-II_SS, n = 9 −0.513 0.193 −0.237 0.572 −0.451 0.262 −0.432 0.286 −0.283 0.497 LM-I_SS, n = 8 0.829 0.021* 0.825 0.022* 0.882 0.009* 0.850 0.015* 0.841 0.018* LM-II_SS, n = 8 0.770 0.043* 0.894 0.007* 0.853 0.015* 0.796 0.032* 0.822 0.023* FM-I_SS, n = 5 0.409 0.591 0.918 0.082 0.918 0.082 0.669 0.331 0.918 0.082 FM-II_SS, n = 5 −0.105 0.895 0.500 0.500 0.500 0.500 0.302 0.698 0.500 0.500 VR-I_SS, n = 8 0.124 0.791 0.149 0.750 0.076 0.872 0.096 0.838 0.330 0.470 VR-II_SS, n = 8 0.438 0.326 0.703 0.078 0.645 0.118 0.464 0.295 0.605 0.150 SM_SS, n = 9 0.498 0.209 0.596 0.119 0.568 0.141 0.519 0.187 0.591 0.123*P < 0.05.
I, immediate; II, delayed; SS, scaled score; NA, not applicable.
*P < 0.05.
I, immediate; II, delayed; SS, scaled score; NA, not applicable.
FreeSurfer morphometric procedures have been applied to the analysis of principal hippocampal subfields in the study of neuropsychiatric disorders, roughly 10% of which focused on epilepsy.7 Note, however, that quantitative volumetric measurements of the brain are highly subject to interindividual variability, which means that volume calculations must be adjusted to account for total intracranial volume, age, and gender. In the current study, we examined changes in the volume of the hippocampi (ie, the hallmark of HS) in terms of asymmetry between the 2 sides of the same individual, thereby minimizing the effects of individual variability. Researchers have recently reported overall reductions in the volume of ipsilateral hippocampal subfields (in the MRI of patients with unilateral MTLE), the results of which are in agreement with known pathologic findings.17–20 Hippocampal sclerosis can be classified according to the severity of neuronal loss in the various subfields, resulting in 3 distinct histopathologies: type 1 (neuronal losses predominantly in the CA1 and CA4; 60%–80% of HS cases); type 2 (severe neuronal loss predominant in the CA1); and type 3 (neuronal loss predominantly in the CA4/dentate gyrus). Note that the latter 2 groups are related to poor seizure outcomes after surgery.3 The histopathologic findings revealed that the most pronounced neuronal loss occurred in the CA120; however, the observed decrease in the volume of the CA1 did not necessarily exceed that of other hippocampal subfields.18,19 MRI results revealed that all of the volumes (ie, across all subfields) were positively correlated with neuronal density and size21; however, this was not the case in other studies.18,19,22,23 In the current study, volume reductions on the ipsilateral side were more prominent in the GC-ML-DG and CA2-4 than in other subfields, when using the contralateral side as a reference. It is important to consider that few previous studies have addressed HS-related atrophy at the subfield level; moreover, the results have been inconsistent.24–27 Two recent studies have reported on the use of automated segmentation. One study reported significant reductions in the volume of the contralateral presubiculum in patients with left MTLE.25 Princich et al26 reported that the most atrophic subfields ipsilateral to the sclerotic side were the CA4 and GC-ML-DG in both right and left HS patients. In the current study, we obtained similar findings.
Glucose Metabolisms of the Hippocampus and Hippocampal SubfieldsCoregistering 18F-FDG PET scans with high-resolution MRI can be helpful in hippocampal subfield segmentation. Several studies that adopted this method for AD have reported that SUVr levels in the dentate gyrus, CA1, and CA2-3 are significantly lower in patients with mild cognitive impairment or AD than in control subjects.8,28 Note that glucose metabolism in hippocampal subfields has not been widely investigated in the context of epilepsy. In the current study, asymmetry index values in the CA2-4 and GC-ML-DG were significantly higher than in the subiculum and CA1. Note, however, that most of the previous histopathologic findings related to HS indicated that the most pronounced neuronal loss occurred in the CA1.3 We speculate that glucose metabolism in the hippocampus cannot be explained by neuronal density alone. In a previous study of patients with MTLE due to HS, neuronal density in the subiculum, CA1, CA4, and DG did not correlate with the severity of hypometabolism.29 In animal models, glucose metabolism has been shown to proceed through serial changes in epileptogenesis.30 Increased glucose utility by activated astrocytes rather than pyramidal cells has been observed in the hippocampal CA1 in rats after ischemia.31 Considering the results in the literature, it could be surmised that glucose metabolism in a sclerotic hippocampus is a combination of neuronal loss and astrogliosis.
Volume and Metabolism of Hippocampal Subfields and Postoperative Seizure OutcomesIn the current study, we observed no relationship between the volume of hippocampal subfields and postoperative seizure outcomes. Previous studies on the relationship between volumetry and seizure outcomes have reported discordant results,18,32,33 due in pa
留言 (0)