Human tissue samples
Tumors were surgically resected from patients with breast cancer at Fukushima Medical University Hospital (Fukushima, Japan). Cases with de novo Stage IV and those treated with preoperative chemotherapy were excluded from this study. Paraffin-embedded tissue samples of 199 cases were obtained between 2011 and 2014, which were used for IHC, while both paraffin-embedded and frozen tissue samples from 14 patients were obtained between April 2020 and July 2020. Regarding the frozen samples, a portion of each tissue specimen was snap-frozen immediately after resection and stored at -80˚C until use. This study was approved by the Ethics Committee of Fukushima Medical University (Number 3181). Informed consent was obtained from all individual participants included in the study. Breast cancer subtypes were determined based on the expression of ER, PgR, and HER2, and Ki-67, with a cut-off point of 14% [19].
Cells and RNAi experiment
SK-BR-3, MCF-7, and HEK293T cells were purchased from ATCC. They were grown in Dulbecco’s modified Eagle’s medium (DMEM; Nacalai Tesque, Kyoto, Japan) supplemented with 10% fetal bovine serum (FBS) at 37 °C in 5% CO2.
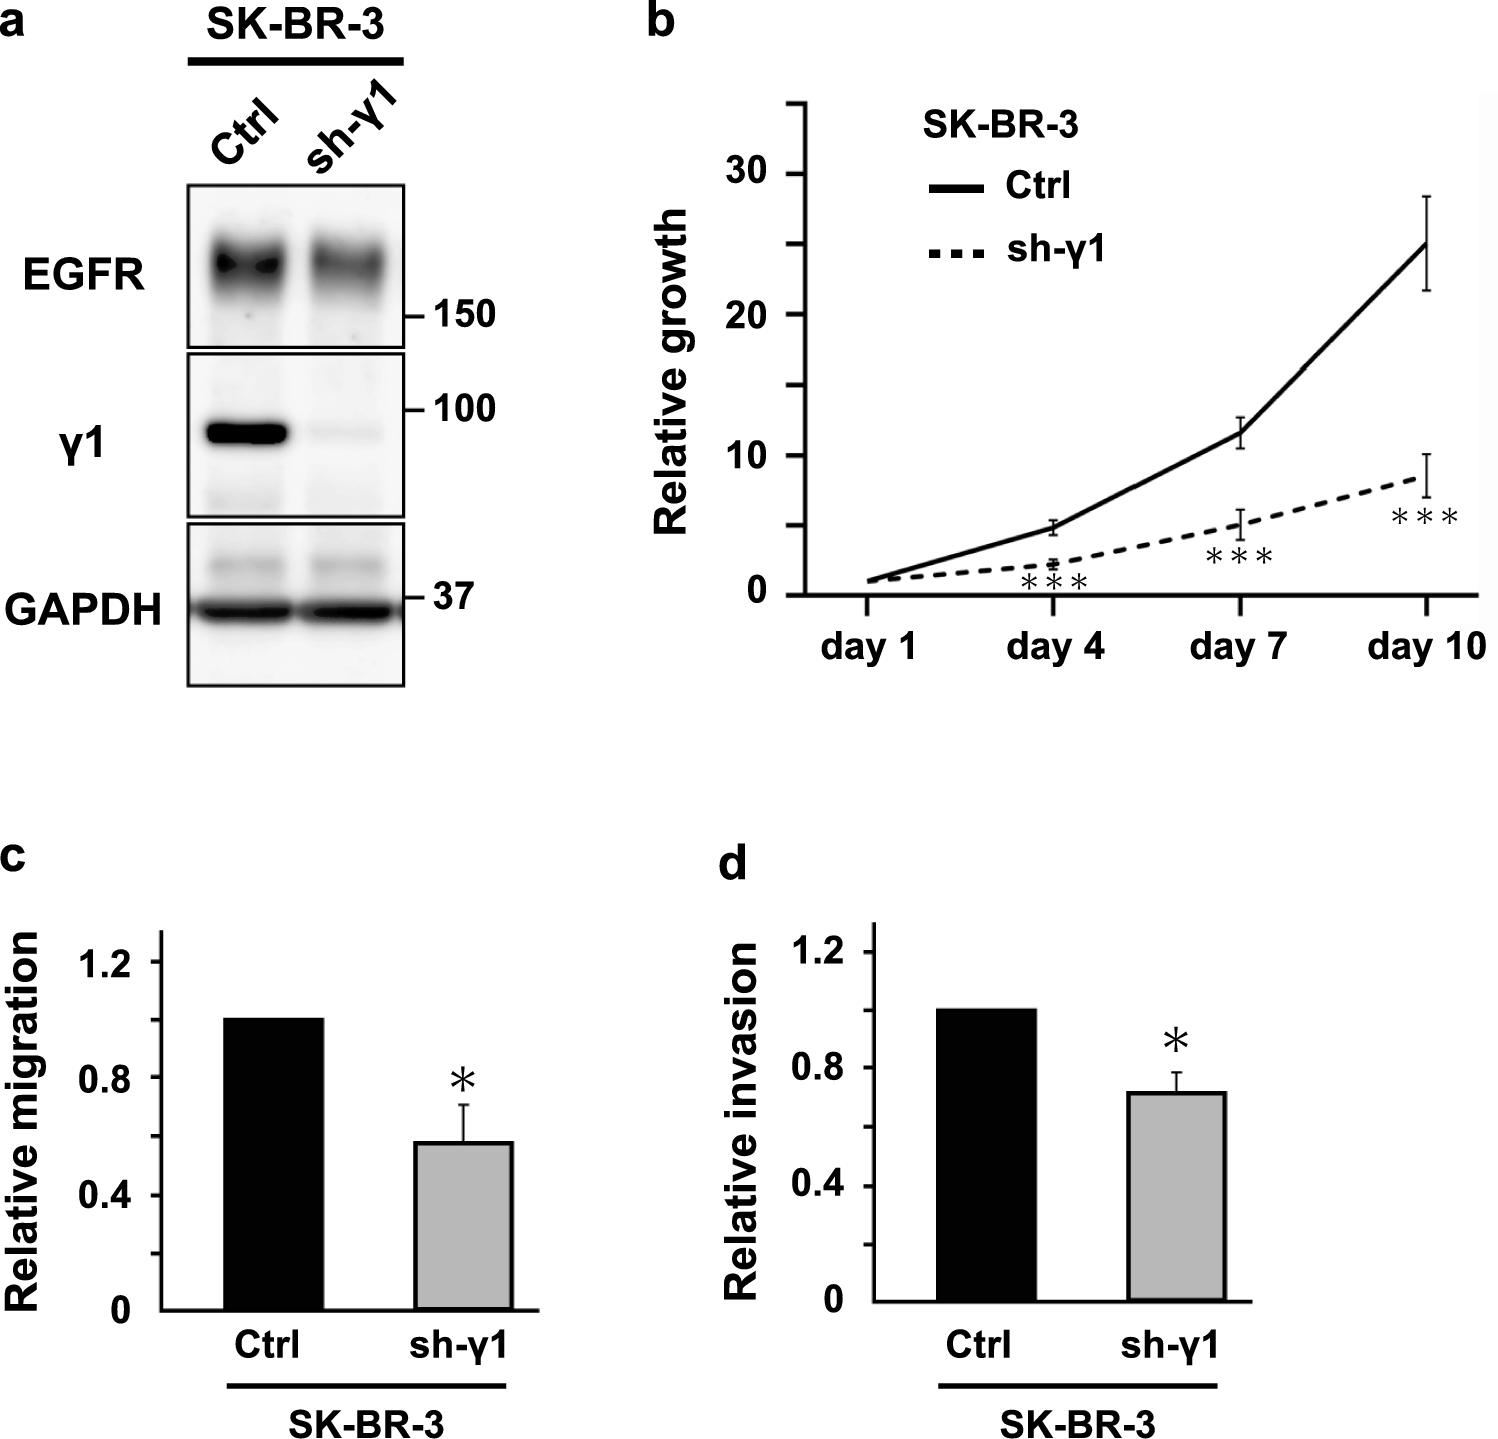
For constitutive knockdown of γ1-adaptin, the pLKO.1 puro vector (Sigma) containing γ1-adaptin shRNA (5ʹ-AGGAAGUUAUGUUCGUGAU-3ʹ) was constructed according to the manufacturer's instructions. Subsequently, HEK293T cells were transfected with γ1-adaptin shRNA vector or pLKO.1 empty vector as a control for 48 h, and virus-containing media were then collected. SK-BR-3 cells were infected with the lentivirus in DMEM containing 10% FBS and 8 μg/ml polybrene for 48 h, and media were replaced with fresh media containing puromycin at concentrations of 3 μg/ml. Following confirmation of knockdown efficiency in Western blotting experiments, the bulk of puromycin-resistant cells was used for in vitro cell growth, migration, and invasion assays.
For a preparation of paraffin-embedded cell pellets, MCF-7 cells were transfected with siRNAs for γ1-adaptin (5ʹ-AGGAAGUUAUGUUCGUGAU-3ʹ) or control siRNA (Silencer Negative Control #1 siRNA [AM4611, Ambion, TX, USA]) using Lipofectamine RNAiMAX Transfection Reagent (Thermo Fisher Scientific, MA, USA) as described previously [20, 21]. Three days later, the cells were fixed with 4% paraformaldehyde and 4% sucrose in 0.1 M PBS for 30 min at room temperature. After being washed three times with 0.1 M phosphate buffer (pH 7.4), they were collected with a scraper, and then embedded in iPGell (Genostaff, Japan) for paraffin embedding.
Western blot analysis
Western blot analysis of tissue samples was conducted as previously reported [20]. Briefly, frozen tissues of breast cancer were homogenized in PBS containing 1% Triton X-100, a protease inhibitor cocktail (Roche), and phosphatase inhibitors (Roche). Lysates were then separated on 5–20% gradient gels (Wako), and were transferred to PVDF membranes (Millipore). After blocking with PBS containing 5% skim milk and 0.1% Tween 20 for 30 min, the membranes were incubated with the primary antibodies against γ1-adaptin antibody (BD Transduction Laboratories [610385]), GAPDH (Santa Cruz Biotechnology [sc-32233]), or EGFR (Cell Signaling Technology [4267]). For signal detection, ECL Prime (GE Healthcare) and ImageQuant LAS 4000 mini (GE Healthcare) were used. The signal intensities of the bands were quantified using Image J, and the values of γ1-adaptin were normalized with those of GAPDH.
Analyses of cell growth, migration, and invasion in vitro
For cell growth assay, cells were seeded on 96-well plates in hexaplicate at 500 cells per well. Cells were allowed to grow for 24 h, and were then cultured for 1, 4, 7, and 10 days. Cell growth assays were performed using Cell Counting Kit-8 (Dojindo) according to the manufacturer’s instructions. OD450 value was measured, and the ratio to the value at day1 was plotted as the means ± SD of three experiments. The statistical differences were analyzed using Student’s t test. For cell migration and invasion assays, CytoSelect™ 24-Well Cell Migration and Invasion Assay (Cell Biolabs, Inc., CBA-100-C, CA, USA) was used according to the manufacture’s instruction. Briefly, cell suspensions containing 1.0 × 10⁶ cells/ml in DMEM were prepared, and 300 μl of each suspension was added to insert chambers that had been placed in 24 well plates. Three-hundred (300) μl of DMEM containing 10% FBS was added to the well with the insert chamber. After 24 h culture, cells were stained with Cell Stain Solution, washed with water, and lysed with Extraction Solution. Cell migration and invasion were quantified at OD 560 nm in a plate reader. The ratio of sh-γ1 to Ctrl was plotted as mean ± SD of three experiments. The statistical difference was analyzed using Student’s t test.
Immunohistochemistry
Sections of 3 µm-thickness were prepared from paraffin-embedded tissue samples from breast cancer patients. After deparaffinization, they were processed for antigen retrieval for 20 min at 98 °C using a microwave processor (MI-77, AZUMAYA, Japan) in 1% immunosaver (Nissin EM, Japan), inactivation of endogenous peroxidase by incubation with 0.3% H2O2 in methanol for 20 min at room temperature, and blocking of nonspecific binding by incubation with 10% goat serum (Jackson ImmunoReseach Inc, PA, USA) for 20 min at room temperature. They were further incubated with anti-γ1-adaptin antibody (BD Bioscience, HJ, USA; 1:1,000 dilution) for 2 days at 4 °C, and then with peroxidase-labeled anti-mouse antibody (Histofine Simple stain MAX-PO (M), Nichirei Biosciences Inc., Japan) for 30 min at room temperature. Peroxidase activity was detected with 0.0125% 3,3ʹ-diaminobendizine and 0.002% H2O2 in 0.05 M Tris–HCl buffer (PH 7.6). After being stained with hematoxylin as nuclear counter staining, they were mounted on glass slides and observed with a microscope (BX51, Olympus, Japan) equipped with a cooled CCD camera system (DP-71, Olympus). For quantification, the nuclear counter staining was omitted, and five reference cases were included in every experiment for data correction between the experiments.
Immunohistofluorescence (IHF) microscopy
Sections of the paraffin-embedded cell pellets and the breast cancer tissues were prepared and processed for antigen retrieval as above. They were processed for IHF as described previously [13]. After being blocked with 10% goat serum for 20 min at room temperature, they were incubated with anti-γ1-adaptin antibody (BD Bioscience; 1:1000) alone for cell pellets, or with a mixture of anti-γ1-adaptin antibody and either rabbit anti-EEA1 antibody (Abcam, Cambridge, UK; 1:200 dilution) or sheep anti-human TGN46 (Bio-Rad Laboratories, Inc., CA, USA, 1:400 dilution) for patient specimens, for 1 day at 4 °C. They were then incubated with Alexa 594-conjugated donkey anti-mouse IgG (1:800 dilution), or a mixture of Alexa 594-conjugated donkey anti-mouse IgG and Alexa 488-conjugated donkey anti-rabbit IgG for 60 min at room temperature. They were observed with a confocal laser microscope (FLUOVIEW FV1000, OLYMPUS, Japan).
Image analysis for quantification
Images of γ1-adaptin-stained specimens by IHC were captured with a virtual slide scanner (Nanozoomer-SQ, Hamamatsu photonics, Japan) equipped with a × 40 lens, which were observed with a piece of software, NDP.view 2 (Hamamatsu photonics, Japan). Quantification was performed using Fiji software (National Institute of Health, MD, USA) according to Okabe et al. [22] with some modifications (Fig. 3a–c). Three ROIs of rectangle areas (198 × 318 µm) containing relatively strong immunoreactivities were selected per specimen. In each ROI, an area mainly containing tumor cells was manually enclosed, and then, stained pixels were extracted by thresholding the intensity. The sum of pixel intensities was then divided by the enclosed area, which was considered the γ1-adaptin intensity of the ROI. The average of the three ROIs was taken as a value of each case. Differences in γ1-adaptin intensity between experiments were corrected by including five identical cases in all experiments as references. For 44 non-cancerous mammary gland tissues, a single ROI was used for quantification.
Statistical analysis
Pearson's Chi-squared test was used for evaluating correlations of γ1-adaptin expression with clinicopathological factors. The Mann–Whitney U test and Steel–Dwass test were used for comparison analyses between the two groups and more than three groups, respectively. Survival analyses were performed using the Kaplan–Meier methods with the log-rank test, and by Cox proportional hazards model. Student’s t test was used for the cell growth, migration, and invasion assays. GraphPad Prism7 (GraphPad Software, CA, USA) and R software were used for all statistical analyses. p values of < 0.05 were considered statistically significant.

留言 (0)