
記住我

Sepsis is one of the leading causes of mortality in Intensive Care Units.[1] With its increasing incidence and high mortality rate, sepsis is a very important public health problem.[2] Patients with sepsis often require more medical resources. In the United States, it is estimated that between $16 billion and $25 billion is spent annually on sepsis-related medical care. Sepsis is a serious threat to human health and a major economic burden to society.[3] Data from previous studies have shown that the incidence of severe sepsis (up to 300 cases per 100,000 adults) is increasing, although mortality has decreased with improvements in medical care.[4] In addition, delays in diagnosis and treatment prolong hospital stays and increase healthcare costs.[5]
Sepsis leads to activation of the coagulation cascade and inflammation. Bacterial products and pro-inflammatory cytokines trigger the coagulation system mainly by inducing tissue factors.[6] In the study by Li et al, it was observed that the coagulation disorder was exacerbated in patients with sepsis, and factor VII, PLT, FDP, and D-dimer may be the independent factors influencing the prognosis of patients with sepsis.[7] The study by Xu et al found that activated partial thromboplastin time on admission to the ICU was an independent predictor of 30-day mortality.[8] In addition, research by Jean-Louis et al supports the conclusion that human recombinant thrombomodulin did not significantly reduce 28-day all-cause mortality in patients with sepsis-associated coagulopathy.[9] In summary, the coagulation cascade may play an important role in the onset and development of sepsis.
Since coagulopathy indicates the severity of sepsis and involves a number of genes, the present study aimed to identify gene co-expression modules in sepsis by WGCNA and to further relate the modules to the coagulation cascade and clinical features based on bioinformatics. The proposed hypothesis is that coagulation-related genes are involved in sepsis and correlate with survival status.
2. Materials and methods 2.1. Clinical data analysisWe identified and collected patients with septic shock caused by intestinal perforation at the First Affiliated Hospital of Zhejiang University School of Medicine, a large academic medical center. Sepsis and septic shock were defined according to the Third International Consensus Definitions for Sepsis and Septic Shock (Sepsis-3). All patients enrolled in the study received surgery and standard medical care according to the latest international guidelines for intensive care management: including fluid resuscitation, anti-infective therapy with antibiotics, support of organ function (mechanical ventilation, continuous renal replacement therapy), and vasoactive drugs. The first day was the day the patient was transferred to the ICU. Patients who survived more than 28 days and left the hospital in good health were considered survivors. The main outcome measure was 28-day mortality after ICU admission.
2.2. Data download and analysis of the weighted gene co-expression networkFirst, we downloaded the GSE28750 dataset[10] from the gene expression omnibus database11 (https://www.ncbi.nlm.nih.gov/geo/). The GSE28750 database[11] contains 20 normal samples and 10 sepsis tissue samples. Second, we calculated the median absolute deviation of each gene and removed the top 50% of genes with the smallest median absolute deviation. The goodSamplesGenes method of the R software package WGCNA was used to remove outlier genes and samples. WGCNA is also used to construct a scale-free co-expression network.[12]
2.3. Gene set enrichment analysisGSEA is a powerful analytical tool that can interpret gene expression data and provide molecular function and pathway enrichment analysis.[13] We performed GSEA analysis on all genes in the data matrix of the GSE28750 dataset using the clusterProfiler package of the R software. Statistical significance was set at P < .05.
2.4. Evaluation and analysis of immune cell infiltrationThe occurrence of sepsis coagulopathy is closely related to the body’s immune system against pathogenic microorganisms.[14] Therefore, to identify the relationship between immune cell infiltration and C3AR1, we uploaded the gene expression matrix data of GSE95233[15] to CIBERSORT. The visualization of 22 immune cell infiltrations in each sample was performed using the ggplot2 package. The ggplot2 package was also used to visualize the correlation between different immune cells and C3AR1, and the differences of immune cells in different C3AR1 expression groups.
2.5. Verification of the clinical correlation of C3AR1Receiver operating characteristic (ROC) curve and Kaplan–Meier (KM) curve were used to investigate the prognostic value of C3AR1 in the GSE65682[16] dataset. To investigate the value of clinical factors and C3AR1 on clinical prognosis, COX analysis was used to analyze the clinical factors of GSE65682.
2.6. Statistical analysisContinuous variables were compared using the Student t test or the Mann–Whitney U test for variables not normally distributed. Survival curves were plotted using the KM method and compared using the log-rank test. Cox regression analysis was used for multivariate analysis. The analysis result of COX in this study was visualized based on the results of multivariate analysis and using the rms package in R version 3.2.5. ROC curves and area under the curve (AUC) were used to compare the prognostic accuracy of different indicators. The most accurate cutoff value was calculated using the Youden index. A value of P < .05 was considered statistically significant in the statistical analysis.
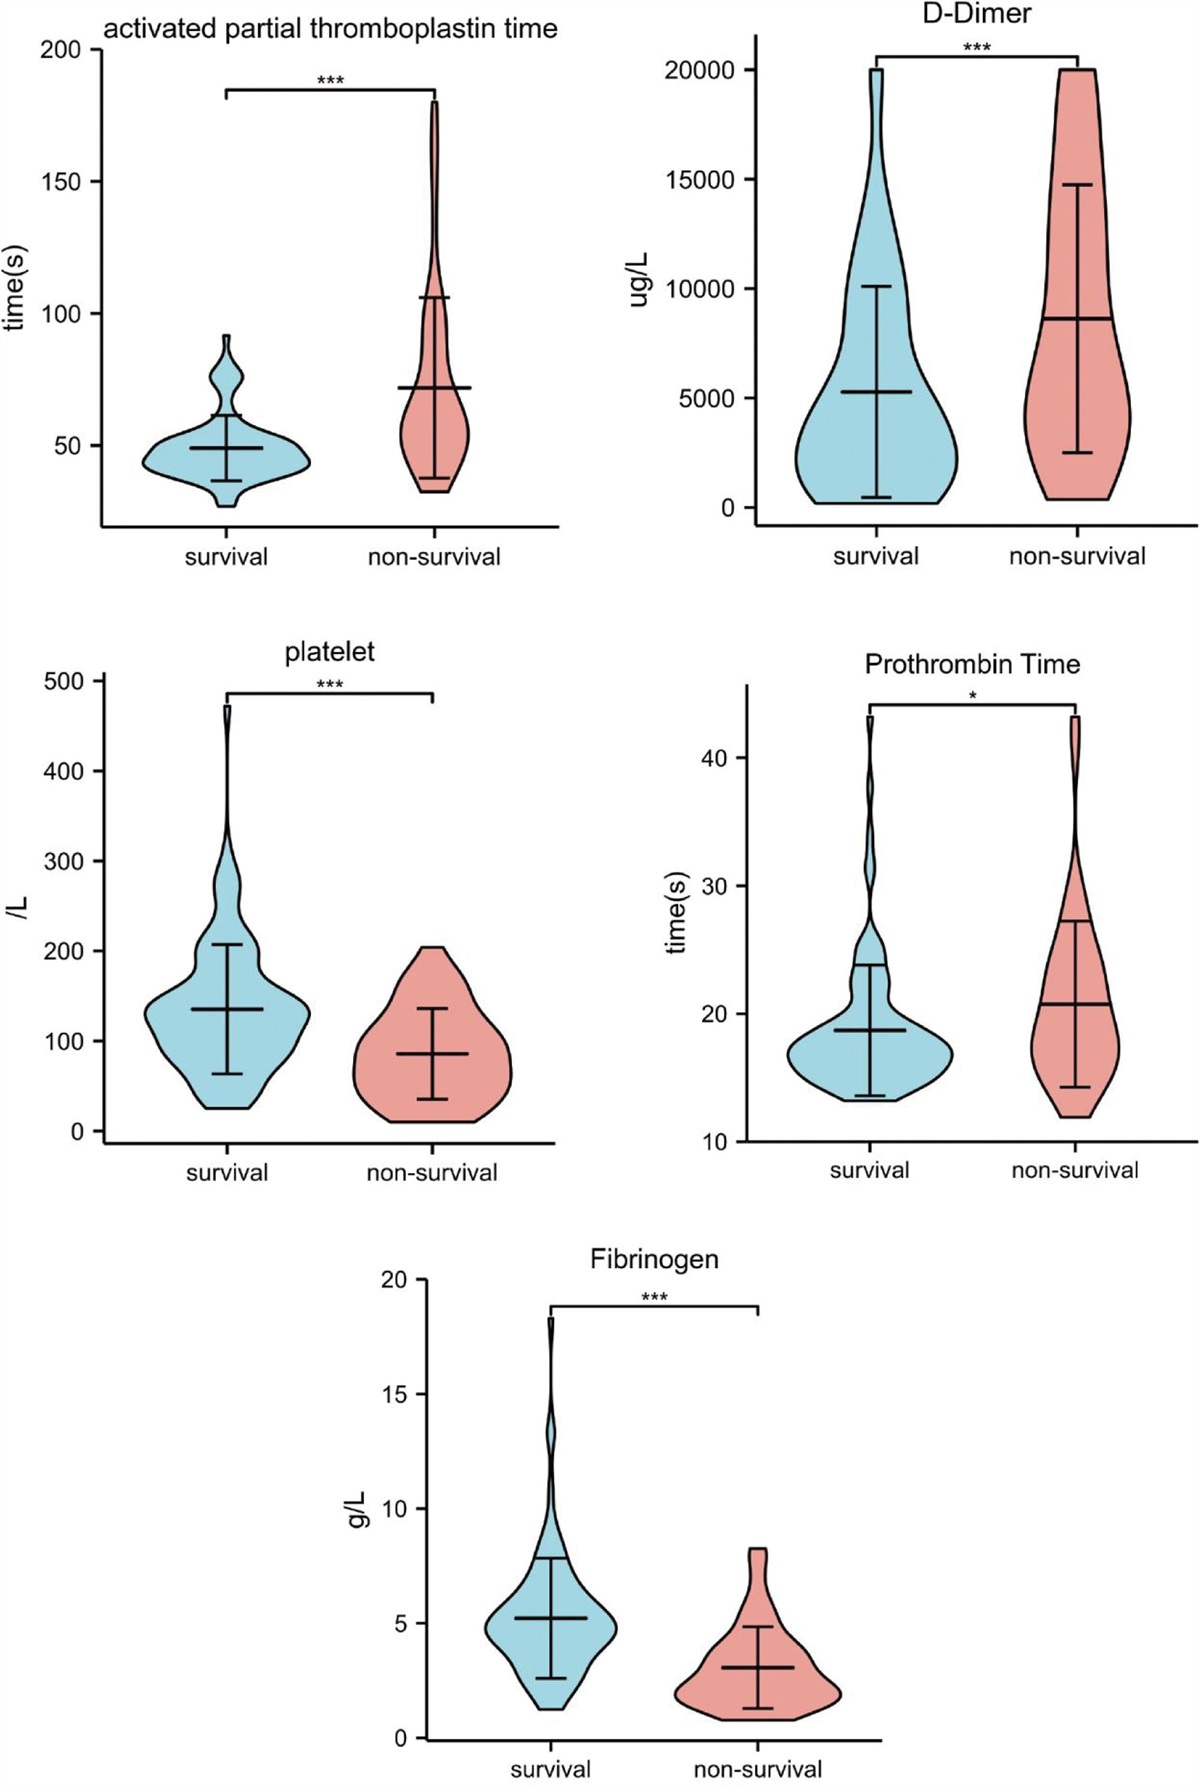
3. Result 3.1. Coagulation-related index comparisonsFrom the medical record system of the First Affiliated Hospital of Zhejiang University School of Medicine, 138 patients with septic shock caused by intestinal perforation requiring emergency surgery were selected. By comparing the activated partial thromboplastin time, D-dimer, platelets, prothrombin time, and fibrinogen, we found a significant difference between the survival and nonsurvival groups (Fig. 1).
 Figure 1.:
 There are differences in coagulation function between sepsis survivors and nonsurvivors. The levels of activated partial thromboplastin time (P < .001), D-dimer (P < .001), platelets (P < .001), prothrombin time (P < .05), and fibrinogen (P < .001) were significantly higher in the nonsurvival group.
3.2. Weighted gene co-expression network analysisβ was a soft-thresholding parameter that could emphasize strong correlations between genes and penalize weak correlations. After choosing the power of 12, the adjacency was transformed into a topological overlap matrix, which could measure the network connectivity of a gene, defined as the sum of its adjacency with all other genes for the network generation, and the corresponding dissimilarity (1-TOM) was calculated. To further analyze the module, we calculated the dissimilarity of the module eigengenes, selected a cut line for the module dendrogram, and merged some modules. In addition, we also merged the modules with a distance <0.25 and finally obtained 20 co-expression modules. It is worth noting that the gray module is considered a set of genes that cannot be assigned to any module. Based on the cutoff criteria (|MM| > 0.8 and |GS| > 0.1), 1176 genes with high connectivity in the clinically significant module were identified as hub genes (Fig. 2).
 Figure 2.:
 Construction and module analysis of weighted gene co-expression network analysis (WGCNA). (A) Network topology analysis under different soft-threshold powers. The x axis represents the soft-threshold power. The y axis represents the fit index of the scale-free topology model. (B) Clustering dendrogram of genes with different similarities based on topological overlap and the assigned module color. (C) Module-trait association. Each row corresponds to a module, and each column corresponds to a feature. Each cell contains the corresponding correlation and P value. This table is color-coded according to the relevance of the color legend. (D) The relevance of members in the module salmon4 and sepsis.
3.3. Identification of coagulation-related hub genesBased on GSE28750, we explored the genes enriched in the coagulation-related signaling pathway by GSEA. Significantly enriched pathways were selected based on NES, FDR q value, and nominal P value. In this study, CR1, F5, CD59, CD55, C3AR1, C1QB, PROS1, C1QA, TFPI, and C1QC were found to be enriched in the coagulation-related signaling pathway (Fig. 3A). The intersection of hub genes and coagulation-related genes, including CR1, C3AR1, and CD59, was visualized by Venn plot (Fig. 3B). In the validation set of the GSE95233 dataset, only C3AR1 shows a significant difference between the sepsis group and the control group. The expression of C3AR1 was higher in the sepsis group than in the normal group (Fig. 3C). Therefore, C3AR1 was selected for further analysis. GSEA analysis showed that C3AR1 was mainly enriched in coagulation and immunity (Table 1). In the GSE95233 data, the area under the ROC curve (AUC) of C3AR1 to significantly discriminate between the normal group and the sepsis group was 0.866 (Fig. 3D).
Table 1 - Pathways and functions associated with C3AR1 in GSEA analysis. Description Set-size Enrichment score NES P REACTOME_INNATE_IMMUNE_SYSTEM 349 0.38748455 2.756 .001091703 REACTOME_NEUTROPHIL_DEGRANULATION 211 0.521415784 3.478 .001132503 WP_HUMAN_COMPLEMENT_SYSTEM 30 0.530371781 2.331 .001526718 WP_COMPLEMENT_AND_COAGULATION_CASCADES 17 0.61577265 2.293 .003252033 KEGG_COMPLEMENT_AND_COAGULATION_CASCADES 16 0.63283666 2.297 .003311258 REACTOME_COMPLEMENT_CASCADE 17 0.575307599 2.142 .008130081 Figure 3.:
 Hub genes of C3AR1 were obtained by the GSEA and WGCNA. (A) The genes enriched in coagulation function were obtained by GSEA analysis. (B) Key genes were selected based on the overlap between the genes enriched in the coagulation cascade and co-expression networks. (C) The volcano map showed the expression of the 3 hub genes in the GSE95233 dataset. (D) The ROC of C3AR1 expression in GSE95233 to discriminate the normal and sepsis groups with an AUC of 0.866.
3.4. Analysis of immune cell infiltrationTo further determine the correlation between C3AR1 expression and immune cells, the proportion of infiltrating immune cells was analyzed using the CIBERSORT algorithm. A map of 22 immune cells was constructed (Fig. 4A). T-cell follicular helper was discarded because no corresponding values were obtained from the analysis of immune cell infiltration. Therefore, the correlation with 21 immune cells was constructed (Fig. 4B). The correlation analysis between C3AR1 and immune cells showed that a total of 14 types of immune cells had significant correlations with C3AR1. T cells gamma delta, plasma cells, monocytes, macrophages M0, neutrophils, and resting mast cells were positively correlated with C3AR1 expression. There was a negative correlation between the expression of B cells memory, macrophages M2, T cells CD4 memory resting, T cells CD8, T cells CD4 naive, B cells naive, dendritic cells resting, NK cells resting, and C3AR1 expression (Fig. 4C). Between the high and low C3AR1 expression groups, activated dendritic cells, M0 macrophages, monocytes, neutrophils, resting NK cells, CD4 naive T cells, and CD8 T cells are quite different (Fig. 4D). These results further support that the level of C3AR1 may regulate the coagulation cascade by influencing the immune activity of immune cells.
 Figure 4.:
 Evaluation of immune cell infiltration and correlation analysis. (A) Bar plot shows the proportion of 22 types of immune cells in sepsis and health samples in GSE95233. The column in the figure is shown as a sample. (B) The correlation heat map of 21 types of infiltrating immune cells. Blue indicates negative correlation and red indicates positive correlation. (C) The lollipop map shows the correlation between C3AR1 and immune cells. Blue represents a lower P value and red represents a higher P value. The right part represents a positive correlation. The left part represents a negative correlation. (D) Twenty-one types of immune cells are expressed at different levels of C3AR1 (low vs high) as box plots. Blue is the low expression group and red is the high expression group.
3.5. Clinical correlation analysisWe found that coagulation abnormalities were prognostic factors in septic patients with abdominal infection from hospital data. The GSE65682 dataset had data on sepsis caused by abdominal infection and the survival time of each patient, so we selected the GSE65682 dataset for the clinical relevance study (Table 1). In the GSE65682 dataset, the area under the ROC curve (AUC) of C3AR1 to significantly discriminate the survival group from the nonsurvival group was 0.800 (Fig. 5A). The 28-day mortality risk in patients with sepsis caused by abdominal infection was calculated according to the cutoff point of C3AR1. KM curve analysis showed that the high C3AR1 group had a significantly higher 28-day mortality than the low C3AR1 group (Fig. 5B). We included age, gender, diabetes, thrombocytopenia, and C3AR1 expression in univariate and multivariate Cox regression analysis. Univariate and multivariate Cox analysis showed that only C3AR1 had a significant correlation with survival (Fig. 5C and Table 2). To explore the predictability of clinical factors on survival, the nomogram was constructed according to the multivariate results (Fig. 5D). Calibration of the nomogram showed that this nomogram was predictable (Fig. 5E).
Table 2 - Basic clinical characteristics of patients with high or low C3AR1 in GSE65682. Characteristic Low expression of C3AR1 High expression of C3AR1 P n 36 17 Thrombocytopenia, n (%) .543 No 35 (66%) 16 (30.2%) Yes 1 (1.9%) 1 (1.9%) ICU-acquired infection, n (%) .099 No 36 (67.9%) 15 (28.3%) Yes 0 (0%) 2 (3.8%) Abdominal sepsis, n (%) <.001 No infection 31 (58.5%) 0 (0%) Sepsis 5 (9.4%) 17 (32.1%) Gender, n (%) .098 Female 13 (24.5%) 11 (20.8%) Male 23 (43.4%) 6 (11.3%) C3AR1 expression, mean ± SD 7.1 ± 0.68 9.24 ± 0.59 <.001 Age, median (IQR) 48 (33.25, 63.75) 64 (56, 71) .010 Figure 5.:
 Clinical correlation analysis of C3AR1. (A) The ROC of C3AR1 expression in GSE65682 to discriminate the survival and nonsurvival groups with an AUC of 0.800. (B) Kaplan–Meier curve analysis showed that the high C3AR1 group had a significantly higher 28-day mortality than the low C3AR1 group. (C) The forest map of the univariate Cox analysis showed that only C3AR1 had a significant correlation with survival. (D) Nomogram plot for multivariate Cox regression analysis. (E) Calibration curve of 28-day survival.
4. DiscussionThe inflammatory storm in sepsis is ultimately responsible for the derangements[17] of the coagulation cascade. Dysregulation of the coagulation cascade in sepsis is characterized by increased coagulation, impaired anticoagulant function, and reduced fibrin clearance. The exacerbation of these dysfunctions leads to microcirculatory thrombosis, with deposition of microclots and obstruction of circulation, which impairs blood flow and contributes to tissue hypoperfusion and consequent organ dysfunction. The clinical data from the hospital also showed that there were differences in coagulation function in the first 24 hours between the nonsurvival group and the survival group. In a previous study, Onishi et al observed that the hemostatic pathological states in sepsis-associated DIC depend on the progression[18] of the disease. Therefore, disorders of coagulation function are closely related to the progression of sepsis. It is important to identify molecules that regulate immune cell infiltration and coagulation cascades during sepsis progression.
This study used WGCNA and GSEA to identify the coagulation-related hub genes in sepsis and related modules. The bioinformatic analysis allowed us to identify C3AR1 as a critical gene in sepsis. In sepsis and septic shock, coagulation is also part of the innate immune system and its local activation has been shown to play an important role in the early host response to infection.[19] During the development of sepsis, monocytes, macrophages, and neutrophils interact with the endothelium to produce cytokines, proteases, and nitric oxide.[20] In addition, activated platelets form complexes with neutrophils and monocytes.[21] Thus, coagulation dysfunction is closely related to the activation of immune cells. In this study, we found that Monocytes, Macrophages M0, and Neutrophils were positively correlated with high C3AR1 expression, suggesting that this subgroup shows immunocompromised microenvironments, consistent with the result of GSEA analysis showed that C3AR1 was associated with innate immune system and neutrophil degranulation (Table 1). The current study also showed that the low C3AR1 subgroup was significantly positively associated with activated immune cells (B cells, CD4 T cells, CD8 T cells, and NK cells), suggesting that low C3AR1 expression was attributable to the immune-activated microenvironment. Therefore, C3AR1 may affect the disorder of coagulation cascade by regulating the infiltration of immune cells. The level of C3AR1 expression efficiently reflected the immune microenvironment during sepsis, which may help guide immune-modulating agents to achieve immune homeostasis.
Previous studies have reported the role of C3AR1 in cancer, neurogenesis, and hormone release.[22] However, studies on C3AR1 in sepsis are rare. Xie et al study have shown that C3AR1 was significantly upregulated in patients with sepsis for the first time.[23] Then, Xu et al had reported that C3AR1 may significantly contribute to the pathophysiology of sepsis.[24] Our findings were consistent with these two studies and showed that C3AR1 may regulate immune cell infiltration to contribute to the pathophysiology of sepsis. In addition, we found a correlation between C3AR1 expression and patient prognosis in the GSE65682 dataset.
There are several limitations to our study. First, the GSE28750, GSE65682, and GSE95233 datasets for this analysis were all from public databases. The samples of these 3 datasets were small, which may lead to a biased interpretation of the results. Second, much larger clinical samples are needed to validate that C3AR1 is associated with prognosis in sepsis caused by abdominal infection. Third, further molecular experiments are needed to confirm whether C3AR1 can regulate immune cell infiltration to influence the dysfunction of the coagulation cascade in sepsis.
5. ConclusionThe present study found that C3AR1 was statistically associated with the coagulation cascade and mortality in sepsis caused by abdominal infection. Related pathways of C3AR1 include dysregulation of the coagulation cascade, inflammation, and immune response, suggesting that C3AR1 may be a potential therapeutic target for sepsis. Indeed, further experimental work on C3AR1 is needed to validate the result of this study.
Author contributionsData curation: Xuanrong Ren.
Formal analysis: Xuanrong Ren.
Funding acquisition: Xuanrong Ren.
Writing—original draft: Xuanrong Ren.
Writing—review & editing: Xuanrong Ren, Qinghui Fu.
Investigation: Qinghui Fu.
Methodology: Qinghui Fu.
Resources: Qinghui Fu.
References [1]. Vincent JL, Rello J, Marshall J, et al.; EPIC II Group of Investigators. International study of the prevalence and outcomes of infection in intensive care units. JAMA. 2009;302:2323–9. [2]. Suberviola B, Castellanos-Ortega A, Gonzalez-Castro A, et al. Prognostic value of procalcitonin, C-reactive protein and leukocytes in septic shock. Med Intensiva. 2012;36:177–84. [3]. Singer M, Deutschman CS, Seymour CW, et al. The third international consensus definitions for sepsis and septic shock (Sepsis-3). JAMA. 2016;315:801–10. [4]. Duman A, Akoz A, Kapci M, et al. Prognostic value of neglected biomarker in sepsis patients with the old and new criteria: predictive role of lactate dehydrogenase. Am J Emerg Med. 2016;34:2167–71. [5]. Coelho FR, Martins JO. Diagnostic methods in sepsis: the need of speed. Rev Assoc Med Bras (1992). 2012;58:498–504. [6]. van der Poll T, Levi M. Crosstalk between inflammation and coagulation: the lessons of sepsis. Curr Vasc Pharmacol. 2012;10:632–8. [7]. Li L, Chen L, Wang H, et al. Clinical correlation between coagulation disorders and sepsis in patients with liver failure. Clin Hemorheol Microcirc. 2022;80:219–31. [8]. Xu Z, Cheng B, Fu S, et al. Coagulative biomarkers on admission to the ICU predict acute kidney injury and mortality in patients with septic shock caused by intra-abdominal infection. Infect Drug Resist. 2019;12:2755–64. [9]. Vincent JL, Francois B, Zabolotskikh I, et al.; SCARLET Trial Group. Effect of a recombinant human soluble thrombomodulin on mortality in patients with sepsis-associated coagulopathy: the SCARLET randomized clinical trial. JAMA. 2019;321:1993–2002. [10]. Sutherland A, Thomas M, Brandon RA, et al. Development and validation of a novel molecular biomarker diagnostic test for the early detection of sepsis. Crit Care. 2011;15:R149. [11]. Clough E, Barrett T. The gene expression omnibus database. Methods Mol Biol. 2016;1418:93–110. [12]. Langfelder P, Horvath S. WGCNA: an R package for weighted correlation network analysis. BMC Bioinf. 2008;9:559. [13]. Subramanian A, Tamayo P, Mootha VK, et al. Gene set enrichment analysis: a knowledge-based approach for interpreting genome-wide expression profiles. Proc Natl Acad Sci U S A. 2005;102:15545–50. [14]. Rubio I, Osuchowski MF, Shankar-Hari M, et al. Current gaps in sepsis immunology: new opportunities for translational research. Lancet Infect Dis. 2019;19:e422–36. [15]. Venet F, Schilling J, Cazalis MA, et al. Modulation of LILRB2 protein and mRNA expressions in septic shock patients and after ex vivo lipopolysaccharide stimulation. Hum Immunol. 2017;78:441–50. [16]. Scicluna BP, Klein Klouwenberg PM, van Vught LA, et al. A molecular biomarker to diagnose community-acquired pneumonia on intensive care unit admission. Am J Respir Crit Care Med. 2015;192:826–35. [17]. Machado FR, Silva E. Coagulation and sepsis. Endocr Metab Immune Disord Drug Targets. 2006;6:175–82. [18]. Onishi T, Ishihara T, Nogami K. Coagulation and fibrinolysis balance in disseminated intravascular coagulation. Pediatr Int. 2021;63:1311–8. [19]. van der Poll T, Herwald H. The coagulation system and its function in early immune defense. Thromb Haemost. 2014;112:640–8. [20]. Mahapatra S, Heffner AC. Septic Shock. StatPearls: Treasure Island, FL; 2022. [21]. Rossaint J, Zarbock A. Platelets in leucocyte recruitment and function. Cardiovasc Res. 2015;107:386–95. [22]. Francis K, Lewis BM, Akatsu H, et al. Complement C3a receptors in the pituitary gland: a novel pathway by which an innate immune molecule releases hormones involved in the control of inflammation. FASEB J. 2003;17:2266–8. [23]. Xie K, Kong S, Li F, et al. Bioinformatics-based study to investigate potential differentially expressed genes and miRNAs in pediatric sepsis. Med Sci Monit. 2020;26:e923881. [24]. Xu C, Xu J, Lu L, et al. Identification of key genes and novel immune infiltration-associated biomarkers of sepsis. Innate Immun. 2020;26:666–82.
留言 (0)