
Remember me

Randomized controlled trials (RCTs) are considered the gold standard for evaluating interventions because of their ability to minimize or avoid bias.[1,2] Recent methodological analyses have indicated that insufficient reporting and design are associated with biased estimates of the treatment effects. Such systematic errors are seriously damaging to RCTs, and misleading readers and investigators not to judge the reliability and validity of trial findings or obtain information.[3] Critical appraisal of the quality of clinical trials is only possible if the design, conduct, and analysis of RCTs are thoroughly and accurately described in the report. Far from being transparent, RCT reporting is often incomplete, with compounding problems arising from poor methodologies.[3,4]
The Consolidated Standards of Reporting Trials (CONSORT) statement was first published in 1996 and revised in 2001 and 2010. It consists of a checklist and flow diagram that can be used to report an RCT.[3,5] The CONSORT statement facilitates critical appraisal and interpretation of RCTs. The update of CONSORT guidelines is an extremely solid set of standards for reporting clinical trials. More than 400 leading general and specialty journals and biomedical editorial groups have provided official support for CONSORT.[3]
Pituitary adenomas (PAs), which account for 15% of diagnosed intracranial neoplasms, are usually classified as functioning or nonfunctioning adenomas. The critical location, mass effects, and hormone hypersecretion sustain PAs with significant morbidity and mortality.[6] Trans-sphenoidal surgical resection of tumors represents the first-line treatment for most tumor types, except for prolactinomas, where medical therapy with dopamine agonists is preferred. For most functional adenomas, multimodal therapy controlling hormone secretion and adenoma growth leads to improved quality of life and decreased mortality, and most patients usually require lifelong drug treatment.[7] The options for medical therapy for patients depend on cell type, hormone secretory activity, and growth behavior.[8] Several emerging, novel, medical treatments for acromegaly, Cushing disease, and prolactinomas are in phase II and III clinical trials and may become effective additions to the current drug armamentarium.[9,10]
Refractory PAs are defined as aggressive–invasive PAs characterized by rapid growth, frequent recurrence, and resistance to standard therapeutic approaches.[9,11] These patients with refractory PAs often require continued therapy including medical therapy, radiotherapy, and reoperation. Unfortunately, these patients do not respond to traditional treatments and have very poor prognoses.[12] Recently, temozolomide (TMZ) has shown moderate efficacy for the treatment of refractory PAs.[13,14] Moreover, targeted therapies such as antiepidermal growth factor receptor, antivascular endothelial growth factor, and inhibitors of the mammalian target of rapamycin (mTOR) signaling pathway have also been used to treat refractory PAs. Cancer immunotherapy is a promising treatment option for patients with refractory PAs.[15–17]
Therefore, it is crucial to evaluate the reporting quality of RCTs on pharmacotherapy in PAs because insufficiently reported RCTs may mislead clinical practice. This study aimed to assess the overall reporting quality of published RCTs on medical therapy for PAs, based on the 2010 CONSORT statement.
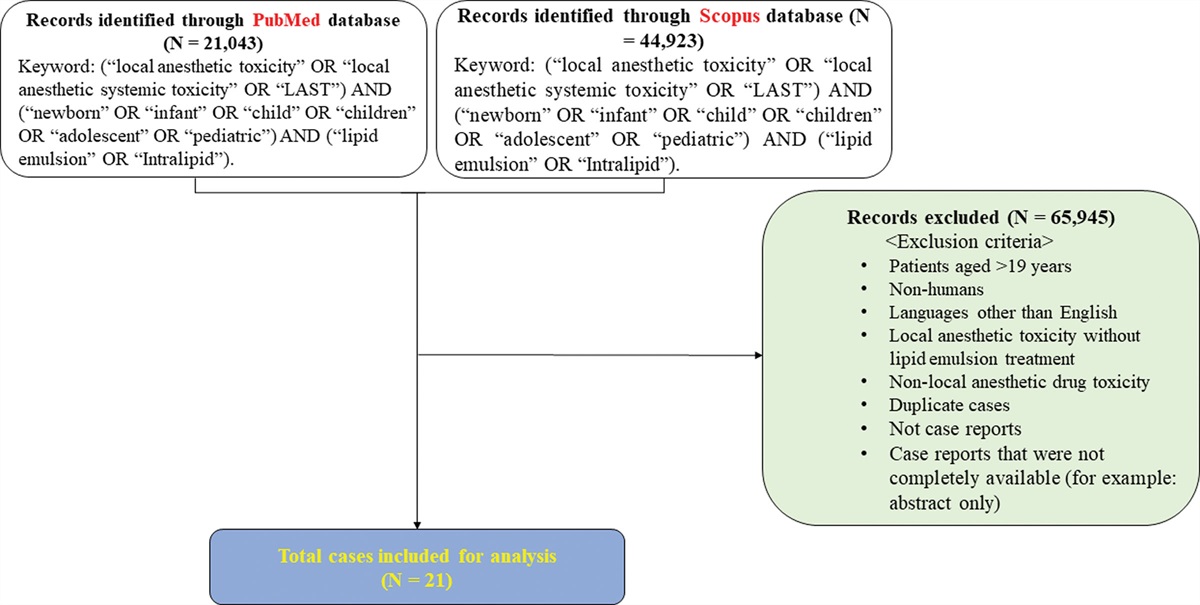
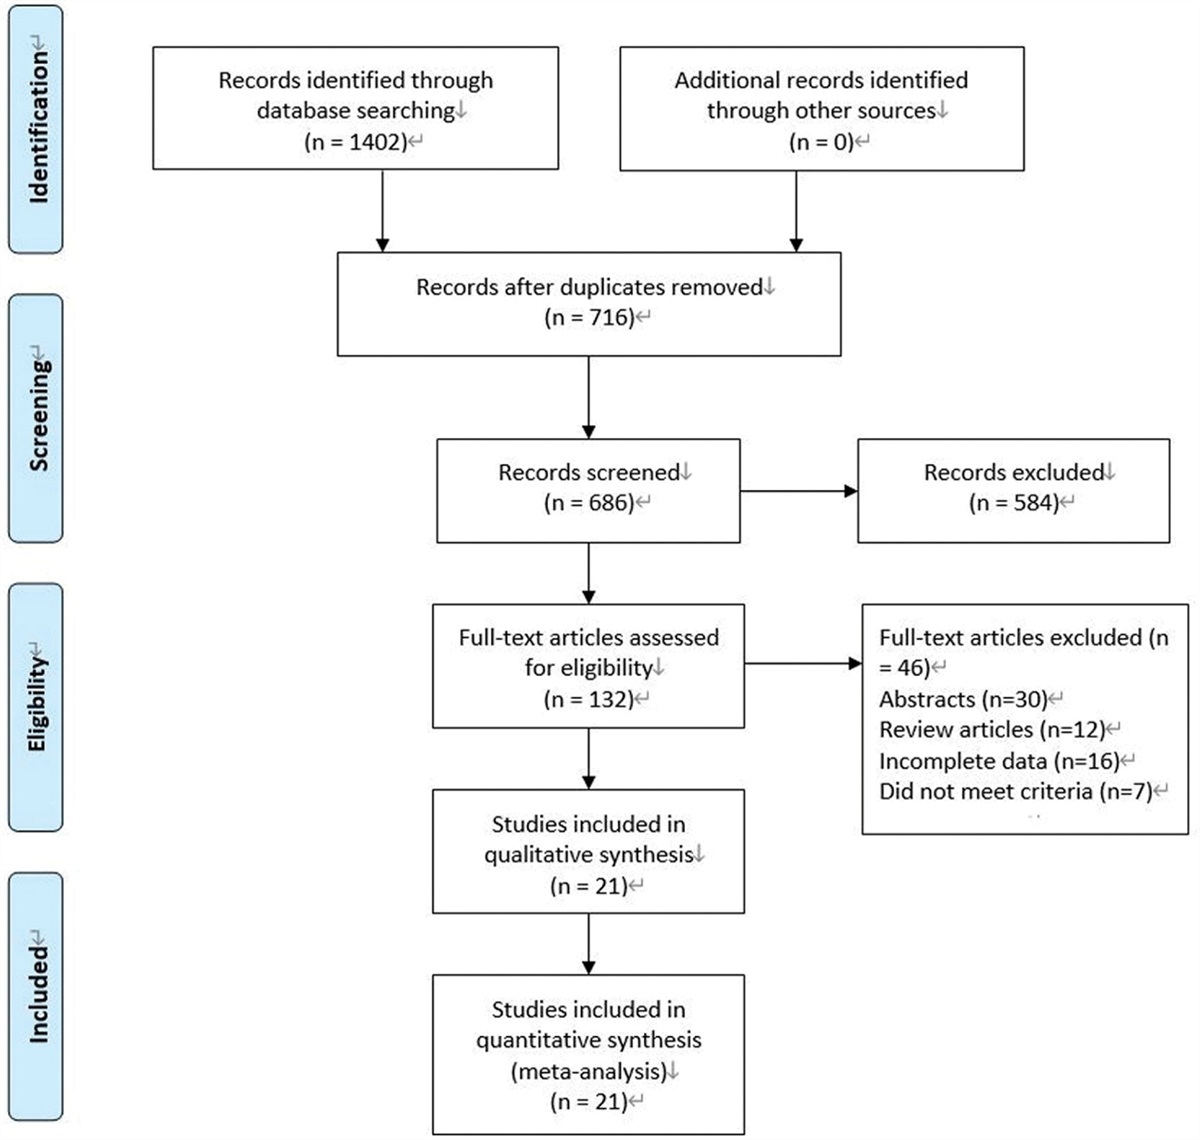
2. Methods and materials 2.1. Trial selectionWe searched PubMed/MEDLINE (http://www.pubmed.gov) to include all RCTs examining pharmacotherapy for PAs published in English between January 1, 1974, and December 31, 2022 (Fig. 1). The search was performed using the terms (“pituitary adenomas” “randomized controlled trials,” and “pharmacotherapy”) OR (“pituitary adenomas” “randomized controlled trials,” and “medical”) OR (“pituitary adenomas” “randomized controlled trials,” and “drug”) OR (“pituitary adenomas” “randomized controlled trials,” and “medicines”) OR (“pituitary tumors” “randomized controlled trials,” and “medicine”) OR (“pituitary tumors” “randomized controlled trials,” and “medication”) OR (“pituitary tumors” “randomized controlled trials,” and “pharmaceutical”).
 Figure 1.:
 Flow diagram of selection process of randomized controlled trial (RCT) articles. Abbreviations: RCT = randomized controlled trial.
The reporting quality of the included RCTs was assessed using the overall quality score (OQS),[18] consisting of modified 28 items based on the 2010 CONSORT statement (Table 1). The CONSORT explanation and elaboration documents were used for guidance.[3,19] Each item was scored as follows: 1 point when adequately reported, 0 when either inadequately reported or absent, and not applicable, according to certain features of the studies.
Table 1 - Overall quality of reporting: rating using modified items based on the 2010 CONSORT statement (n = 27). Item Criteria Description No. of trials in which item was correctly reported % 95%CI 1 Title Identification as a randomized trial in the title 3 11 (0, 23) 2 Abstract structure Structured summary of trial design, methods, results and conclusions 17 63 (45, 81) 3 Background Adequate description of the scientific background and explanation of rationale 27 100 4 Objectives Description of the specific objectives or the scientific hypotheses in the introduction 27 100 5 Trial design Description of trial design, including allocation ratio 8 30 (12, 47) 6 Participants Description of the eligibility criteria for participants 27 100 7 Settings and location Description of the settings and locations where the data were collected 7 26 (9, 43) 8 Interventions Details of the interventions intended for each group 27 100 9 Outcomes Definition of primary and secondary outcome measures, including how and when they were assessed 27 100 10 Sample size Description of sample size calculation 1 4 (0, 11) 11 Randomization, sequence generation Definition of the method used to generate the random allocation sequence 6 22 (7, 38) 12 Randomization, restriction Description of the type of randomization; details of any restriction 4 15 (10, 28) 13 Allocation concealment Description of the mechanism used to implement the random allocation sequence to assure concealment until interventions were assigned 1 4 (0, 11) 14 Implementation Description of who generated the random allocation sequence, who enrolled participants, and who assigned participants to interventions 1 4 (0, 11) 15 Blinding Whether or not participants, those administering the interventions, or those assessing the outcomes were blinded to group assignment; if relevant, description of the similarity of interventions 18 67 (49, 84) 16 Statistical methods Description of the statistical methods used to compare groups for primary and secondary outcomes 25 93 (83,100) 17 Ancillary analysis, method Description of the methods for additional analyses, such as subgroup analyses and adjusted analyses 1 4 (0, 11) 18 Diagram A CONSORT diagram was presented to show the flow of participants 1 4 (0, 11) 19 Participant flow Details on the flow of participants through each stage of the trials (number of patients randomly assigned, receiving intended treatment, and were analyzed for the primary outcome) 13 48 (29, 67) 20 Recruitment Dates defining the periods of recruitment and follow-up 18 67 (49, 84) 21 Baseline data A table showing baseline demographic and clinical characteristics for each group 14 52 (33, 71) 22 Intent-to-treat analysis Number of patients in each group included in each analysis and whether patients were analyzed according to the group to which they were randomly assigned 2 7 (0, 17) 23 Outcomes measures For each primary and secondary outcome, a summary of results for each group, the estimated effect size and its precision (e.g., 95%CI) are provided 8 30 (12, 47) 24 Ancillary analyses Results of subgroup analyses and adjusted analyses, distinguishing prespecified from exploratory 1 4 (0, 11) 25 Adverse event classification Description of all important adverse events in each group, with classification 18 67 (49, 84) 26 Registration Presentation of the registration number and name of trial registry 4 15 (10, 28) 27 Protocol Where the full trial protocol can be accessed 3 11 (0, 23) 28 Funding Sources of funding and other support 16 59 (41, 79)The data for each publication were reviewed and extracted by 2 well-trained investigators. They independently screened the abstracts and full texts of each RCT. For the final included articles, 2 independent investigators read the full text and extracted the data in a standardized form. Any discrepancy between the 2 investigators was resolved by discussion to reach a consensus and adjudication by a third investigator, if necessary.
As the purpose of this analysis was to explore the effect of drug therapy on PAs, research factors unrelated to drug therapy, such as surgery, radiotherapy, and marker studies, were excluded. Articles with a history of surgery or radiotherapy were also excluded. Moreover, this study excluded pediatric participants and animal studies.
2.2. Data acquisitionA detailed assessment of key methodological factors and adverse events was conducted.[20] We also extracted the characteristics that seemed relevant to further evaluate the quality of RCTs, such as the date of publication, the continent where the trial was conducted, the journal in which the article was published and its impact factor in 2022, the phase of the trial (II or III), the intervention (e.g., single medical therapy, comparison of 2 medical therapies, etc), and the number of enrolled patients.
2.3. Statistical analysisDescriptive statistics such as the median, extreme, mean, and standard deviation were used to summarize the OQS. Frequency, percentage, and 95% confidence interval were used for quantitative data. Statistical comparisons were performed using the chi-square test or Fisher exact test for categorical data, and the Student t test or the Mann–Whitney U test for continuous variables. A parametric analysis of variance (ANOVA) or a nonparametric Kruskal–Wallis test was performed to analyze qualitative vs quantitative variables. All variables that were significant at the 5% level in the univariate models were included in the multivariate linear regression model. A forward, stepwise selection model was used to assess the final model.
3. ResultsThe process was performed in the steps, as shown in the flow diagram (Fig. 1). A total of 172 articles were retrieved from the initial search. After title and abstract evaluation, 71 titles that were not directly related to PAs were removed at the screening stage. 56 articles that were unrelated to drug therapy for PAs, such as surgery, radiotherapy, and marker studies, were also excluded at this stage. After the full text evaluation, 18 articles were ultimately excluded. We reported the reasons for the exclusion of these 18 articles (Supplemental Table 1, https://links.lww.com/MD/L906). Finally, 27 articles, including 1816 patients, were included in the qualitative analysis.
The ratings, according to the 2010 OQS, are listed in Table 1. The median OQS score was 12 (range, 6–19) on a scale of 0 to 28. The frequency of adherence to the individual criteria is shown in Table 1. Important items, such as background, objectives, participants, interventions, and outcomes, were sufficiently reported in 100% (27/27) of the articles. Statistical methods were adequately described in 93% (25/27) of patients.
However, a few items were reported in only a small percentage of articles. The RCTs underreported identification as randomized trials in the title (3/27; 11%; 95%CI 0–23), sample size, allocation concealment, implementation, ancillary analysis method, Diagram and Ancillary analyses (1/27, 4%; 95%CI 0–11).
The numbers and percentages of CONSORT items reported in each article are shown in Figure 2. The mean CONSORT compliance score was 43% (21%–68%). Nine articles had a CONSORT compliance of >50%.
 Figure 2.:
 The number of CONSORT items reported in each article. Abbreviations: OQS = overall quality score.
Among the key methodological factors, allocation concealment was insufficiently reported by 4% (1/27) of the articles, and only 7% (2/27) of the trials mentioned the intention-to-treat (ITT) analysis. Blinding was not reported in 37% of articles (Table 2).
Table 2 - Key methodological factors. Key methodologic factors No. of trials in which item was correctly reported % Methods of allocation concealment Centralized randomization 1 4 Opaque, sealed, and sequentially numbered envelopes 0 0 Numbered drug containers 0 0 Not mentioned 26 96 Blinding Participating patients 16 59 Treating physicians 8 30 Outcome assessors 6 22 Statistician 2 7 Not mentioned 10 37 ITT Application of ITT 2 7 Stated analyzed following ITT but did not include all randomized patients 0 0 Not mentioned 25 93ITT = intention-to-treat.
The characteristics of the included studies are summarized in Table 3. Most studies were conducted in Europe and North America (n = 24, 89%), while 22% (n = 6) were conducted in Asia. The studies were published in 1974 to 2000 (n = 13,48%), in 2000 to 2010 (n = 9, 33%), and in 2011 to 2022 (n = 5, 19%). The impact factor of most articles was <10 (n = 23, 85%), and that of only 15% (n = 4) was more than 10.
Table 3 - Trial characteristics. Trial characteristics No. of studies (n = 27) % Year of publication 1974 to 2000 13 48 2001 to 2010 9 33 2011 to 2022 5 19 Region in which trials were conducted Asia 6 22 Europe and North America 24 89 Others 4 15 Journal Clin Endocrinol (Oxf) 8 30 J Clin Endocrinol Metab 7 26 Other journals 12 44 Journal impact factor <4 13 48 4 to 10 10 37 >10 4 15 Phase 2 2 7 3 2 7 Unclear 24 89 Intervention Single medical therapy vs placebo 17 63 Comparison of 2 medical therapies 8 30 Others 2 7 Sample size <100 17 63 100–200 9 33 >200 1 4The adverse event reporting scores based on the CONSORT statement for harm are shown in Table 4. The median adverse event reporting score was 3 (range 0–9) on a scale of 0–12. Adverse events were infrequently reported in these studies.
Table 4 - Adverse event reporting score. Article section Item Description No. of trials in which item was correctly reported % 95%CI Title/Abstract 1 Title or abstract states whether adverse events are addressed in study 9 33 (16, 51) Purpose/Introduction 2 Introduction states whether benefits and adverse events are addressed in study 8 30 (12, 47) Methods 3 Article specifies whether all recorded events or a selected sample of adverse events were reported 15 56 (37, 74) 4 Article specifies instrument/scale utilized to categorize adverse events 10 37 (19, 55) 5 Article specifies time frame of surveillance for adverse events 8 30 (12, 47) 6 Article specifies whether recurrent events in the same patient are counted as separate or single events 0 0 Results 7 Article reports reasons for treatment discontinuation 9 33 (16, 51) 8 Article reports whether deaths related to adverse events occurred 5 19 (39, 33) 9 Article specifies which patients were evaluable for toxicity (providing the denominators) 3 11 (0, 23) 10 Article reports absolute numbers of adverse events 18 67 (49, 84) 11 Article does not only report adverse events observed above a certain frequency or rate threshold 0 0 12 Article does not combine adverse events of varying severity 9 33 (16, 51)CI = confidence interval.
Univariate analysis of characteristic factors associated with OQS showed that the OQS of published RCTs was significantly higher when publications were published after 2010 (P = .012). The mean OQS was also higher in RCTs that enrolled > 100 patients (14 vs 11; P = .013) (Table 5). The multivariate final model showed significant associations between higher OQS and publication after 2010 and enrollment of more than 100 patients (Table 6).
Table 5 - Univariate analysis of characteristics factors associated with OQS. Characteristics n (%) CONSORT score: mean (min–max) P value Date of publication .012 Before 2010 20 (74.0) 11 (6–19) Since 2010 7 (26.0) 15 (10–19) Region in which trials were conducted .443 Asia 2 (7.4) 15 (13–16) Europe 14 (51.8) 11 (6–17) North America 3 (11.2) 10 (8–13) Worldwide 7 (25.9) 14 (8–19) Others 1 (3.7) 10 (10–10) Journal impact factor .866 <10 23 (85.2) 12 (6–19) ≥10 4 (14.8) 12 (8–15) Phase .893 II 1 (3.7) 9 (9–9) III 2 (7.4) 15 (13–16) Unclear 24 (88.9) 12 (6–19) Intervention .200 Single medical therapy vs placebo 17 (62.9) 11 (6–17) Comparison of 2 medical therapies 10 (37.1) 13 (9–19) Others – Sample size .013 <100 17 (62.9) 11 (6–16) ≥100 10 (37.1) 14 (9–19)CONSORT = Consolidated Standards of Reporting Trials; OQS = overall quality score; min = minimum; max = maximum.
Comments (0)