
記住我
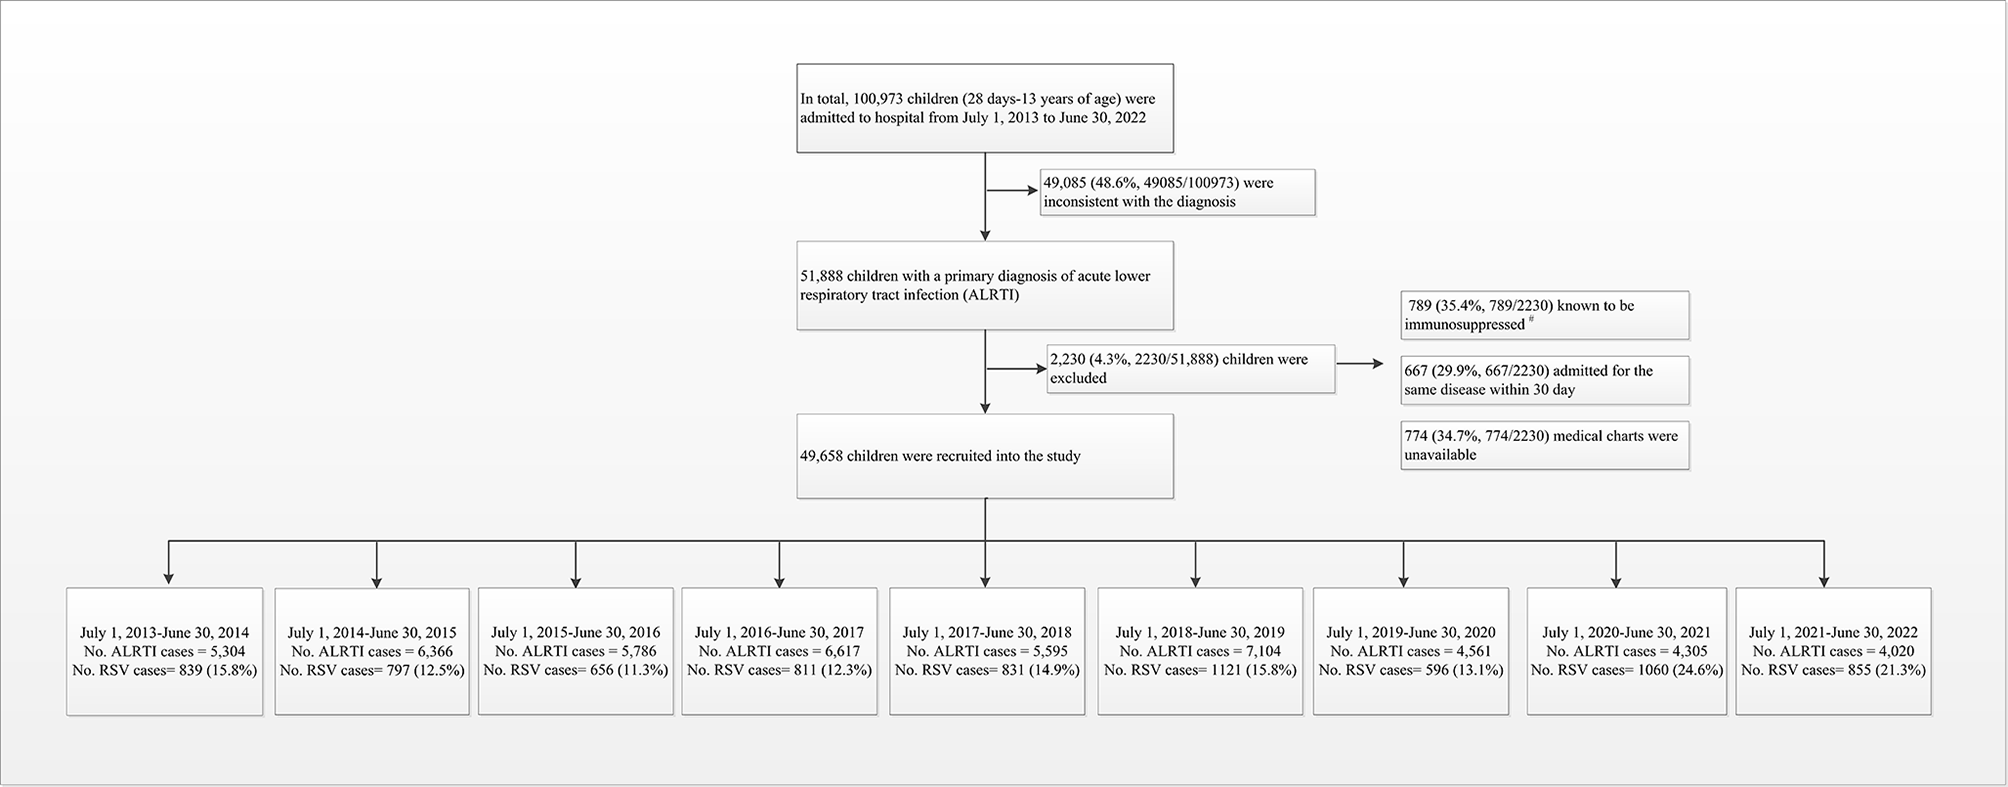
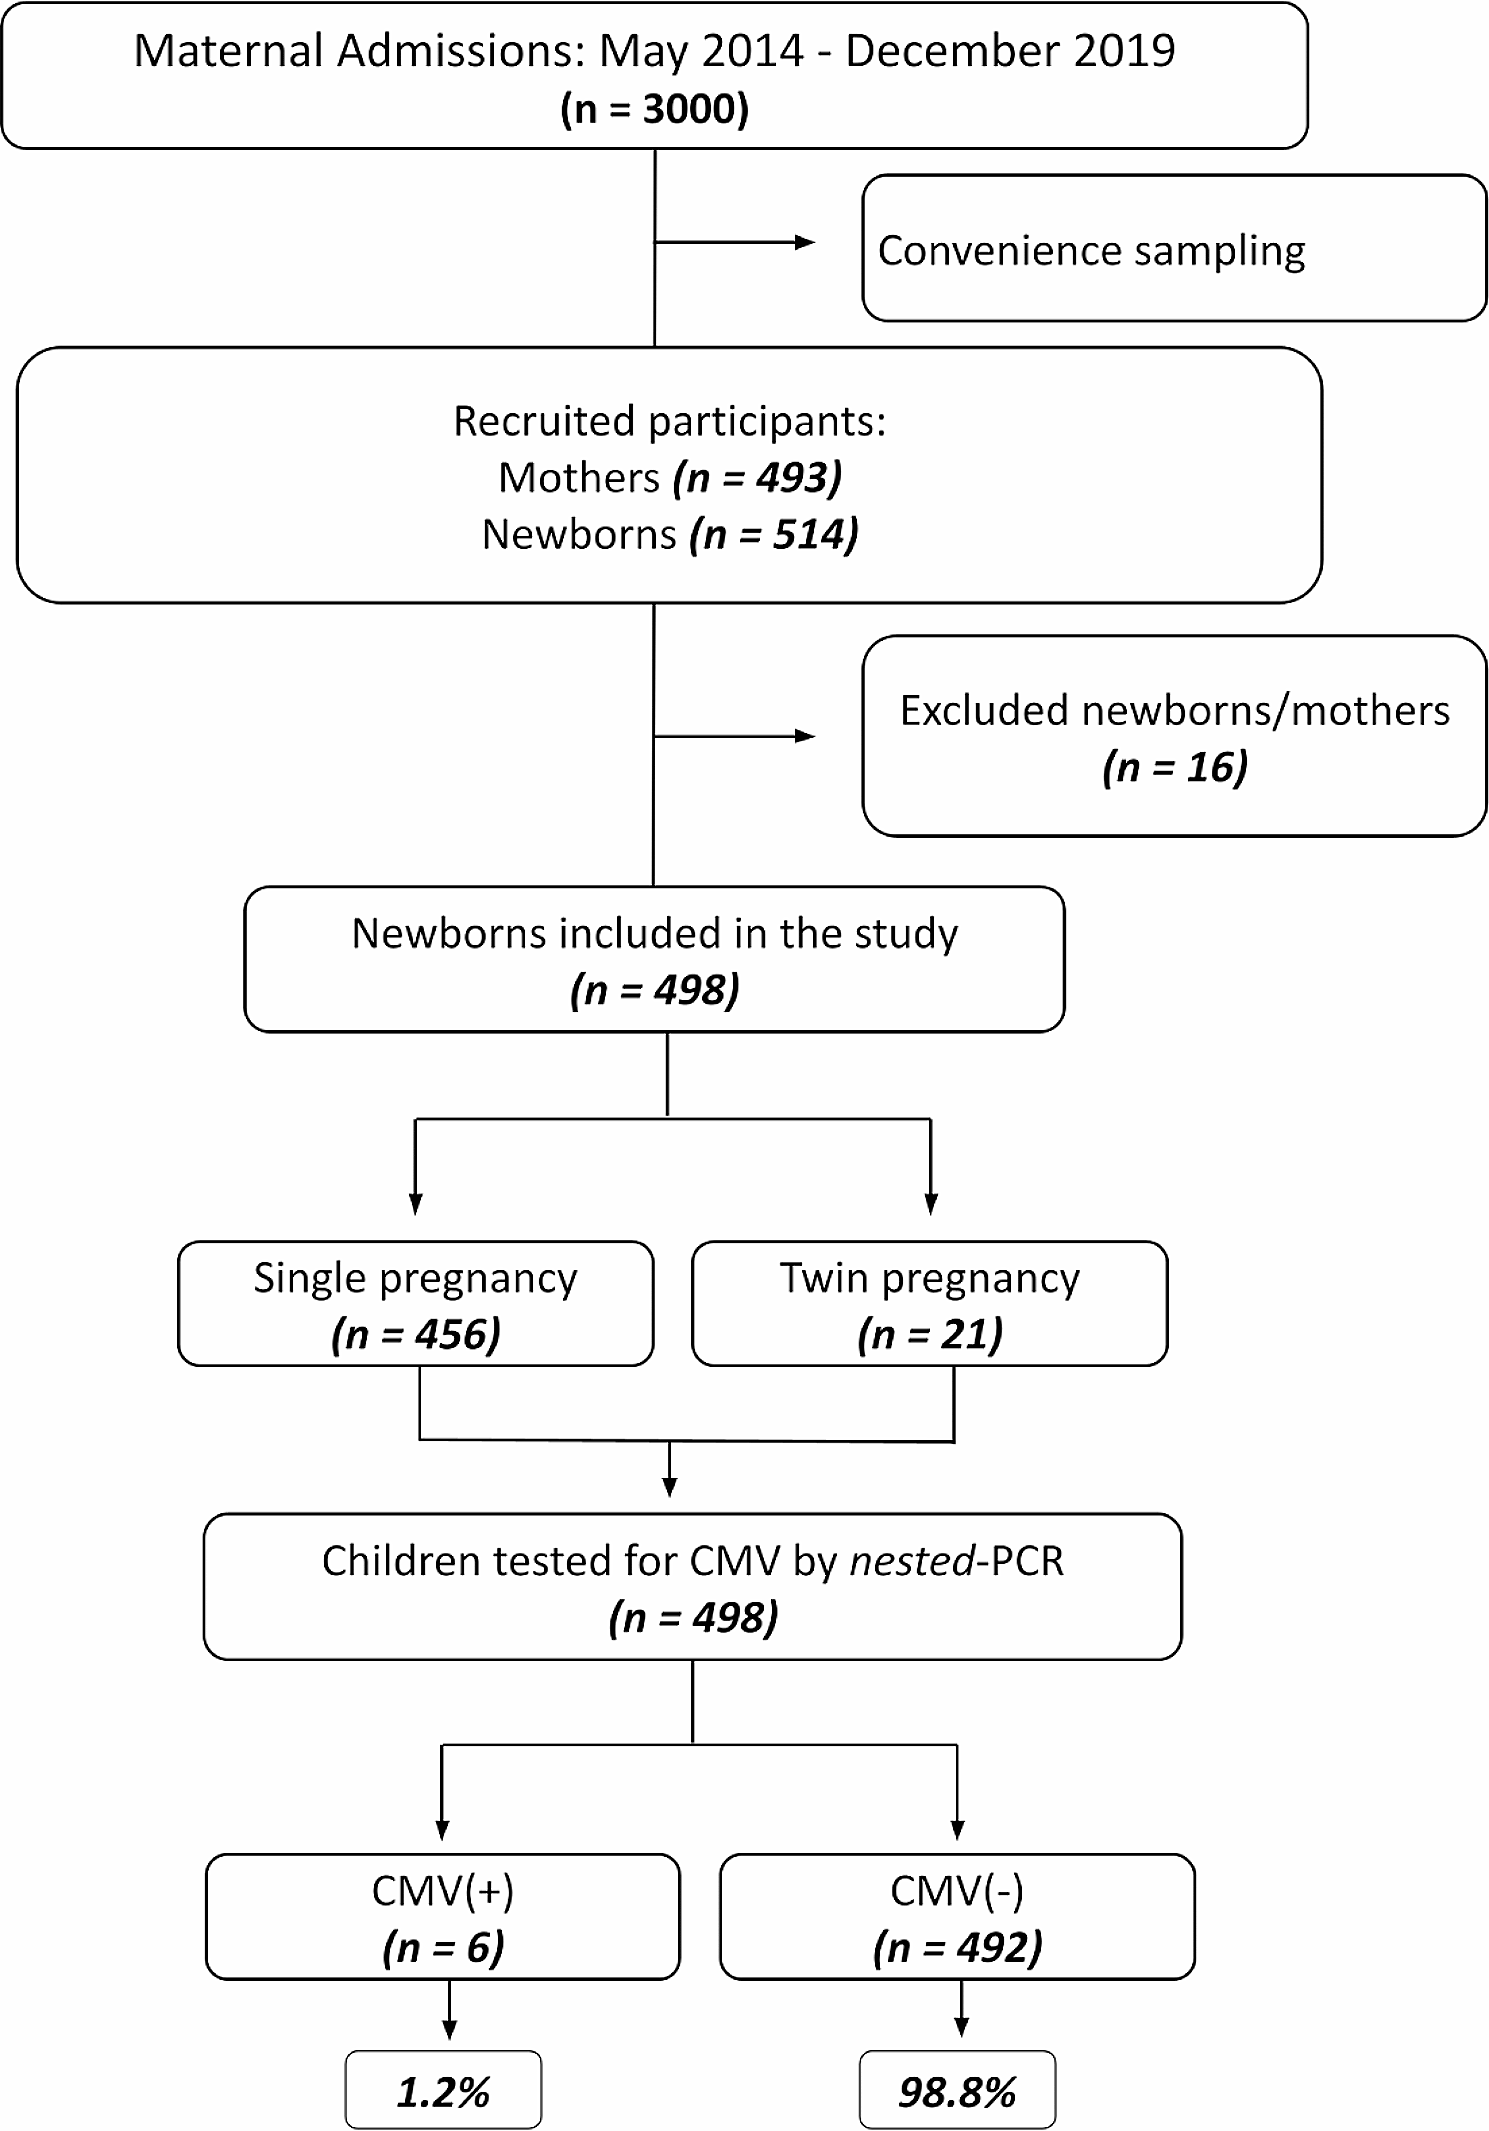


Between July 1, 2013, and June 30, 2022, 49,658 hospitalized children diagnosed with ALRTI were included in the study (Fig. 1). Among them, 30,413 were males (61.2%) and 19,245 were females (38.8%), with a male-to-female ratio of approximately 1.6:1. The age range of the children was 1–168 months, with a median age of 16 months (interquartile range [IQR]: 6–38 months). Children aged < 5 years constituted 90.2% of the study sample. The median length of hospital stay was 6 days (IQR: 5–8 days), and the median cost of hospitalization was 961 dollars (IQR: 770–1,318 dollars). A significant decline in the number of hospitalized ALRTI patients occurred after the severe acute respiratory syndrome coronavirus 2 (SARS-CoV-2) outbreak in China in February 2020, coupled with the implementation of non-pharmaceutical interventions (NPIs). In February, March, and April 2020, there were 52, 56, and 39 ALRTI-related hospitalizations, compared to 659, 744, and 660 cases in the corresponding months in 2019, respectively. This marked a decrease of 92.1%, 92.4%, and 94.1%, respectively. During 2019–2020, 2020–2021, and 2021–2022, the number of ALRTI hospitalizations decreased significant (P < 0.01) compared to 2018–2019, with reductions of 36%, 39%, and 43%, respectively (Table 1).
Fig. 1
Flow chart for the enrollment of pediatric ALRTI inpatients for detection of RSV in July 1, 2013 - June 30, 2022 study. #: immunosuppressed was defined as having received a solid organ or hematopoietic stem cell transplant, undergoing chemotherapy, having a history of human immunodeficiency virus, or using steroids for > 30 days. Abbreviation: ALRTI, acute lower respiratory tract infection; RSV, respiratory syncytial virus
Table 1 Demographic characteristics of hospitalized children with pneumonia, Hunan, China, July 1, 2013-June 30, 2022Clinical and epidemiological characteristics of RSV-positive casesThe RSV antigen-positive rate was 15.2% (n = 7,566/49,658), with 4,805 cases among boys and 2,761 among girls. The median age of RSV-positive patients was 9 months (IQR: 4–20 months), with 33.8% (n = 2,556/7,566) of the patients aged < 6 months, and the RSV-positive rate gradually decreased with increasing age. Among RSV-positive patients, 16.3% (n = 1,236/7,566) presented with a concurrent disease or condition upon admission. The most common conditions included prematurity (n = 523/7,566; 6.9%), congenital heart disease (n = 356/7,566; 4.7%), asthma (n = 220/7,566; 2.9%), anemia (n = 97/7,566; 1.3%), chronic lung disease (n = 28/7,566; < 1%), and malnutrition (n = 12/7,566; < 1%) (Table 2). The RSV-positive rate also declined significantly after the SARS-CoV-2 outbreak in China in February 2020. In February, March, and April 2020, there were 12, 3, and 0 RSV-positive cases, compared to 221, 145, and 38 cases, in 2019, respectively, marking decreases of 94.6%, 97.9%, and 100%, respectively (Table 2; Figs. 2 and 3). The epidemiology of the other virus infection in the enrolled patients was present in supplementary Table 1. Other virus co-infections with RSV were present in supplementary Table 2.
Table 2 Demographic characteristics of RSV positivity children hospitalized with acute lower respiratory tract infection in Hunan, China, July 1, 2013–June 30, 2022Fig. 2
Cases of ALRTI in hospitalized children 28 days–13 years of age, by month, Hunan, China, July 1, 2013 - June 30, 2022. The vertical grey dashed line marked the separation of two study years. The line graphs marked RSV positive rate by year. The vertical red solid line, as the dividing line, marked the highest emergency response to COVID-19, was launched, in Hunan. Abbreviation: ALRTI, acute lower respiratory tract infection; RSV, respiratory syncytial virus; NPIs, non-pharmaceutical interventions
Fig. 3
Monthly distribution of RSV-positive specimens in children with ALRTI in Hunan from July 1, 2013 to June 30, 2022. The numbers of RSV-positive specimens are shown in the grey column diagram, and the positive rates of RSV are shown in the black line graph. Abbreviation: ALRTI, acute lower respiratory tract infection; RSV, respiratory syncytial virus
The annual incidence of RSV from 2013 to 2014 to 2021–2022 was 15.8% (n = 839/5,304), 12.5% (n = 797/6,366), 11.3% (n = 656/5,786), 12.3% (n = 811/6,617), 14.9% (n = 831/5,595), 15.8% (n = 1,121/7,104), 13.1% (n = 596/4,561), 24.6% (n = 1,060/4,305), and 21.3% (n = 855/4,020), respectively. The highest rate occurred in 2020–2021, followed by 2021–2022 (Fig. 2).
RSV can be detected throughout the year. During the study period, the overall detection rate was highest in winter (26.7%) and lowest in summer (6.5%). Seasonal variation was evident during different years. During 2016–2017, 2017–2018, and 2018–2019, RSV was detected most frequently in winter, followed by autumn, and the detection rate was lowest in summer. In February 2020, at the onset of the COVID-19 pandemic, the RSV detection rate suddenly dropped. Only four cases were detected in the spring of 2020, marking the lowest number in recent years (RSV-positive rate of 1.8%). From the summer of 2020 onward, the RSV detection rate remained consistently high, reaching an unprecedented peak in the summer of 2021 that persisted until the end of spring 2022 (Fig. 4).
The age of RSV-positive cases (P = 0.025), age distribution, average length of hospital stays, PICU admission rate, proportion of severe pneumonia cases, and hospitalization expenses exhibited significant differences among study years (Table 2). The percentage of children that need PCIU and severe pneumonia cases present a trend of reduction during the pandemic. Interestingly, the age distribution of RSV-positive children differed between 2020 and 2021 and 2021–2022, with a significantly greater number of positive cases in the 24–59 months age group compared to the < 6 months age group. The median age of infected children was 14 and 15 months for the periods of 2020–2021 and 2021–2022, respectively, with the median age significantly lower from 2013 to 2014 to 2019–2020.
Fig. 4
Seasonality distribution of RSV-positive specimens in children with ALRTI in Hunan from July 1,2013 to June 30, 2022. Abbreviation: RSV, respiratory syncytial virus
Fig. 5
Timing of RSV epidemic seasons (deep blue) by calendar week from 2013 to 2022 in Hunan, China. The peak week is colored in red. The onset and offset weeks of RSV seasons according to different calculative methods. RSV epidemic season was defined as consecutive weeks during which the percentage of RSV-specific testing positive per week exceeded a 10% threshold. Abbreviation: RSV, respiratory syncytial virus
RSV infection trendsThe monitoring year was determined based on the trough in the RSV cycle. Between 2013 and 2022, the surveillance year commenced on July 1 (27th week of epidemiology) and concluded on June 30 (26th week) of the subsequent year. Using our model, we identified nine distinct RSV seasons during the study period. The R2 value for our curve-fitting model, utilizing RSV data, exceeded 0.95. This indicated the effectiveness of the cosine model in predicting and evaluating the seasonal characteristics of RSV in Hunan. Based on a 10% cut-off point and the fitted seasonal curve, we analyzed various parameters for each of the 9 years: the start of the RSV season (the initial 2 consecutive weeks with an RSV-positive rate > 10%), the duration of the season, the peak week, the end of the season, and the proportion of RSV-positive cases (Figs. 5 and 6).
Figure 5 presents the weeks of the epidemic clusters of RSV infection detected per season. During 2013–2014, 2014–2015, and 2015–2016, the RSV season commenced in late autumn and lasted for 24–25 weeks, concluding in late spring of the subsequent year. By contrast, the onset of the RSV season in 2016–2017 and 2017–2018 occurred 11–15 weeks earlier, beginning between late summer and early autumn and lasting for 32–34 weeks, concluding at the end of the following spring. The epidemic clusters of the 2018–2019 seasons were observed between week 45 of 2018 and week 12 of 2019 (November 4–March 23). RSV epidemics during the 6 surveillance years preceding the COVID-19 pandemic (2013–2019) typically commenced in October (week 44), peaked in December (week 53), and lasted a median of 27 weeks before concluding in April (week 17). Around 81.7% of the RSV-positive cases occurred during the official RSV season. Figure 6 demonstrates that the fitting curve was generally consistent with the actual trend in RSV cases.
However, cluster weeks during the 2019–2020 seasons were of short duration. Based on the 10% epidemic threshold, no seasonal RSV epidemic was observed during the spring of 2020 due to the COVID-19 pandemic and associated NPIs. By contrast, the 2020–21 epidemic commenced 12 weeks earlier (August 4), peaked in February (2021) and January (2022), and lasted for 87 weeks before concluding in March 2022. The peak percentage of RSV-positive results was higher than that during pre-pandemic seasons (Figs. 3 and 5, and 6). The COVID-19 pandemic significantly influenced the RSV season in Hunan, with a brief decline in incidence during the spring of 2020, followed by a rapid recovery in the summer of the same year.
Fig. 6
The predictions of year effect on the weeks of the average percentage of respiratory virus antigen tests positive for RSV per week in 2013–2022, as obtained from the non-linear ordinary least squares regression model. The graph begins at calendar week 27. Season onset and offset are indicated by the 2 orange vertical lines. The non-linear ordinary least squares regression model indicated that the year effect on the weeks of epidemic clusters was statistically significant (P-value < 0.001, Fig. 6). Thus, the epidemic season has changed. RSV activity in 2020–2021, resurgence during the summer and autumn, started earlier by 12 weeks when compared with the predictions of year, peaked later (the 7 week), and lasted longer. RSV activity in 2021–2022, started earlier by 18 weeks when compared with the predictions of year, peaked and offset within the predicted range
留言 (0)