Sample
A total of 25 adult human cranial vaults from the Faculty of Medicine at the University of Oviedo (Spain) were used. From each skull, two sample pieces measuring 1.5 × 1.5 cm were obtained from the right (Fp2) and left (Fp1) supraorbital region, yielding a total of 50 samples (n = 50).
The entire procedure followed the strictest quality control measures and respected the ethical guidelines for research with human samples (Law 14/2007, of July 3, on Biomedical Research, Royal Decree 1716/2011, Directive 2004/23/EC).
Devices
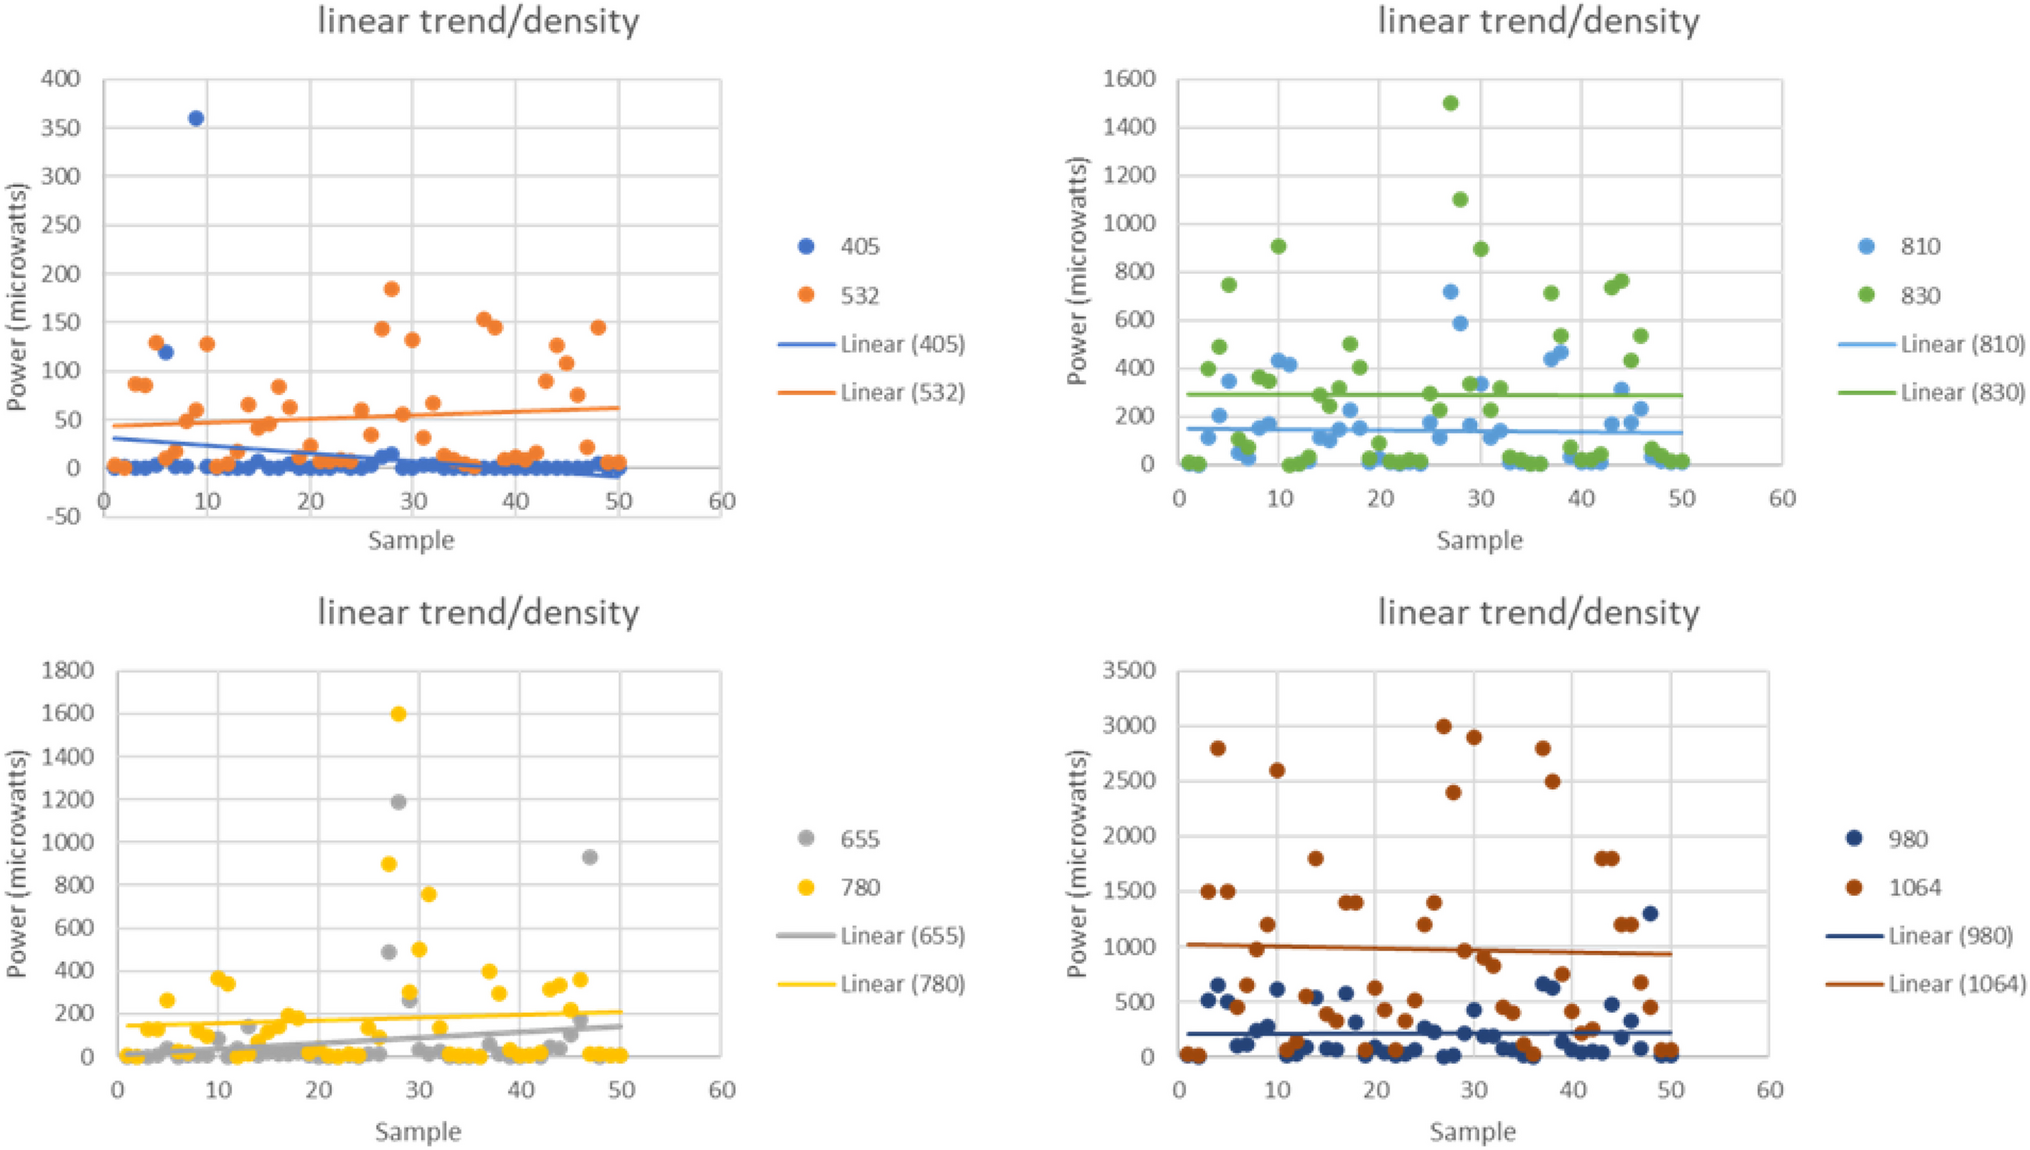
In this study, the researchers utilized a collection of photobiomodulation devices composed of advanced laser diodes (Osram opto, Thorlabs), each tailored to emit a specific wavelength. These devices are adept at producing light across a spectrum ranging from near-ultraviolet (405 nm) to near-infrared (1064 nm), with specific wavelengths including 405 nm (GaN), 532 nm & 1064 nm (Nd:YAG), 655 nm, 780 nm, 810 nm, & 830 nm (GaAs), and 980 nm (InGaAs). The emitted powers for each wavelength are the maximum emitted by each diode: 27,100 μW (0.0271 W), 81,000 μW (0.081 W), 66,000 μW (0.066 W), 57,700 μW (0.0577 W), 113,800 μW (0.1138 W), 60,700 μW (0.0607 W), and 176,200 μW (0.1762 W), showcasing the devices' capability to cover a broad range of therapeutic needs by adjusting for bone density and thickness variations, respectively. The diodes in the study continuously emitted light, key for understanding light absorption and penetration in bone tissue. Covering wavelengths from near-ultraviolet (405 nm) to near-infrared (1064 nm) and emitted powers from 27,100 μW to 176,200 μW, they allow comprehensive investigation into how various wavelengths penetrate bone. Each laser diode is specialized for its wavelength, ensuring consistent, pure light emission, vital for accurately assessing each wavelength's impact on bone penetration in the experiments.
To evaluate the power of the light that passed through the skull bone samples, a ThorLabs PM160 optical power meter was used. This device features a photodiode sensor, designed to measure optical power in a wavelength range of 400 to 1100 nm, suitable for the variety of laser diodes used in this study. The meter has an optical power measurement range of 10 nW to 2 mW, extendable up to 200 mW with a sliding neutral density (ND) filter. The measurement resolution for optical power is 100 pW, which can increase up to 10 nW with the ND filter. The sensor's design includes an ultra-thin sensor end of 3.5 mm thickness (6 mm with the ND filter), allowing for precise placement and minimization of potential measurement interferences. The sensor aperture is Ø9.5 mm, and the device comes with an SM05 optical fiber adapter.
To obtain and analyze optical power measurements, the PM160 GUI version 1.1.0 software was used. This software, developed by ThorLabs, is designed to work seamlessly with the PM160 optical power meter.
To optimize the measurement process and ensure consistency and accuracy of the results, a custom mounting device was designed and fabricated using 3D printing technology. This device, consisting of a base on which the ThorLabs PM160 optical power meter (non-invasive and validated instrument) was placed and an upper part designed to house the different laser diodes, allowed for standardized and controlled measurements. The device was specifically designed to hold the bone samples on its base while the various laser diodes used in the measurements were placed on the top. The dimensions of the device, such as height, width, and depth, were carefully determined to ensure a precise fit of the bone samples and the correct placement of the lasers.
The use of this custom mounting device ensured that the light beam from each laser diode was applied perpendicularly and centered on the surface of the power meter, minimizing potential variations in measurements due to the orientation or positioning of the laser.
Measurement procedure
The measurement procedure to determine the power of light passing through the cranial bone samples was conducted on 1.5 cm × 1.5 cm samples from each skull at the FP1 and FP2 regions, following the international 10–20 system of EEG.
To measure bone thickness, we employed a digital caliper with a resolution of 0.01 mm, ensuring precise measurements of bone thickness. The technique involved applying the caliper at predetermined, consistent points on each bone sample, recording multiple measurements for reliability. As for bone density, we implemented a water displacement method. Each bone sample was submerged in a graduated cylinder filled with water, noting the change in liquid volume. Density was subsequently calculated using the density formula (mass/volume), where mass was determined using a precision scale. These methods provide a detailed and technical analysis of the bone's physical properties.
Bone samples were placed on the base of the 3D-printed mounting device, directly above the ThorLabs PM160 optical power meter. The different laser diodes were positioned on the top of the device, from where the light beam was emitted onto the marked point on the bone sample. Each bone sample was given a specific orientation, and a specific point was marked on which the light from the different lasers used in the test would be incident. This standardization ensured that all measurements were carried out under the same conditions, minimizing any variability that might influence the results. Upon emitting the light, the meter located below the bone sample recorded the power of the light that managed to pass through it. The wavelengths used were 405 nm, 532 nm, 655 nm, 780 nm, 810 nm, 830 nm, 980 nm, and 1064 nm. These measurements were carried out in a controlled environment in the laboratory, ensuring reproducible conditions for each test. The evaluator responsible for measuring optical power was indeed blinded during the study. Each sample was numbered, but the evaluator did not have precise information regarding the thickness and density of the samples, ensuring an unbiased assessment of light power passing through the bone.
Statistics
In their study, the researchers evaluated the relationship between bone density and thickness using Spearman's correlation, chosen due to its suitability for non-normally distributed data, as confirmed by the Shapiro–Wilk test. Spearman's correlation was used to measure both linear and non-linear monotonic relationships, fitting the potential non-linear nature of their biological data.
The interpretation of the R values was conducted according to the following scheme [19]:
R = 1: Perfect correlation. Indicates a direct and proportional relationship between the variables.
R = 0.9 < 1: Excellent. Shows a very strong association between the variables.
R = 0.8 < 0.9: Good. Reflects a strong and significant relationship.
R = 0.5 < 0.8: Fair. Represents a moderate correlation, which may be relevant but not as strong.
R < 0.5: Poor. Indicates a weak correlation, suggesting a less significant or nonexistent relationship between the variables.
This classification allows us to better interpret the relevance and strength of the associations found in our study, providing a useful guide for understanding the interaction between the analyzed variables.
In our linear regression studies, we employed Spearman's correlation coefficient (Rho) to assess the strength of the linear relationship between variables. The interpretation of Rho values was based on the following criteria [19]:
Rho = 1 to 0.7: Strong linear relationship. Indicates a high degree of association between the variables.
Rho = 0.3 to 0.7: Moderate. Reflects a moderate degree of association.
Rho = 0.1 to 0.3: Weak. Suggests a low, but potentially significant, level of association.
Rho = 0 to 0.1: None. Implies no significant linear relationship between the variables.
Additionally, linear regression analyses were performed for each laser wavelength to explore the relationship between laser power and bone density and thickness. To further address non-linear relationships indicated by Spearman's correlation, logarithmic regression analyses were conducted.
In our logarithmic regression models, we used the coefficient of determination (R2) to assess how well the model explains the variability of the data. The interpretation of R2 values was based on the following criteria [19]:
R2 = 1 to 0.9: Explains the variability of the data. Indicates that the model accounts for almost all of the variability in the response data around its mean.
R2 = 0.7 to 0.9: Explains a significant amount of the variability. Reflects that the model accounts for a substantial part of the variability in the response data.
R2 = 0.4 to 0.6: Moderate fit. Indicates that the model does not explain a significant portion of the variability in the data.
R2 < 0.4: Does not explain the variability of the data. Suggests that the model fails to account for a considerable part of the variability in the response data.
This classification helps in evaluating the effectiveness of our logarithmic regression models in explaining the observed data, providing a clear framework for interpreting the results.
This combination of statistical methods provided a comprehensive examination of the data. All analyses were done using IBM SPSS Statistics 27.0, considering p ≤ 0.05 as the threshold for statistical significance, in line with standard scientific practices.


留言 (0)