
記住我
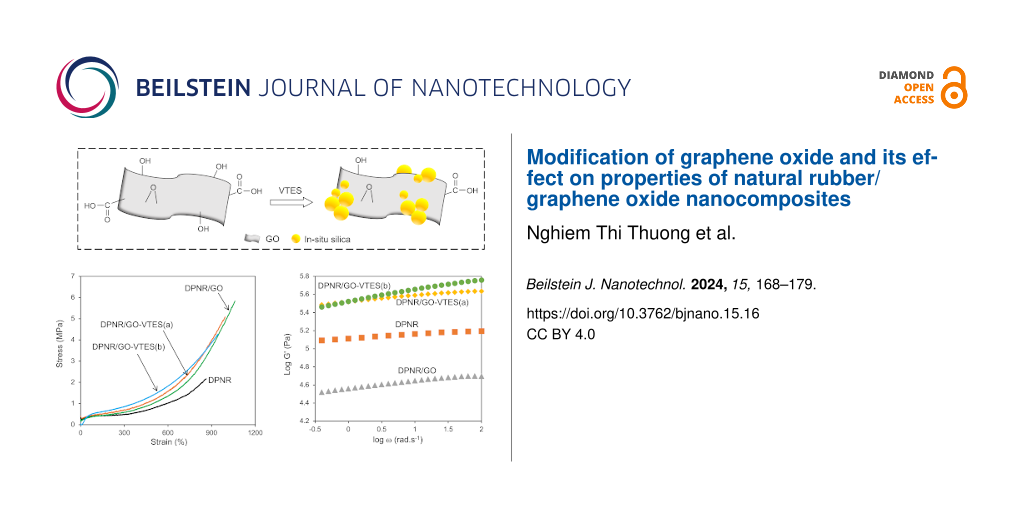

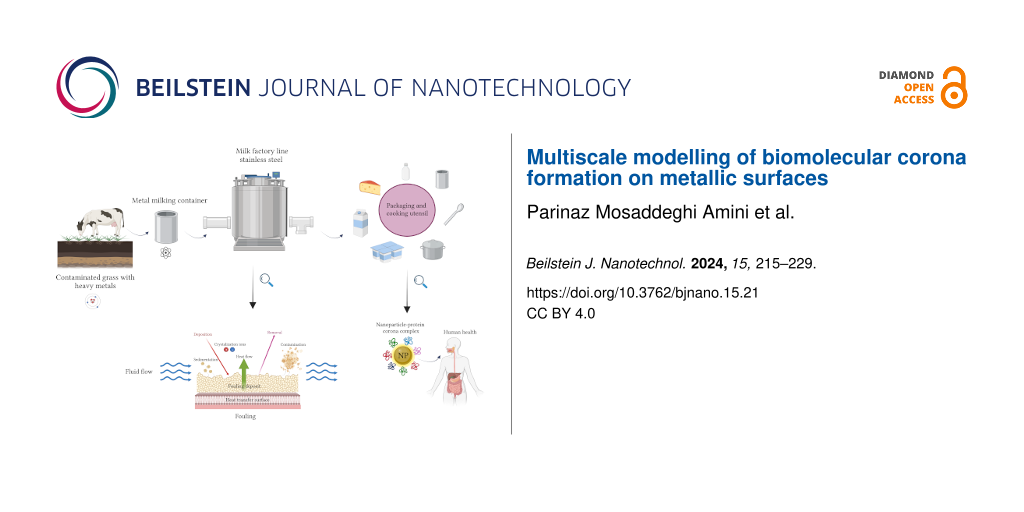
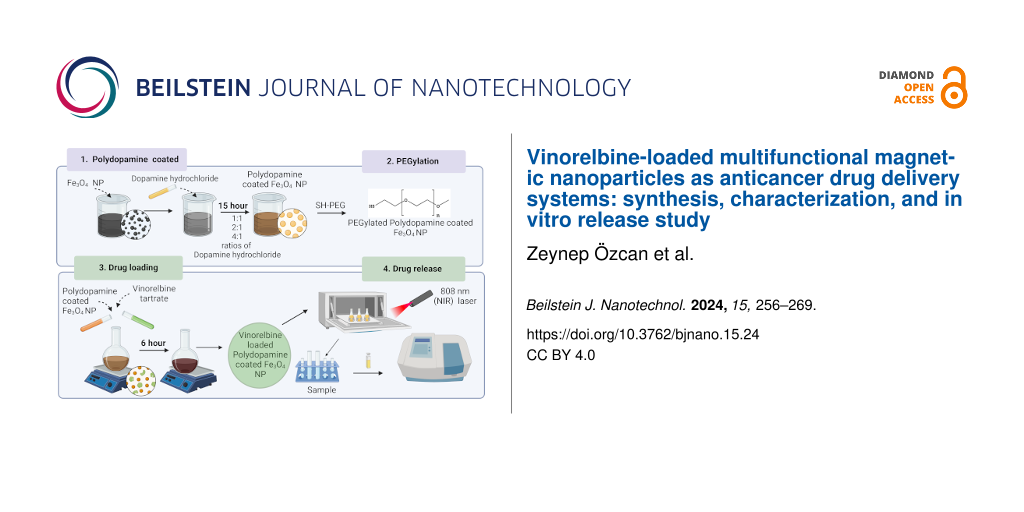
The interface between biological systems and engineered materials has gained significant attention in recent years because of its wide range of applications, spanning from food to medicine and environmental science . This interface plays a crucial role in ensuring the safety and quality of processed and packaged products. The selection of packaging materials and their interaction with biological components have emerged as critical determinants impacting the preservation, shelf life, and overall acceptability of dairy products . Consequently, the interface between biologically relevant molecules and nanoscale materials, such as aluminum, has become an increasingly important and intriguing area of research . For long-term storage and preservation of prepared food, the choice of containers and utensils made from specific materials is essential . For example, it was shown that ripened cheese and cheese spreads acquire a higher aluminum content as compared to other milk products . Aside from wrapping and container packaging, aluminum has found a wide popularity in other applications, such as manufacturing of kitchen utensils, cosmetics, and components for medical and scientific equipment . Figure 1 presents a schematic contamination cycle of dairy products, showcasing potential sources and pathways of aluminum pollution. It illustrates the journey of milk from a cow grazing on grass contaminated with heavy metals, highlighting the crucial role of metallic containers, metal-based equipment, and kitchen utensils in maintaining product integrity. The figure further demonstrates the potential to introduce heavy metal contamination, including iron and aluminum, during processing and emphasizes the formation of a milk layer in form of a protein/lactose corona at the outer surface of macroscropic and micro- and nano-sized particulate after packaging. It also highlights the dynamic interactions at the bionano interface associated with potential human health hazards. Through biomolecule adsorption, change of conformation, and surface chemistry, foreign materials engage in a complex interplay of dynamic physicochemical interactions, kinetics, and thermodynamic exchanges that can lead to undesirable outcomes .
![[2190-4286-15-21-1]](https://www.beilstein-journals.org/bjnano/content/figures/2190-4286-15-21-1.png?scale=2.0&max-width=1024&background=FFFFFF)
Figure 1: Schematic representation of the life cycle of dairy products, showcasing potential sources and pathways of contamination. It features the stages of grazing, collection, processing, and packaging. The relevant processes include surface fouling and milk contamination during food transformation as well as the formation of a protein corona on surfaces and nanoparticles after packaging. The figure was created with BioRender.com, https://biorender.com/. This content is not subject to CC BY 4.0.
In a more general context, the importance in understanding the mechanism of bionano interactions arises from the increasing awareness and concerns regarding the safety of nanoparticles (NPs) in relation to human and animal health. The toxicity of NPs is closely linked to their chemical aggressiveness and varies with their physicochemical properties, including surface area, charge, and reactivity. Understanding the intricate interplay between these properties and the biological systems is vital for assessing and mitigating any potential adverse effects associated with exposure to NPs . To advance in this field, it is crucial to comprehend the underlying forces and molecular constituents that govern the interactions between biomolecules and metals. However, traditional safety assessment methods can be costly, time-consuming, and often involve animal studies. In this regard, in silico modelling offers a promising alternative that can predict the interactions of NPs with living organisms. By leveraging computational approaches, in silico modelling provides a humane and cost-effective means of obtaining the necessary information, thus aiding in the evaluation of NP safety and reducing reliance on animal experimentation . Data-driven methods that rely on statistical analysis are employed for this purpose, particularly when sufficient data are available. These methods leverage the power of large datasets to identify patterns, trends, and correlations between metal properties and their interactions with biomolecules . In recent years, researchers have focused on using physics-based models to understand the mechanisms underlying the formation of NP protein corona, a complex layer of biomolecules that surrounds NPs upon their exposure to biological fluids . It is widely recognized that composition and configuration of the protein corona play a crucial role in determining the biochemical reactivity, sensitivity of NPs, as well as their cellular uptake and systemic transfer . However, in order to develop predictive models, a deeper understanding of the interactions at the bionano interface and their relationship to material and protein properties is necessary. Gathering more information on these intricate interactions will facilitate the development of accurate predictive models, thereby advancing our ability to assess the behavior and potential implications of NPs in biological systems. The bionano interface can be broken down into three interconnected components: (i) the surface of the NP, which is influenced by its physicochemical composition, (ii) the interface between the solid NP and the surrounding liquid environment, where notable changes occur upon interaction, and (iii) the contact zone between the solid–liquid interface and biological substrates (Figure 2) .
![[2190-4286-15-21-2]](https://www.beilstein-journals.org/bjnano/content/figures/2190-4286-15-21-2.png?scale=2.0&max-width=1024&background=FFFFFF)
Figure 2: A chart of the main factors determining the structure of the bionano interface. The quantitative model comprises three essential aspects, that is, surface properties of the nanomaterial, the characteristics of the surrounding medium, and the biological factors at play.
In this work, we study bionano interactions involving metallic aluminum and common dairy biomolecules, namely lactose and the six most abundant milk proteins . The main objective of our analysis is to computationally quantify the relative binding of these proteins on zero-valent aluminum surfaces based on their energy of adsorption and orientation. We employ a three-level multiscale method (as shown in Figure 3) to calculate the energies of adsorption and the content of the corona for these proteins on the selected surfaces. In the section “Results and Discussion”, we provide a detailed explanation of the theoretical model developed to study the interaction between protein and lactose with metals, as well as the rationale behind the parameterization scheme used. Subsequently, we discuss the simulation results and analyze the individual adsorption affinities predicted for molecules representing the biological aspect of the interface, including amino acids (AAs), milk proteins, and carbohydrates. Additionally, we examine the preferred orientations of these molecules upon adsorption and investigate the kinetics of competitive adsorption among the proteins and lactose, aiming to understand the process of protein deposition on metallic surfaces. Finally, the key insights gained from this study are summarized, highlighting the implications and potential applications of the findings.
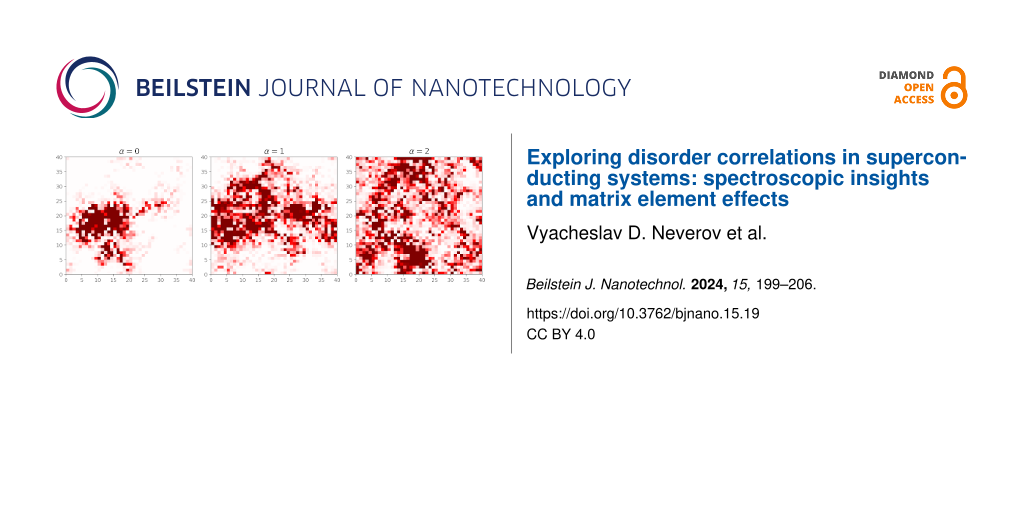
Results and DiscussionHere, we aim to predict the content of a biomolecular corona on a metallic aluminum surface. At the largest scale, our methodology employs a coarse-grained (CG) kinetic Monte Carlo (KMC) method to simulate competitive adsorption of biomolecules onto the aluminum surface. To achieve this, we evaluate individual binding energies at various orientations (represented by heatmaps) for each selected protein immobilized on different fcc planes of the aluminum surface. These heatmaps for individual proteins are acquired through UnitedAtom (UA) simulations . While the UA method has been parameterized for a range of rigid surfaces, including metals (Ag, Au, Cu, and Fe), oxides (TiO2, SiO2, and Fe2O3), carbonaceous NPs (graphene, carbon nanotubes, and carbon black), semiconductors (CdSe) , and polymers , it lacks the set of short-range potentials required for calculating milk protein-aluminum adsorption energies. Here, we compute potentials of mean force (PMF) for Al surfaces derived from explicit all-atom molecular dynamics simulations utilizing a previously established scheme . These PMFs provide the input required to determine the adsorption energies between milk proteins and aluminum surfaces by using multiscale UA CG model, spanning from the atomistic level of description to the complete mesoscale model of the corona. Figure 3 shows the parameterization and simulation workflow, outlining different stages and components involved in the study.
![[2190-4286-15-21-3]](https://www.beilstein-journals.org/bjnano/content/figures/2190-4286-15-21-3.png?scale=2.0&max-width=1024&background=FFFFFF)
Figure 3: A dataflow scheme of the multiscale modelling approach implemented in this study, including an all-atom model of surface and AAs, a CG UnitedAtom model for the entire protein-surface interaction, and a CG competitive adsorption model. The figure provides an overview of input and output data at each scale.
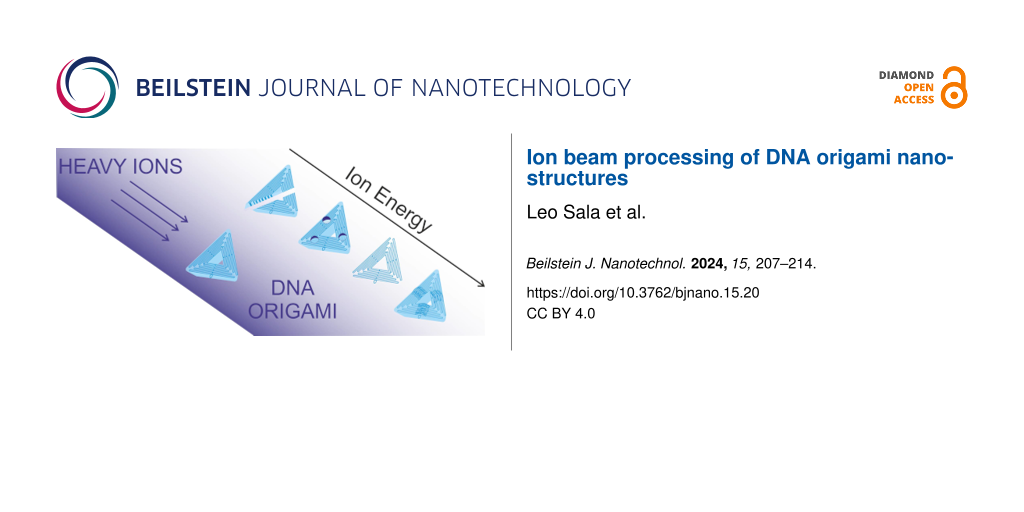
All-atoms short-range interaction modelling resultsAll-atom metadynamics simulations were conducted using GROMACS-2018.6 and PLUMED (PLUMED2-2.5.1.conda.5) software packages . CHARMM-GUI/Nanomaterial Modeler was employed to construct the topology and force fields of three fcc surfaces of Al: (100), (110), and (111) . The General Amber Force Field (GAFF) was utilized to model side-chains analogues (SCA) within the system . The AMBER force field is a widely recognized and extensively validated force field that provides accurate descriptions of molecular systems . We evaluated the short-range PMFs between 22 SCAs and an Al slab in a solvent environment comprising water and salt ions. The system’s pH value was maintained at a neutral level, and the NaCl salt concentration was set to 150 mM, mimicking the overall ionic strength of milk and equivalent to one salt molecule per 10 nm3. The system underwent equilibration for 1.0 ns under constant pressure conditions at 1.0 bar and a temperature of 300 K, following the NPT ensemble, employing Berendsen weak coupling method . Subsequently, a pre-equilibration phase was conducted for 10 nanoseconds within the NVT ensemble. For the short-range interactions, the cut-off distance was defined as 1.0 nm. In the adaptive well-tempered metadynamics (AWT-MetaD) simulations, the adsorption energy was calculated at a temperature of 300 K, a pressure of 1.0 bar, and a neutral pH within the NVT ensemble. Additionally, we measured the interaction energy as a function of surface separation distance (SSD) as a collective variable, enabling a comprehensive analysis of the AA–NP interactions. For a detailed explanation of the method used in this study, please refer to previous reports where the method has been described in depth. Figure 4 and dataset show the obtained free energy of adsorption in units of kBT.
![[2190-4286-15-21-4]](https://www.beilstein-journals.org/bjnano/content/figures/2190-4286-15-21-4.png?scale=2.0&max-width=1024&background=FFFFFF)
Figure 4: Adsorption free energy profiles of SCAs on three aluminum fcc slabs as a function of the surface separation distance (SSD). These profiles were calculated using all-atom AWT-MetaD. The vertical lines indicate the positions of water and ion layers. (a) Al(100), (b) Al(110), and (c) Al(111).
The water density profiles obtained from MD simulations for the slab–water system in the context of Al surfaces revealed characteristics that were previously observed for other simulated metallic surfaces . The profiles exhibited two distinct regions with elevated water density located approximately 0.15–0.18 nm and 0.42–0.48 nm away from the aluminum surface. These regions corresponded to the first and second water layers adjacent to the metal surface, respectively (as depicted in Supporting Information File 1, Figure S1). Further examination of the ion density profiles indicated the presence of sodium ions within a range of 0.55–0.60 nm and chloride ions within a range of 0.42–0.46 nm from the Al surface. Notably, the positions of the chloride ions align closely with the second water layer, while sodium ions are located past this layer, as marked by the blue and purple vertical dashed lines in Figure 4. This alignment suggests that the chloride ions integrate into the network of water molecules comprising the second adlayer. Additionally, the analysis of the PMFs revealed a significant minimum at a distance of 0.21–0.25 nm. Figure 5 shows the minimum energy values obtained for each AA on different facets of the aluminum surface (100, 110, and 111) in a bar chart.
![[2190-4286-15-21-5]](https://www.beilstein-journals.org/bjnano/content/figures/2190-4286-15-21-5.png?scale=2.0&max-width=1024&background=FFFFFF)
Figure 5: Minimum energy of adsorption (kBT) for each SCA on three Al fcc slabs obtained through all-atom simulations: (a) Al(100), (b) Al(110), and (c) Al(111). Notably, Al(111) exhibits a stronger binding affinity than Al(100) and Al(110).
A comparison of the adsorption energies on aluminum and iron surfaces reveals distinct preferences for different AAs. On aluminum surfaces, ARG, PRO, TRP, TYR AAs show the strongest attraction (−63.32kBT to −41.46kBT), followed by HIE, GLN, PHE, GAN (−43.86kBT to −20.85kBT). VAL, THR, SER, CYS, ALA exhibit the weakest attraction (−19.51kBT to −1.76kBT). On iron surfaces, charged and aromatic PRO, TYR, ARG, HIS AAs are strongly adsorbed (−91.29kBT to −43.34kBT), while hydrophobic VAL, LEU, ALA AAs show a weaker adhesion (−21.70kBT to 2.86kBT) . We also show the PMF for glucose with aluminum surfaces, used as the basis for a model of lactose, a sugar highly present in milk, as discussed later, computed using the PMFPredictor software in Figure 6 .
![[2190-4286-15-21-6]](https://www.beilstein-journals.org/bjnano/content/figures/2190-4286-15-21-6.png?scale=2.0&max-width=1024&background=FFFFFF)
Figure 6: The interaction potential of glucose with the three Al surfaces predicted using the PMFPredictor Toolkit. The solid lines give the ensemble average of ten versions of the model while the shaded regions indicate the 95% confidence intervals.
Protein–NP interactionsTo further understand the adsorption energy and orientation of each individual protein, a primary coarse-graining step was performed. In this part, we use the UA model to predict the protein–NP binding energies. This model takes into account various factors, such as the material’s chemical composition, size, shape, surface roughness, charge, functionalization, and hydrophobicity, when constructing CG models for the bionano interface. The UA model simplifies the protein–NP interactions by representing proteins as rigid structures composed of 20 AA types, each represented by a single bead. This interaction is described through a short-range surface non-bonded potential (![[Graphic 1]](https://www.beilstein-journals.org/bjnano/content/inline/2190-4286-15-21-i7.svg?max-width=637&scale=1.18182) ) (including van der Waals (vdW) repulsion and solvent effects), a long-range core vdW potential (
) (including van der Waals (vdW) repulsion and solvent effects), a long-range core vdW potential (![[Graphic 2]](https://www.beilstein-journals.org/bjnano/content/inline/2190-4286-15-21-i8.svg?max-width=637&scale=1.18182) ), and an electrostatic potential (Uel). Through interaction potentials for specific AAs with the NP, the overall interaction potential between the NP and the complete protein (Up−NP) is expressed in a pairwise additive manner:
), and an electrostatic potential (Uel). Through interaction potentials for specific AAs with the NP, the overall interaction potential between the NP and the complete protein (Up−NP) is expressed in a pairwise additive manner:
![[2190-4286-15-21-i1]](https://www.beilstein-journals.org/bjnano/content/inline/2190-4286-15-21-i1.svg?max-width=590&scale=1.18182) (1)
(1)The potential Up−NP depends on the distance di between the centers of mass of the NP and each AA in the protein. This distance is determined by the protein’s orientation with respect to the NP’s surface, which is defined by two rotational angles (ϕ, θ) relative to the protein’s initial orientation. This initial orientation is set by performing a principle axis transformation such that the axis associated with the smallest moment of inertia is aligned to the z axis and the second smallest to the y axis, that is, the z axis is now typically associated with the greatest extent of the protein. Since this does not uniquely specify the orientation, further rotations of 180° are then applied if necessary such that the electric dipole moment is positive along these two axes. This produces a convenient reference state by which other orientations are defined. The specific orientation (ϕ, θ) is generated by applying a rotation of −ϕ around the z axis followed by a rotation of 180° − θ around the y axis. The short-range surface non-bonded potentials are extracted from AWT-MetaD simulations, which were described in the section “All-atoms short-range interaction modelling results”. The Hamaker technique is used to approximate the long-range term that results from the vdW forces working through the aqueous medium between the NP core and the i-th AA. The electrostatic interaction between the NP and AA is represented by the screened Coulomb potential. More comprehensive information about the theoretical aspects of the UA model can be found in our previous publications . The output of the UA simulations contains a collection of rotational configurations and their corresponding E(θk,ϕl) values. By employing Boltzmann averaging and weighting factors based on the potential energy as a function of distance for each angle, we calculate the average adsorption energy of these configurations. Using this approach, we evaluate the adsorption energies of the entire proteins on aluminum surfaces. To predict the three-dimensional (3D) structures of proteins, we utilize the I-TASSER (Iterative Threading ASSEmbly Refinement) 5.1 software , which uses the protein’s AA sequences as an input.
For this study, we have chosen six representative cow milk proteins and lactose, which constitute most of the non-fat milk solids. Table 1 displays properties of the chosen compounds. It includes their UniProt IDs, molecular weights, charges, and the number of AAs in each protein. The charge data was determined through the PROPKA method at a pH of 7.0. We model the lactose molecule as a pair of glucose beads; it does not possess a UniProt ID or a count of AA residues. We estimated the concentration of each protein and lactose based on their weight fraction in milk and considering the fact that cow milk has 30–39 g/L of protein and 45–55 g/L of lactose in total. The molar mass of each protein was taken from AlphaFold database . Following this, all proteins underwent a 50 ns equilibration in water using NVT and NPT ensembles.
Table 1: Characteristics of the selected milk proteins and lactose.
Abbreviation UniProt ID Compound name MWa, Da Charge, e Resb Cc [10−4], mol/L Rgd [Å] AS1C P02662 αs1-casein 24528.00 −8.5 214 4 20.05 AS2C P02663 αs2-casein 26018.69 4.5 222 1 40.81 BC P02666 β-casein 25107.33 −4.5 224 4 22.53 ALAC P00711 α-lactalbumin 16246.61 −5 142 0.9 15.01 BLAC P02754 β-lactoglobulin 19883.25 −6 178 2 15.50 BSA P02769 bovine serum albumin 69293.41 −4.5 607 0.1 27.69 LAC — lactose 342.3 0 — 1300 4.28aMolecular weight, bNumber of residues, cConcentrations [mol/L] of the molecules in milk that were used in KMC calculations, dRadius of gyration of the biomolecules in Ångstrom.
The UA computations were conducted using nine different Al NPs with varying radii, namely 2, 5, 10, 20, 30, 40, 50, 80, and 100 nm, to investigate the influence of size and curvature on the adsorption energies. The results and detailed information on the calculation can be found in Supporting Information File 1, Figure S2 and Figure S3, which illustrate the variations in adsorption energies as a function of NP size. Within the range of 2–20 nm the binding energies of ALAC, BLAC, BC, and BSA show an initial increase on all surfaces, followed by a stabilization at larger NP sizes. In contrast, AS1C and AS2C exhibit a continuous rise in binding energy across the entire size spectrum, ranging from −48.0kBT at 2 nm to −281.09kBT at 100 nm for AS1C and −15.26kBT at 2 nm to −275.60kBT at 100 nm for AS2C, with AS2C exhibiting the most dramatic changes in binding energy as a function of size. This strong size dependence in binding energy for AS2C can be attributed to its rod-like 3D structure and the rigidity assumption in our model. As the size of the NP increases, AS2C can make more extensive contact with the surface. This increased contact area leads to enhanced binding affinity, resulting in the observed stronger binding across the size range. This is not the case for other proteins on the list as they are more compact and, therefore, reach the maximum number of contacts at relatively small NP sizes. Regarding the binding affinity rankings, for the smallest NPs (2 nm), the order from weakest to strongest is observed as AS2C, BSA, ALAC, BLAC, AS1C, and BC on Al(100), with similar rankings observed on Al(110) and Al(111) surfaces. However, for the largest (flattest) NPs (100 nm), the binding affinity ranking changes to ALAC, BLAC, BSA, BC, AS2C, and AS1C on Al(100), BC, ALAC, BLAC, BSA, AS2C, and AS1C on Al(110), and BLAC, ALAC, BC, BSA, AS2C, and AS1C on Al(111) (see Supporting Information File 1, Figure S2). In reality, protein structures are not rigid, allowing them to adapt to the surfaces upon immobilisation. This can potentially affect their binding behavior. This can be especially significant for caseins, as they belong to the group of flexible milk proteins with no tertiary structure. Globular milk proteins (lactoglobulin and lactalbumin) are expected to be less prone to this shortcoming of the UA model.
Figure 7 shows the output of the UA model for the selected milk proteins on aluminum NPs with a surface size of 80 nm with zeta potential −5 mV at pH 7.0. The heatmaps display the adsorption energies for all values of θ and ϕ. Blue areas with lower energies indicate more favorable orientations of the proteins. Each heatmap is accompanied by a 3D representation of the protein on the NP surface, with the AAs closest to the NP’s surface marked. The AAs that are most likely to make contact with the metal surfaces, according to analysis, are LYS, TYR, PHE, GLU, ARG, and ASP.
![[2190-4286-15-21-7]](https://www.beilstein-journals.org/bjnano/content/figures/2190-4286-15-21-7.png?scale=2.0&max-width=1024&background=FFFFFF)
Figure 7: Adsorption energy heatmaps obtained from the UnitedAtom model and corresponding 3D representations of the interactions of (a) AS1C, (b) AS2C, (c) BC, (d) BLAC, (e) ALAC, and (f) BSA with Al(110) in the preferred orientations. The figure highlights the closest AAs to the surface of the material.
The rankings of protein adsorption on each aluminum surface are shown in Table 2, highlighting the variations in adsorption energies (Eads/kBT) and the particular protein–surface interactions (θ and ϕ in degrees). Moreover, the minimum distance (rmin in nm) indicates the closest approach of the protein to the aluminum surface during the adsorption process.
Table 2: Comparison of milk proteins’ binding affinities and orientations on Al(100), Al(110), and Al(111) with NP radius of 80 nm, derived from the UnitedAtom model and ordered by the binding strength on each surface.
Individual protein adsorption description on Al(100) Protein, Eads/kBT ϕ,° θ,° rmin, nm AS1C −145.65 175 100 0.19 BC −108.13 305 40 0.13 AS2C −96.12 315 95 0.05 BSA −91.11 45 60 0.11 BLAC −67.35 65 90 0.19 ALAC −49.12 125 35 0.20 Individual protein adsorption description on Al(110) Protein, Eads/kBT ϕ,° θ,° rmin, nm AS1C −278.37 175 100 0.32 AS2C −224.01 345 90 0.10 BSA −173.77 40 60 0.23 BLAC −157.70 50 95 0.28 ALAC −155.17 70 90 0.29 BC −132.52 0 70 0.20 Individual protein adsorption description on Al(111) Protein, Eads/kBT ϕ,° θ,° rmin, nm AS1C −242.93 175 100 0.15 AS2C −181.65 330 90 0.11 BSA −137.46 45 60 0.13 BC −131.93 140 110 0.15 ALAC −125.76 75 90 0.17 BLAC −113.39 45 75 0.20The ranking of adsorption energies highlights the distinct adsorption behaviors of various proteins on different metal fcc surfaces. We can see that AS1C exhibits the highest adsorption energy on Al(100) and Al(111) surfaces, while on Al(110), AS1C, and AS2C show similar adsorption energies. In contrast, on metallic iron, AS1C consistently demonstrates the highest adsorption energy on Fe(100), Fe(110), and Fe(111) surfaces. This result reflects the size and shape of the AS1C protein, which allows it to make the largest number of contacts with the metal as compared to the other proteins. Regarding the most weakly bound proteins, on aluminum surfaces, ALAC consistently exhibits the lowest adsorption energy across all three surfaces, while BLAC shows slightly higher adsorption energies. In contrast, on iron surfaces, ALAC and BLAC demonstrate comparable adsorption energies, with ALAC exhibiting slightly lower energies on Fe(110) and Fe(111) surfaces . We note that generally the binding of proteins to aluminum is weaker than to iron, which may be caused by the smaller lattice constant of fcc iron and higher density of surface atoms.
Supporting Information File 2, Table S2 reports the preferred orientations of all 820 milk proteins based on the lowest energy from the UnitedAtom output. In our investigation of these proteins, we focused on identifying the most strongly adsorbing proteins when exposed to Fe and Al. These proteins, including P19660, A6QP30, G3X745, F1MMI6, E1BBY7, A6QLY7, and Q9N2I2, demonstrated remarkable similarity in their binding behavior towards Fe(100) and Al(100) surfaces, E1BGJ4, A5D7M6, F1MMI6, A6QP30, G3X745, and F1N1C7 on Fe(110) and Al(110) surfaces, and F1MMI6 and E1B748 and A6QP30 on Fe(111) and Al(111) surfaces.
In the subsequent step, we predicted the composition of the milk protein layer at the aluminum surfaces. For this analysis, we consider the Al surface as a spherical NP with the protein layer uniformly adsorbed on its entire surface, forming the protein corona.
Competitive adsorption and biomolecular coronaKinetic Monte Carlo (KMC) simulations as implemented in the CoronaKMC tool were employed to investigate competitive adsorption and to determine the composition of the protein corona. This method models adsorbates as hard spheres, which adsorb and desorb to the surface of the NPs, with different orientations of each protein treated as different potential adsorbates to allow for a more physically realistic model of corona formation for anisotropic proteins. In brief, a standard kinetic Monte Carlo routine is used to advance the simulation from one event, collision of an incoming adsorbate with the NP or desorption of an adsorbed species, to the next, with events occurring with a probability proportional to their rate. In the initial form of the model, adsorption is assumed to occur with unit probability if the incoming species does not overlap with any currently adsorbed species and fails to take place otherwise. We parameterize this model using adsorption and desorption rate constants extracted from UnitedAtom results as described previously . In brief, each potential adsorbate (e.g., a small molecule or a particular orientation of a protein) is projected onto the surface of the NP and a convex hull procedure used to estimate the area of the NP occupied by that adsorbate, Ai. The adsorbate is then assigned an effective radius Ri such that a sphere projected onto the NP would produce the same radius . The per-site adsorption rates are calculated using kinetic theory for the rate of collisions between two spheres in solution, normalized by the number of binding sites for that protein,
![[2190-4286-15-21-i2]](https://www.beilstein-journals.org/bjnano/content/inline/2190-4286-15-21-i2.svg?max-width=590&scale=1.18182) (2)
(2)where RNP is the radius of the NP, NA is Avogadro’s number, RA is the effective adsorbate radius, D is the pair diffusion coefficient given by
![[2190-4286-15-21-i3]](https://www.beilstein-journals.org/bjnano/content/inline/2190-4286-15-21-i3.svg?max-width=590&scale=1.18182) (3)
(3)taking the viscosity η = 8.9 × 10⁻⁴ Pa·s. We employ SI units in the above calculation, noting that ka must then be multiplied by 1000 to convert from units m3·mol−1 to L·mol−1. Desorption rates are found by requiring that ![[Graphic 3]](https://www.beilstein-journals.org/bjnano/content/inline/2190-4286-15-21-i9.svg?max-width=637&scale=1.18182) where Eads is the value obtained for that orientation using UnitedAtom . A concentration is then assigned to the adsorbate based on the bulk concentration of that adsorbate, weighted by the relative abundance of that orientation of the adsorbate if necessary. This means that for protein i with a bulk concentration of Ci and a set of orientations θk, an orientation θj is assigned a concentration
where Eads is the value obtained for that orientation using UnitedAtom . A concentration is then assigned to the adsorbate based on the bulk concentration of that adsorbate, weighted by the relative abundance of that orientation of the adsorbate if necessary. This means that for protein i with a bulk concentration of Ci and a set of orientations θk, an orientation θj is assigned a concentration
留言 (0)