
記住我
The peripheral intravenous catheter (PIVC) plays an important and essential role in providing nutrition and medications for patients; inadequate assessments may contribute to poor outcomes, where up to 69% of PIVCs have painful complications.1 The prevalence rate of PIVC complications is high in the pediatric population, ranging from 34.0% to 56.0%.2 Among the complications, infiltration, extravasation, phlebitis, obstruction, and accidental removal are the main complications in hospitalized children,3 leading to premature removal and replacement of PIVC but also increased pain and fear when reindwelling PIVC needles.4,5 In addition, multiple punctures increase the risk that the child will not have a suitable site for PIVC placement, namely, venous failure and difficult intravenous access,6 which is typically defined as 2 or more failed insertion attempts.7 In severe cases, the PIVC complications can lead to local tissue infection, necrosis, or even loss of function,8 increased medical costs, and prolonged hospital stay.9 Therefore, reducing the degree of injury resulting from PIVC complications among hospitalized children is one of the critical patient safety issues.10
Studies have shown that identifying risk factors and implementing proactive and effective nursing management can reduce the harm of PIVC complications in hospitalized children.11,12 Previous studies focused on risk factors for preventing PIVC complications in hospitalized children suggested that specific age groups (i.e., 2–11 y), puncture sites, dressing integrity, and stability were risk factors for PIVC complications.2,13,14 Other studies pointed out that PIVC placement, puncture site (lower extremity), PIVC gauge, and dressing contamination can lead to the development of phlebitis.11,15 Nonetheless, an effective method to timely assess the risk is needed to explore, which could be used to target screening and earlier intervention to prevent PIVC complications in children.
A nomogram is a graphical depiction that presents a regression model in a friendly manner and simplifies risk assessment. It provides healthcare practitioners a user-friendly interface to map the probability of adverse events to individual patients and enhance clinical decision making.16,17 Nomogram could serve as a “look-up” tool and strengthen risk assessment’s validity and objectivity.18 Using the nomogram, nurses can quickly and precisely identify and determine the degree of children’s risks and prompt timely additional care to improve patient outcomes. Therefore, this study aimed to (1) describe the characteristics of hospitalized children with PIVC complications and (2) construct the nomogram as an easy-to-use visualization to identify the hospitalized children at low or high risk of PIVC complications by severity prediction. Findings from this study could have a particular value for clinical applications through a simple graphical representation, making the prediction simpler and more convenient.
METHODS Study Design and ParticipantsThis cross-sectional, observational study was conducted in 3 pediatric wards of 2 tertiary teaching hospitals in Beijing. Each pediatric ward had 40 beds in the hospitals. All the nurses in these pediatric wards were required to be trained and certified before their first PIVC insertion by the nursing department; thus, the study was conducted under the assumption that all nurses are qualified to insert PIVC. The sample size was calculated using G-power (version 3.1.9.2) when the medium effect size of multiple regression analysis for the F test was 0.15, the α value was 0.05, the power (1-beta) was 0.90, the number of predictors was 21, and the minimum sample size of this study should be 210. We incorporated a 10% inflation rate to adjust for lost to follow-up, and a sample size of at least 231 was required. Inclusion criteria were children, aged 0 to 14 years, hospitalized with at least one PIVC complication, and whose primary caregiver was willing to participate in the study. Children were excluded if they were under immune compromised or corticosteroid therapy because of their higher risk of phlebitis.11 From January 2021 to March 2022, a convenient sample of 301 hospitalized children in medical, surgical, and intensive care units were recruited and completed the study.
InstrumentBased on a literature review and practice standards for infusion therapy,2–13,15,19 the researchers designed an assessment tool to collect risk factors for PIVC complications. The risk factors include patient demographics (4 items including age, sex, medical diagnosis, and place of admission), catheter insertion characteristics (8 items including catheter inserted vascular condition, site of insertion, type of the catheter, size of the catheter, type of needless connectors, tension-free bonding, limb immobilization, and needle adjustment), and catheter maintenance characteristics (9 items including antibiotics therapy, blood transfusion, infusion method, pressing on the site, evaluation, change dressing, infusion frequency, infusion speed, and infusion length). The assessment tool was reviewed by a task force group that included five specialized experts from the fields of intravenous therapy (n = 2), pediatric nursing (n = 2), and patient safety (n = 1). The experts of intravenous therapy were trained and certified by China nursing association, who experienced in peripheral catheter insertion, and at times use vein visualization devices, including ultrasound to assist in peripheral IV placement. To ensure clarity and readability, a panel of 10 clinical nurses used a 4-point Likert-type scale (1 = not clear to 4 = very clear) to determine whether item presentations could be clearly understood.
The severity of PIVC complications was classified according to the Severity Assessment Code (SAC) rating and triage tool (online at hqsc.govt.nz), which was designed by the Health Quality and Safety Commission (HQSC, New Zealand).20 Incidents that did not result in injury or increased level of patient care, did not require additional review, and resulted in no financial or service losses were coded as SAC 4 (minimal-minor). Permanent moderate or marked temporary loss of function was coded as SAC 3 (moderate). Permanent significant or severe temporary loss of function was coded as SAC 2 (major). Death or severe permanent loss of function was coded as SAC 1 (severe).
Data CollectionThe institutional review board at the research sites approved the study (IRBPUMCSON202109). Potential participants and their primary caregivers were informed whether they took part in the study, will not lose any benefits at the ward, and it was entirely voluntary. Written informed consent was obtained from the primary caregivers before the data collection started, and contact information and case data were stored separately to ensure anonymity and confidentiality. All incidents were reviewed and recorded by an independent monitor (the second author) and managed using standard hospital procedures. The patient’s privacy and confidentiality were maintained throughout the study.
Data AnalysisAll categorical data were dummy coded. Before analysis, all data were evaluated to ensure that all met statistical assumptions. Descriptive statistics were used to describe sample characteristics and the major variables. According to the severity assessment code (SAC), the patient’s severity of the patient’s PIVC complications was SAC 4 (minimal-minor) or SAC 3 (moderate); however, SAC 2 and SAC 1 were not found. The χ2 test and t test were used to explore the associations between the outcome variable (severity) and independent variables. Multivariable logistic regression analysis by backward stepwise was generated using selected predictors, and the features were presented as odds ratio (OR) and 95% confidence interval (CI). Two methods, including calibration curve analysis and receiver operating characteristic analysis, were used to evaluate the performance of the nomogram model.18 Receiver operating characteristic curve was used to forecast the accuracy, and bootstrap resampling was used to verify the internal validation of the predictive model. Model discrimination was assessed by the concordance index (C-index), and the calibration curve was plotted to determine the agreement between the predicted event probability and the observed event probability. Decision curve analysis (DCA) was adopted to determine the nomogram’s clinical usefulness and net benefit.21 Statistical analyses were conducted using SPSS 24.0 (IBM, Armonk, NY) and R Studio version 4.2.0 (http://www.r-project.org/).
RESULTS Sample CharacteristicsA total of 301 hospitalized children were recruited and completed the study (Table 1). Most participants were 0 to 1 years old (44.4%), males (62.5%), and hospitalized in the surgical ward (55.8%).
TABLE 1 - Demographic Characteristics of Hospitalized Children (N = 301) Variable n (%) SAC 4 (n = 119), n (%) SAC 3 (n = 182), n (%) χ2/Fisher P Age, y 17.139 0.002 0–1 134 (44.4) 36 (30.3) 98 (53.8) 1–3 43 (14.3) 19 (16.0) 24 (13.2) 3–6 70 (23.3) 37 (31.0) 33 (18.2) 6–12 33 (11.0) 17 (14.3) 16 (8.8) 12–14 21 (7.0) 10 (8.4) 11 (6.0) Sex 0.424 0.515 Male 188 (62.5) 77 (64.7) 111 (61.0) Female 113 (37.5) 42 (35.3) 71 (39.0) Wards 8.692 0.013 Surgical 168 (55.8) 54 (45.4) 114 (62.6) Medical 96 (31.9) 47 (39.5) 49 (26.9) ICU 37 (12.3) 18 (15.1) 19 (10.5) Case 12.207* 0.033 Gastrointestinal 92 (30.6) 29 (24.4) 63 (34.6) Hepatobiliary 44 (14.6) 12 (10.1) 32 (17.6) Respiratory 98 (32.6) 48 (40.2) 50 (27.5) Rheumatic 19 (6.3) 6 (5.1) 13 (7.1) Hematological 10 (3.3) 6 (5.1) 4 (2.2) Others† 38 (12.6) 18 (15.1) 20 (11.0)Bold values denote statistical significance at the P < 0.05 level.
*Fisher exact test.
†Others: including acute appendicitis, hernia, pulmonary hemosiderosis, and infection.
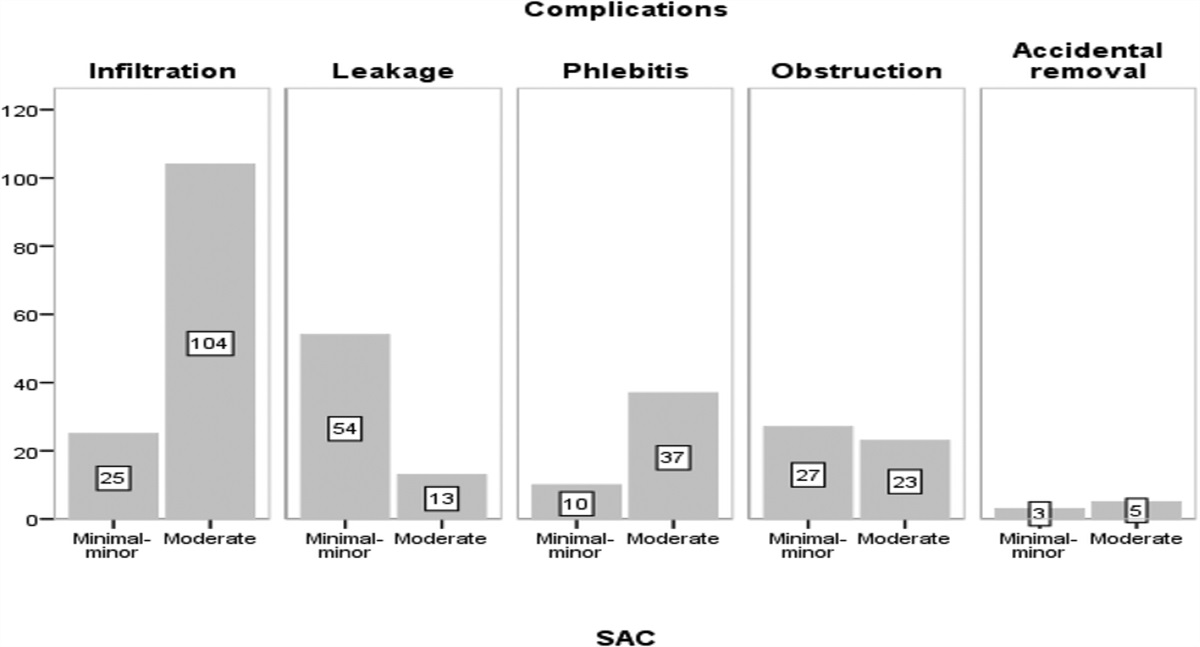
There were 128 participants (42.5%) experienced a complication with infiltration, followed by leakage (n = 70, 23.3%), phlebitis (n = 48, 15.9%), obstruction (n = 47, 15.6%), and accidental removal (n = 8, 2.7%). The description of PIVC complications10 is in Table 2. More than half of the participants (n = 182, 60.5%) had a moderate injury from PIVC complication; the most common complication was infiltration (n = 104; Fig. 1). Tables 3 and 4 show that catheters were inserted into different sites; the most common site was the back of hand (130, 43.2%). The main PIVC size was 24-gauge (n = 286, 95.0%), and the type was a closed IV catheter system (n = 271, 90.0%). The IV fluid was either delivered by gravity (clamp on) (n = 197, 65.4%) or by an electronic infusion pump. Most of them (n = 229, 76.1%) were removed needles for PIVCs complications shorter than 72 hours (n = 47, 20.6% ≤24 hours).
TABLE 2 - The Description of PIVC Complications Complications Description Assessment Infiltration The accidental leakage of nonvesicant solutions from the vein into the surrounding tissue. –Swelling at or near the IV site. The skin will feel tight and cool to the touch. FIGURE 1:
 Peripheral intravenous catheter complications in 2 groups.
TABLE 3 - Peripheral Intravenous Catheter Insertion Characteristics (N = 301) Variable n (%) SAC 4 (n = 119), n (%) SAC 3 (n = 182), n (%) χ2/Fisher P Type of PIVCs* 0.003 0.956 Opened IV 30 (10.0) 12 (10.1) 18 (9.9) Closed IV 271 (90.0) 107 (89.9) 164 (90.1) Size 1.257 0.262 26G 15 (5.0) 8 (6.7) 7 (3.8) 24G 286 (95.0) 111 (93.3) 175 (96.2) Needless connectors 3.911 0.048 Positive displacement 214 (71.1) 77 (64.7) 137 (75.3) Negative displacement 87 (28.9) 42 (35.3) 45 (24.7) Site of insertion 18.759† 0.001 Hand 130 (43.2) 51 (42.9) 79 (43.4) Foot 53 (17.6) 16 (13.4) 37 (20.3) Forearm 14 (4.7) 8 (6.7) 6 (3.3) Head 32 (10.6) 5 (4.2) 27 (14.8) Wrist 72 (23.9) 39 (32.8) 33 (18.2) Vascular condition 26.943 0.000 Good‡ 120 (39.9) 69 (58.0) 51 (28.0) Bad 181 (60.1) 50 (42.0) 131 (72.0) Tension-free bonding 8.909 0.003 Yes 106 (35.2) 54 (45.4) 52 (28.6) No 195 (64.8) 65 (54.6) 130 (71.4) Limb immobilization 20.670 0.000 Availability 188 (62.5) 93 (78.2) 95 (52.2) Unavailability§ 113 (37.5) 26 (21.8) 87 (47.8) Needle adjustment 14.446 0.000 Yes∥ 134 (44.5) 69 (58.0) 65 (35.7) No 167 (55.5) 50 (42.0) 117 (64.3)*Opened IV: the nonintegrated PIVC was the Introcan Safety Catheter (B Braun), Connecta 10-cm extension set (BD), and SmartSite needleless connector (BD), as per local hospital standard care. Closed IV: the integrated PIVC was the NexivaTM Closed IV Catheter System Dual Port with SmartSite needleless connector (BD).
†Fisher exact test.
‡The worse vascular condition is conformed with (a) the blood vessel is hidden under the fatty tissue, and the naked eye cannot identify the direction of the blood vessel, and (b) the vessel is not elastic and well filled.
§Unavailability: closed IV—none U fixation or U fixation is performed, but the extension tube is not in the same plane as the punctured plane; opened IV—the isolation plug is partially reinforced.
∥The needle adjustment: the child was significantly moving during venipuncture, and the needle was inserted into the blood vessel after adjustment.
Data are presented as n (%) or median (p25–p75).
Bold values denote statistical significance at the P < 0.05 level.
*Fisher exact test.
†Pressing on the site of insertion, such as playing games or using a phone/pad, and the extensive range of moving the limb with IV, such as violent kicking and throwing hands.
‡Evaluation is conformed in every infusion and changes shifts, with withdrawn blood, IV flow, the skin condition around the puncture point (e.g., pain/tenderness, erythema, swelling, infiltration or chief complaint), measure the external catheter length change, indwelling time of catheter, the dressing integrity, and indwelling time.
§Timely change dressing including itching, allergy, and others; bleeding and exudation; the dressing integrity becomes compromised; and follow the replacement time recommended by dressing manufacturers.
Comparing the 2 groups (SAC 4 and SAC 3) showed 16 variables with statistically significant (P < 0.05; Tables 1, 3, 4). The multivariable logistic regression analyses of significant predictors were (Table 5): the worse vascular condition (OR, 3.603; 95% CI, 1.995–6.665), insufficient limb immobilization (OR, 2.587; 95% CI, 1.381–4.944), needle adjustment in venipuncture (OR, 2.112; 95% CI, 1.143–3.957), the longer infusion length (OR, 1.115; 95% CI, 1.046–1.198), the faster infusion speed (OR, 1.012; 95% CI, 1.003–1.021), and site of insertion (wrist versus hand; OR, 0.367; 95% CI, 0.181–0.726) were independent risk factors (P < 0.05) of the moderate group. The worse vascular condition is conformed to (a) the blood vessel is hidden under the fatty tissue, and the naked eye cannot identify the direction of the blood vessel, and (b) the vessel is not elastic and well filled.
TABLE 5 - Prediction Factors of the Severity Resulting From PIVC Complications Variable β OR 95% CI P Site of insertion 0.124 0.036–0.387 0.001 Foot versus hand −2.084 0.888 0.397–2.004 0.772 Forearm versus hand −0.119 0.404 0.111–1.377 0.152 Head versus hand −0.907 2.099 0.705–7.228 0.204 Wrist versus hand 0.741 0.367 0.181–0.726 0.005 Vascular condition Bad versus good −1.002 3.603 1.995–6.665 <0.001 Limb immobilization Unavailability versus availability 1.282 2.587 1.381–4.944 0.003 Needle adjustment in venipuncture Yes versus no 0.951 2.112 1.143–3.957 0.018 Infusion speed 0.747 1.012 1.003–1.021 0.010 Infusion length 0.011
留言 (0)