
記住我
Emerging research underscores the potential long-term cognitive implications of anaesthesia and surgery.1 In particular, postoperative delirium (POD) and postoperative cognitive dysfunction (POCD) have been recognized as two separate, albeit-related, cognitive impairment parameters discernible through neuropsychological testing at various points postsurgery.2 Delirium is characterized by sudden shifts in mental status, including fluctuations in consciousness and difficulties with concentration.2 POD, a specific form of delirium, is not related to the emergence from anaesthesia, whereas POCD refers to decline in cognitive function, principally in memory and executive functions, which may persist for months or even years postsurgery.2,3
The implications of these phenomena intimate a possible shared pathogenesis between Alzheimer's disease and postoperative cognitive decline.4–6 Both in-vitro and in-vivo studies have suggested that anaesthesia and surgery contribute to key Alzheimer's disease pathological processes, such as the genesis of amyloid-β (Aβ) plaques7,8 and tau phosphorylation.9–11 Remarkably, previous studies have demonstrated that obstructing these processes can enhance postoperative memory in mouse models.12,13
Regarding neuropathogenesis of Alzheimer's disease, β-amyloid proteins – namely Aβ40 and Aβ42 – are crucial constituents of senile plaques found in Alzheimer's disease patients, whereas tau is the primary protein component of neurofibrillary tangles in neurons.14 A reduction in Aβ42 concentration signifies an accumulation of Aβ in amyloid plaques,15,16 whereas an increase in T-tau levels reflects the extent of axonal degeneration,17,18 and an elevation in P-tau levels corresponds to the presence of neurofibrillary tangles in the brain.19 Despite the potential of these Alzheimer's disease biomarkers to predict POD or cognitive changes, study outcomes have been inconsistent to date.20–22
In light of these considerations, we conducted a meta-analysis, the first of its kind in this field, to determine if perioperative Alzheimer's disease biomarkers in blood or cerebrospinal fluid (CSF) can serve as predictive markers for POD and POCD.
Methods Search strategy and selection criteriaOur meta-analysis was performed in accordance with a protocol registered on INPLASY (ID: INPLASY202350001, DOI: 10.37766/inplasy2023.5.0001). This manuscript conforms to the PRISMA (Preferred Reporting Items for Systematic Reviews and Meta-Analyses) guidelines.23 Two independent reviewers performed a search for studies published before March 2023 that investigated Alzheimer's disease biomarkers in the blood or CSF of surgical patients experiencing POD or POCD. The search spanned databases such as PubMed, Embase, Web of Science and Cochrane, combining comprehensive text words and Medical Subject Heading (MeSH) terms such as ‘delirium’ or ‘cognitive changes’ and ‘amyloid’ or ‘tau’. The detailed search strategy can be found in Supplementary Material S1, https://links.lww.com/EJA/A892. We limited the search to publications in English or Chinese.
The inclusion criteria for studies were as follows: studies involving surgical patients aged at least 18 years, studies focusing on POD or POCD, research involving Alzheimer's disease biomarkers, including Aβ or tau in blood or CSF and availability of full text (comprehensive information). The exclusion criteria were as follows: studies with lack of data suitable for pooling analysis, studies not involving humans and articles not in English or Chinese.
Data extraction and synthesisThe search results were reviewed independently by two reviewers who extracted data based on the inclusion criteria, and a third reviewer cross-checked their findings. Essential information from each article, including author and year of publication; title; sample size; anaesthesia type; type of surgery; time of blood or CSF sample; biomarkers; preoperative cognitive assessment and diagnostic methods for POD or POCD, were meticulously documented. In cases of multiple publications from the same trial, only the most recent publication with the most comprehensive data was included. Any disagreements were resolved by consensus.
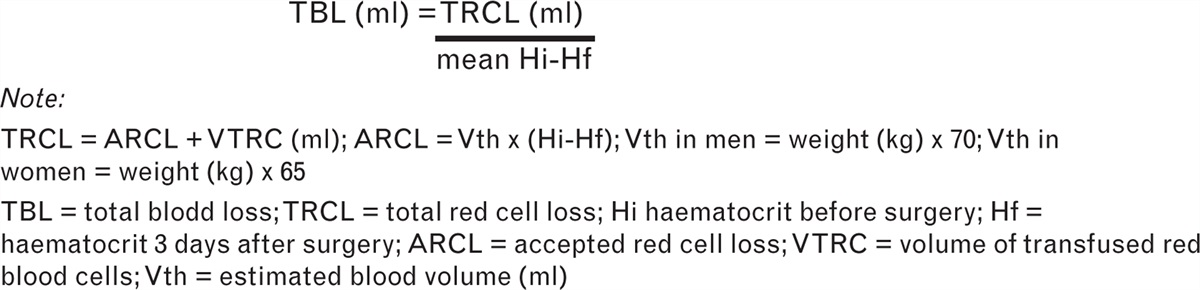
Quantitative data, including mean and standard deviation (SD) of biomarker levels, sample sizes of POD and POCD cases and control groups, were extracted from the studies. In cases where studies reported only the median, minimum, maximum and/or quartile range, we used the formula proposed by Wan et al.24 to estimate the mean and SD. If authors did not provide mean ± SD of biomarker levels but provided graphical data in the article, we used ImageJ software (version 1.53a, National Institutes of Health, Bethesda, Maryland, USA) to extract these values. This software is publicly available for download (http://rsbweb.nih.gov/ij/download.html).
Study quality assessmentTwo authors independently assessed the quality of each study using the Newcastle–Ottawa Scale (NOS).25 The NOS scores range from 0 to 9, calculated based on three main aspects: selection of the study group (0 to 4 stars), comparability of the study group (0 to 2 stars) and determination of exposure and outcome in case–control and cohort studies (0 to 3 stars). Studies receiving scores of 7 to 9 stars, 4 to 6 stars and 0 to 3 stars were deemed to be of high quality, medium quality and low quality, respectively. Any disagreements were resolved through discussion and consensus.
Statistical analysisWe calculated the mean difference (MD) and 95% confidence interval (CI) of each biomarker as a continuous outcome using both fixed-effects and random-effects models. These two effects models assign different weights to each study. In the fixed-effects model, the assignment of weights is closely related to the sample size, and studies with large samples contribute a greater value to the total combined effect size relative to studies with small samples, resulting in small-sample studies being more likely to be ignored. In contrast, the total effect size of the random-effects model is the mean value of the true effect size of each study, and the random-effects model assigns greater weight to small-sample studies compared with the fixed-effects model, but its CI is larger than that of the fixed-effects model, making it more difficult to detect differences. In the presence of significant heterogeneity, we preferred the classic DerSimonian and Laird random-effects meta-analysis method, which accounts for variations between studies. The meta-analysis findings are presented in the Results section. To quantify heterogeneity among the combined results, we used the Q statistic via the chi-square test, and calculated the I2 index to assess the impact of heterogeneity.26 The I2 index describes the percentage of total between-study variation attributable to heterogeneity rather than chance and ranges from 0 to 100%. A value of 0% indicates that no heterogeneity was observed, whereas larger values indicate greater heterogeneity. We evaluated the presence of statistical heterogeneity among the study results using the I2 statistic, considering heterogeneity to be significant when P less than 0.10 and I2 greater than 50%. In the absence of heterogeneity (heterogeneity P > 0.1), a fixed-effects model was utilised to calculate the pooled effect. If heterogeneity was significant, a random-effects model was used. We examined publication bias using funnel plots and Egger's test. All statistical analyses were conducted using RevMan version 5.4.1 Mac, The Nordic Cochrane Center, Copenhagen, Denmark (http://tech.cochrane.org/revman/download). Two-sided hypothesis tests were used for P values, and a statistical significance threshold was set at P less than 0.05. The overall quality of the evidence was graded using the GRADE classification,27 and the results are displayed in supplement S2, https://links.lww.com/EJA/A893.
In sensitivity analysis, we sought to ensure the reliability of our results using the trim-and-fill method or different effect models.
To address potential issues related to low sample sizes and the repeated testing of significance in included studies, which can increase the risk of random errors,28 we conducted a trial sequential analysis (TSA) using version 0.9 beta software of TSA (Copenhagen Trial Unit, Centre for Clinical Intervention Research, Copenhagen, Denmark) (http://www.ctu.dk/tsa). This analysis was performed to further validate the reliability of the results obtained from the sensitivity analysis using RevMan software, where the heterogeneity was less than 75%.29 TSA was employed to ascertain whether the CI and P values in our meta-analysis were adequate to demonstrate the expected effect.30 The TSA model settings are as follows: effect measure is ‘mean difference’, model is ‘fixed-effect’, type I error (α) is 5%, power (1-β) is 80%, heterogeneity correction based on model variance and mean difference and variance based on empirical assumptions, all automatically generated by the software. We calculated the required sample size adjusted for our meta-analysis and established the trial sequential monitoring boundaries (TSMB).
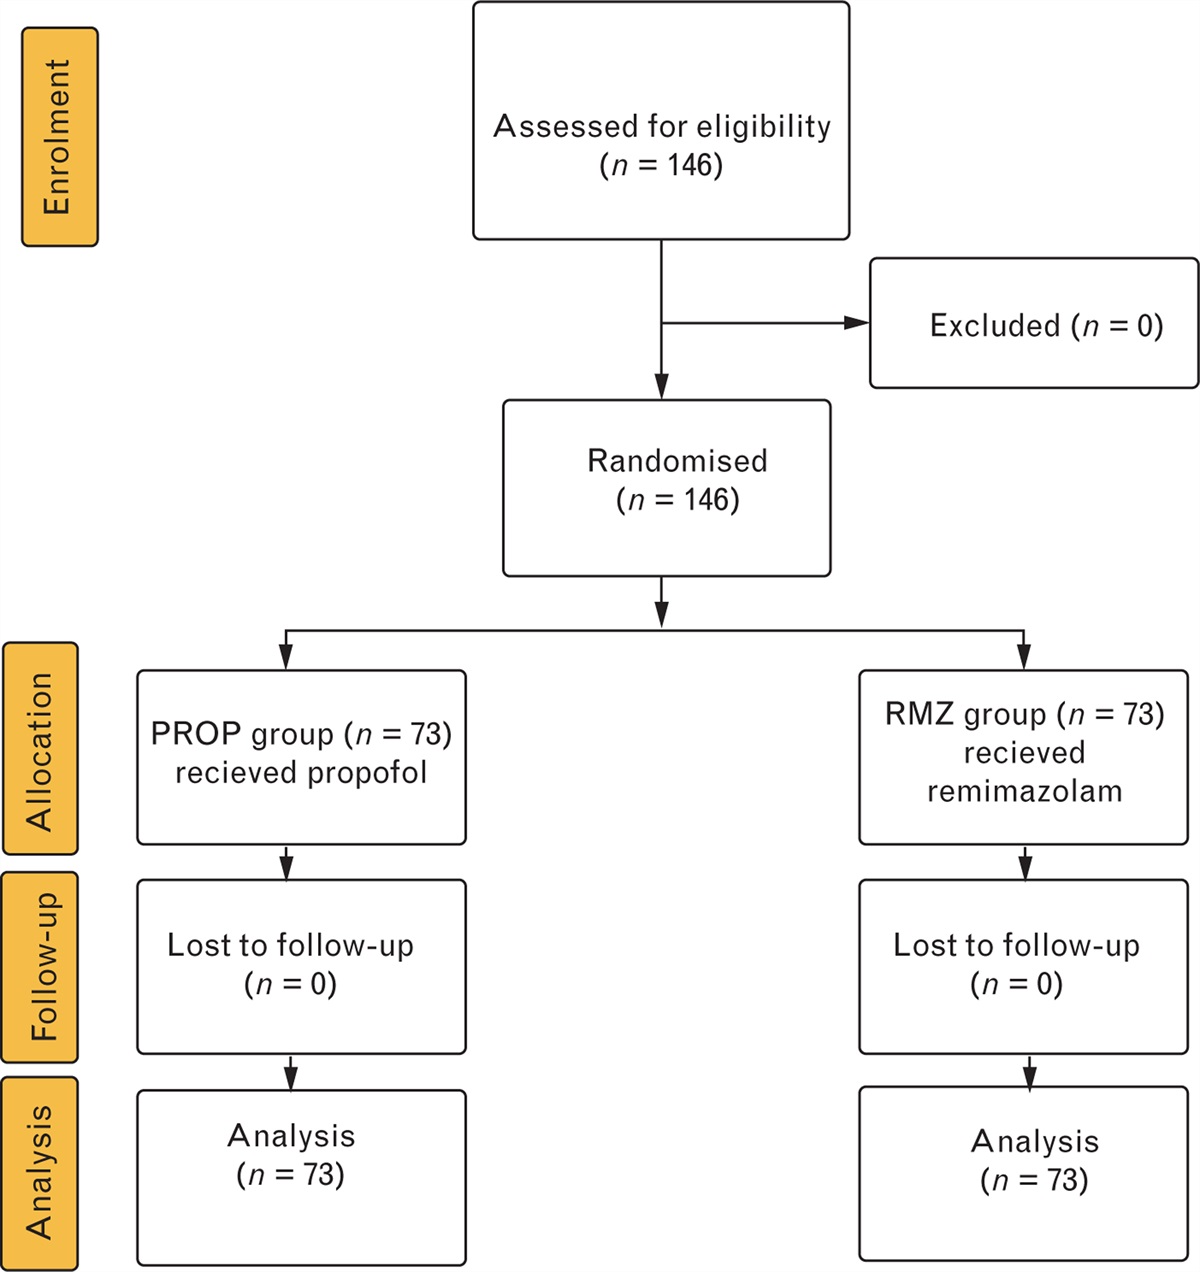
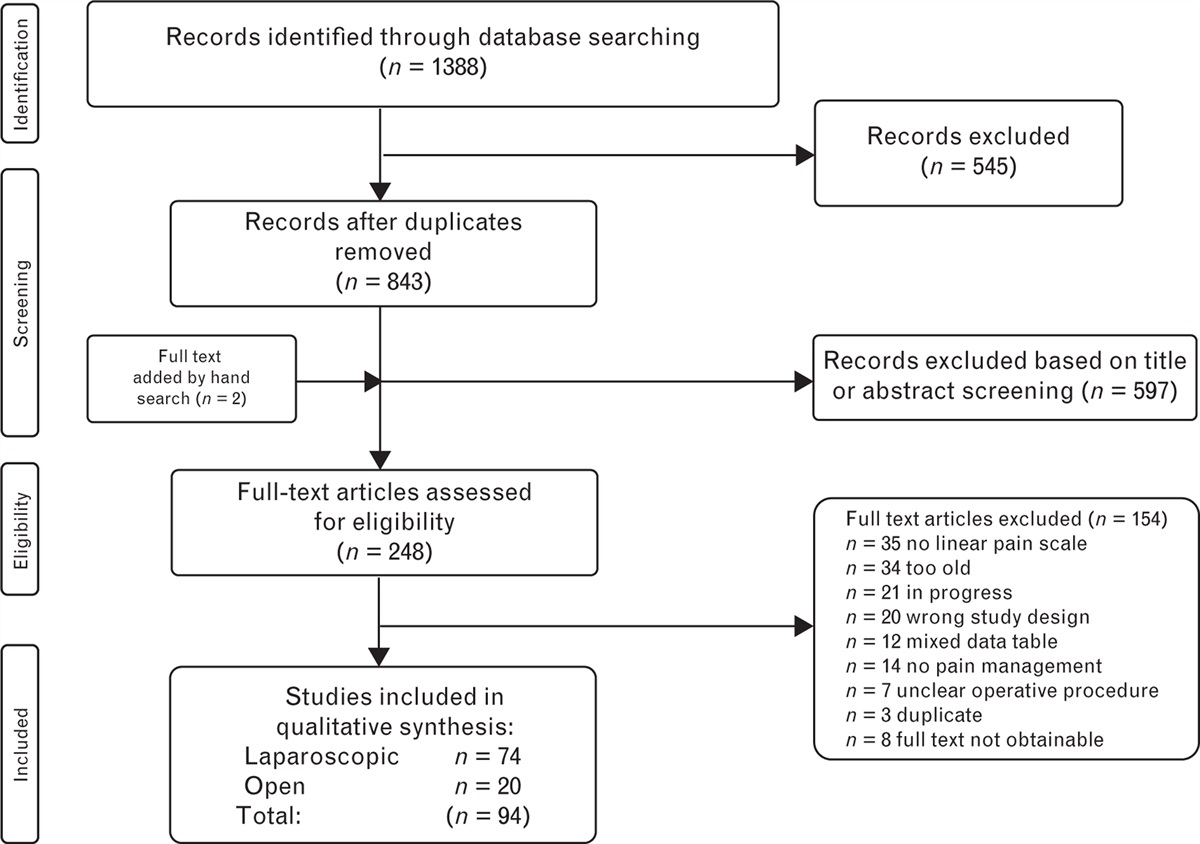
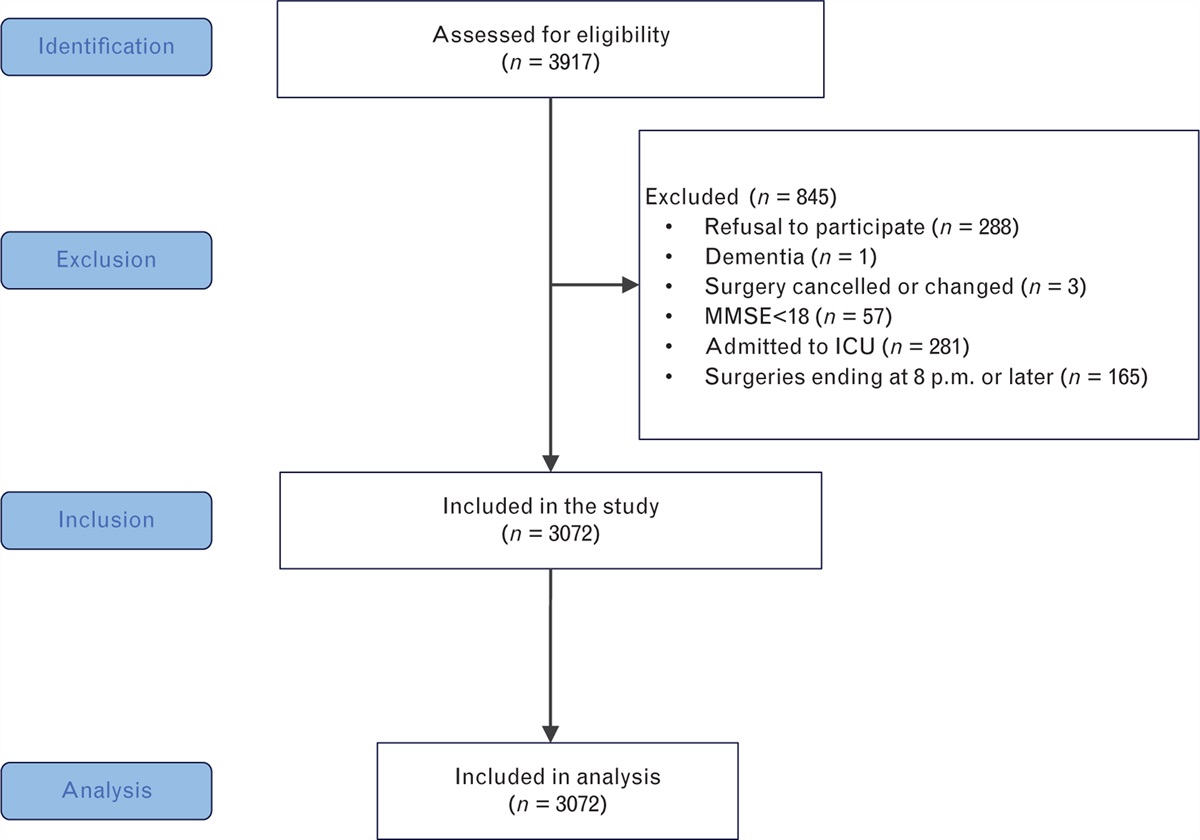
ResultsThe detailed search process is presented in Supplement S3, https://links.lww.com/EJA/A894. Our meta-analysis included a total of 15 studies: six on POD and nine on POCD (Supplement S3, https://links.lww.com/EJA/A894).21,22,31–43 The excluded studies and the reasons for their exclusion are shown in Supplement S4, https://links.lww.com/EJA/A895. All included studies were either government-funded or unfunded, and the funders were not involved in any part of the research. The technique used for biomarker measurements in the included studies was the commonly used ELISA. The patient and clinical characteristics of these studies are summarised in Table 1. However, it is worth noting that although the studies we included are all about POD and POCD, the definition of POCD in some of the studies does not adhere to the ‘Recommendations for the Nomenclature of Cognitive Change Associated with Anaesthesia and Surgery-2018’.44 In the current nomenclature, the accurate terminology should be ‘delayed neurocognitive recovery’ (DNCR) before day 30, and the exact terminology would be POCD after day 30. Due to the limited data available for this meta-analysis, we still combined the two components in our calculations. The high quality of the included articles is evidenced by their mean ± SD NOS scores of 7.25 ± 0.46 for POD and 7.56 ± 0.53 for POCD. No article was excluded because of the quality of the study. Funnel plots and Egger's test of all outcomes did not reveal significant publication bias.
Table 1 - Demographic and clinical characteristics of enrolled studies POD First author and publication year Title No. of case/control Anaesthesia type Surgery type Time of draw Biomarkers Preoperative cognitive assessment Methods used to diagnose POD Time of cognitive evaluation Deng X 202230 Cohort Analysis of the Association of Delirium Severity With Cerebrospinal Fluid Amyloid-Tau-Neurodegeneration Pathologies 123/534 Spinal-epidural anaesthesia (PNDABLE database) laparoscopic colorectal cancer resection and knee or hip arthroplasty Pre-Op Aβ40, Aβ42, t-tau, p-tau (CSF) Yes: MMSE CAM Twice a day on Postop days 1 to 7 (or before dis- charge) Fong TG 202131 Association of CSF Alzheimer's disease biomarkers with postoperative delirium in older adults 6/53 Spinal anaesthesia knee and hip arthroplasty Pre-Op Aβ40, Aβ42, t-tau, p-tau (181) (CSF) Yes: neuropsychological testing CAM Post-Op day 1 until discharge Cunningham EL 201932 CSF Beta-amyloid 1-42 Concentration Predicts Delirium Following Elective Arthroplasty Surgery in an Observational Cohort Study 40/242 Spinal anaesthesia (combined general anaesthesia in some patients) elective hip or knee arthroplasty Pre-Op Aβ42, t-tau, p-tau (CSF) Yes: MMSE CAM Post-Op day 1, post-Op day 2, post-Op day 3 Idland AV 201733 Preclinical Amyloid-beta and Axonal Degeneration Pathology in Delirium 16/49 Spinal anaesthesia hip arthroplasty Pre-Op Aβ42, T-tau, and P-tau (CSF) Yes: IQCODE CAM Preoperative and postoperative until discharge Xie Z 201423 Preoperative cerebrospinal fluid beta-Amyloid/Tau ratio and postoperative delirium 31/122 Spinal anaesthesia total hip/knee replacement Pre-Op Aβ40, Aβ42, tau (CSF) No CAM Post-Op day 1, Post-Op day 2 Witlox 201122 Cerebrospinal fluid beta-amyloid and tau are not associated with risk of delirium: a prospective cohort study in older adults with hip fracture 30/46 Spinal anaesthesia hip arthroplasty Pre-Op Aβ42, t-tau, p-tau (CSF) Yes: MMSE and IQCODE CAM Pre-Op post-Op day 1, Post-Op day 2, post-Op day 3, post-Op day 4, post-Op day 5 DNCR or POCD First author and publication year title No. of case/control Anaesthesia type Surgery type Time of draw Biomarkers Preoperative cognitive assessment Methods used to diagnose POCC Time of cognitive evaluation Danielson M 202134 Association between cerebrospinal fluid biomarkers of neuronal injury or amyloidosis and cognitive decline after major surgery. 6/21 Spinal anaesthesia Knee or hip replacement Pre-Op 4, 8, 24, 32, and 48 h after skin incision T-tau, NFL, NSE, Aβ42 (CSF and blood) Yes: MMSE, and a battery of seven neuropsychological tests A battery of seven neuropsychological tests Preop post-Op days 2 to 5, post-Op 3 months Zhang X 202135 Correlation of cerebrospinal fluid amyloid beta-protein 42 and neurofilament light protein levels with postoperative neurocognitive dysfunction in elderly patients 38/52 Combined spinal-epidural anaesthesia Knee or hip replacement Pre-Op Aβ42, NFL (CSF) Yes: a battery of six neuropsychological tests A battery of six neuropsychological tests Preop post-Op day 7 Wu Z 201836 Ratio of beta-amyloid protein (Abeta) and Tau predicts the postoperative cognitive dysfunction on patients undergoing total hip/knee replacement surgery. 32/48 Combined spinal-epidural anaesthesia Total hip arthroplasty or total knee replacement Pre-Op Aβ42, tau (CSF) Yes: MMSE, and a battery of two neuropsychological tests A battery of two neuropsychological tests Preop post-Op day 7, post-Op 1 month, post-Op 3 months Liang B 201637 Correlations of plasma concentrations of β-amyloid peptide and S-100β with postoperative cognitive dysfunction in patients undergoing oral and maxillofacial cancer surgery 37/78 General anaesthesia Oral and maxillofacial cancer surgeries Pre-Op Post-Op day 1, day 7 Aβ40, S-100β (blood) Yes: a battery of five neuropsychological tests A battery of five neuropsychological tests Preop post-Op day 7 ,Evered L 201638 Cerebrospinal Fluid Biomarker for Alzheimer Disease Predicts Postoperative Cognitive Dysfunction. 11/46 Combined spinal and general anaesthesia Elective total hip replacement Pre-Op Aβ42, T-tau, P-tau, NFL (CSF) Yes: MMSE, CDR and a battery of eight neuropsychological tests A battery of eight neuropsychological tests Preop post-Op day 7, post-Op 3 months Li XM 201439 Relationship between postoperative cognitive dysfunction and regional cerebral oxygen saturation and beta-amyloid protein. 21/25 General anaesthesia Elective laparoscopic pancreaticoduodenectomy Pre-Op Post-Op day 1 Aβ (blood) Yes: a battery of five neuropsychological tests A battery of five neuropsychological tests Preop post-Op day 7 Li X 201340 Increase of beta-amyloid and C-reactive protein in liver transplant recipients with postoperative cognitive dysfunction. 11/14 General anaesthesia Liver transplantation Preop, 30 min after the start of the anhepatic phase 3 h after reperfusion of the new liver Postop 24 h Aβ, CRP (blood) Yes: a battery of six neuropsychological tests A battery of six neuropsychological tests Preop post-Op day 7 Ji MH 201341 Changes in plasma and cerebrospinal fluid biomarkers in aged patients with early postoperative cognitive dysfunction following total hip-replacement surgery. 15/46 Spinal anaesthesia Elective total hip-replacement Pre-Op (CSF and blood) Post-Op day 7 (blood) Aβ40, T-tau, P-tau, BDNF, IL-6, IL-1β (CSF) IL-1β, IL-6, BDNF, CRP, MDA (blood) Yes: MMSE and a battery of three neuropsychological tests A battery of three neuropsychological tests Preop post-Op day 7 Evered LA 200942 Plasma amyloid beta42 and amyloid beta40 levels are associated with early cognitive dysfunction after cardiac surgery 40/269 General anaesthesia Elective CABG surgery Pre-Op Aβ40, Aβ42 (blood) Yes: a battery of eight neuropsychological tests A battery of eight neuropsychological tests Preop post-Op 3 months. post-Op 12 monthsBDNF, brain-derived neurotrophic factor; CAM, confusion assessment method; CRP, C-reactive protein; CSF, cerebrospinal fluid; DNCR, delayed neurocognitive recovery; IQCODE, informant questionnaire on cognitive decline in the elderly; MDA, malonaldehyde; MMSE, mini-mental state examination; NFL, neurofilament light; NSE, neurone-specific enolase; POCD, postoperative cognitive dysfunction.
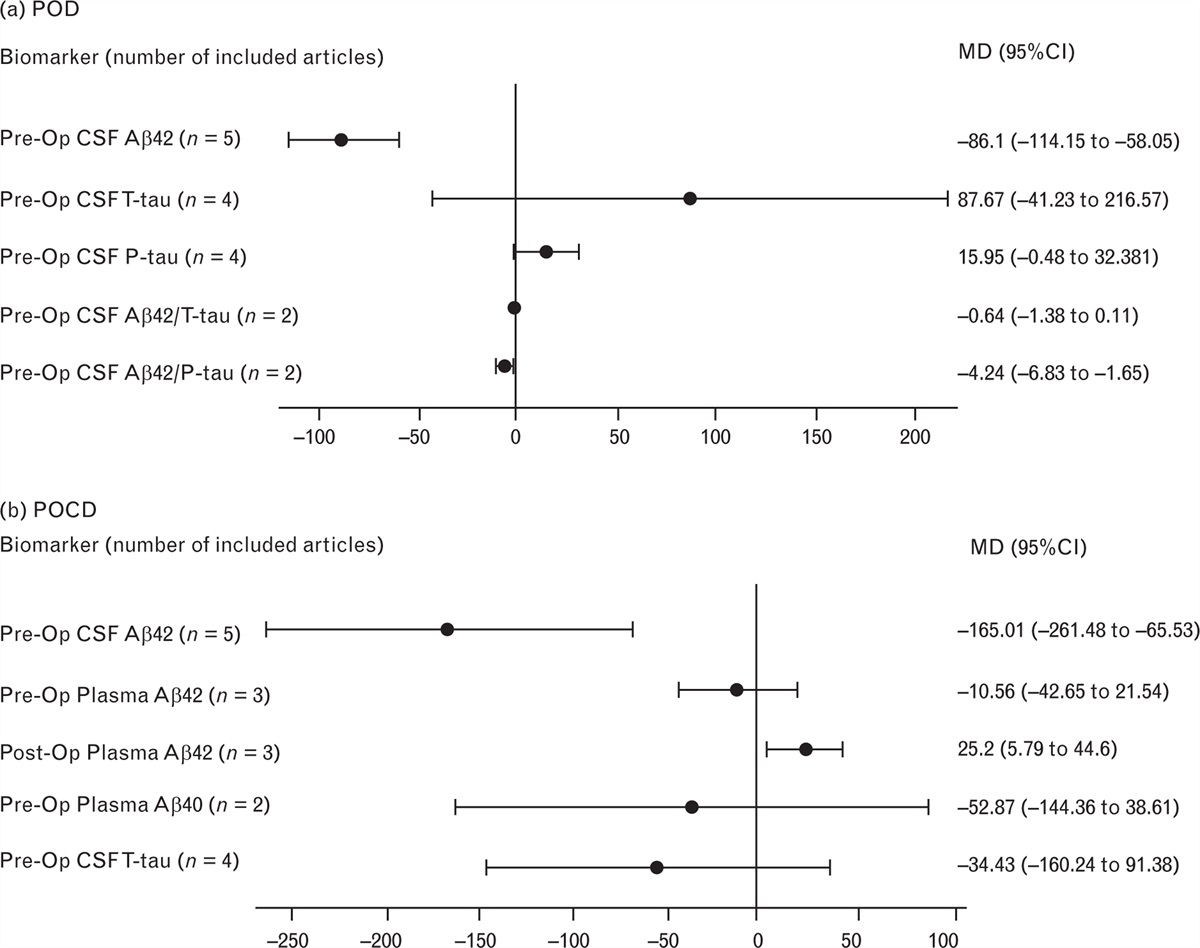
Figure 1 illustrates the meta-analysis results regarding the correlations between Alzheimer's disease biomarkers and POD (Fig. 1, part a) or DNCR or POCD (Fig. 1, part b). These biomarkers include both CSF-based biomarkers (Aβ42, T-tau, P-tau, Aβ42/T-tau, Aβ42/P-tau) and blood-based biomarkers (Aβ40 and Aβ42).
 Fig. 1:
 Meta-analysis results: (a) correlations between AD biomarkers and POD, (b) correlations between AD biomarkers and POCD.
Alzheimer's disease biomarkers and postoperative deliriumFigure 2 presents the associations between Alzheimer's disease biomarkers and POD. The meta-analysis, which included five studies comprising a total of 1139 participants,21,31–34 revealed a negative correlation between preoperative CSF Aβ42 levels and POD (−86.1, 95% CI, −114.15 to −58.05, I2: 47%) (Fig. 2, part a). This conclusion is corroborated by TSA results (Fig. 3, part a). Importantly, Egger's test for this outcome did not reveal any significant publication bias (P = 0.162). Furthermore, pooled data from two studies with 347 participants indicated a negative correlation between preoperative CSF Aβ42/P-tau levels and POD (−4.24, 95% CI, −6.83 to −1.65, I2: 65%) (Fig. 2, part b).33,34 However, the TSA for this outcome did not provide sufficient evidence, as the Z-curve did not intersect the TSMB trial, suggesting uncertainty (Fig. 3, part b). In contrast, no significant associations were found between POD and other preoperative CSF Alzheimer's disease biomarkers, including preoperative CSF P-tau level (n = 4, 15.95, 95% CI, −0.48 to 32.381, I2: 77%) (Fig. 2, part c),21,31,32,34 T-tau level (n = 4, 87.67, 95% CI, −41.23 to 216.57, I2: 85%) (Fig. 2, part d),21,31,32,34 or Aβ42/T-tau level (n = 2, −0.64, 95% CI, −1.38 to 0.11, I2: 86%) (Fig. 2, part e).22,34
 Fig. 2:
 Forest plot showing the associations between AD biomarkers and POD: (a) pre-operative CSF Aβ42 levels and POD, (b) pre-operative CSF Aβ42/P-tau and POD, (c) pre-operative CSF P-tau levels and POD, (d) pre-operative T-tau levels and POD, (e) pre-operative CSF Aβ42/T-tau and POD.
 Fig. 3:
 Trial sequential analysis showing the associations between AD biomarkers and POD: (a) pre-operative CSF Aβ42 levels and POD, (b) pre-operative CSF Aβ42/P-tau and POD.
Alzheimer's disease biomarkers and delayed neurocognitive recovery or postoperative cognitive dysfunctionThe correlations between Alzheimer's disease biomarkers and DNCR or POCD are elucidated in Fig. 4. The pooled data from five studies including a total of 313 participants revealed a negative correlation between preoperative CSF Aβ42 levels and postoperative cognitive function changes (−165.01, 95% CI, −261.48 to −65.53, I2: 95%) (Fig. 4, part a).35–37,39,42 Egger's test for this outcome did not show the presence of publication bias (P = 0.248). We used the trim-and-fill method to validate the reliability of the results and obtained the same conclusion. The TSA further substantiated this conclusion based on these five studies (Fig. 5).35–37,39,42 Additionally, data pooled from three studies, which involved 98 participants, showed a positive correlation between postoperative plasma Aβ42 levels and DNCR or POCD (25.20, 95% CI, 5.79 to 44.60, I2: 96%) (Fig. 4, part b).34,40,41 Conversely, no significant associations were identified between DNCR or POCD and preoperative plasma Aβ42 level (n = 3, −10.56, 95% CI, −42.65 to 21.54, I2: 90%) (Fig. 4, part c),35,41,43 preoperative plasma Aβ40 level (n = 2, −34.43, 95% CI, −160.24 to 91.38, I2: 97%) (Fig. 4, part d),38,43 or preoperative CSF T-tau level (n = 4, −52.87, 95% CI, −144.36 to 38.61, I2: 91%) (Fig. 4, part e).35,37,39,42
 Fig. 4:
 Forest plot showing the associations between AD biomarkers and POCD: (a) pre-operative CSF Aβ42 levels and POCD, (b) post-operative plasma Aβ42 levels and POCD, (c) pre-operative plasma Aβ42 levels and POCD, (d) pre-operative Aβ40 levels and POCD, (e) pre-operative CSF T-tau levels and POCD.
 Fig. 5:
 Trial sequential analysis showing the associations between pre-operative CSF Aβ42 levels and POCD.
Sensitivity analysisAs shown in Figs. 2 and 4, significant study heterogeneity affected most of the analyses, particularly for studies of associations between preoperative CSF P-tau and POD (I2 = 77%, P = 0.004), preoperative CSF T-tau and POD (I2 = 85%, P = 0.0002), preoperative CSF Aβ42/T-tau and POD (I2 = 86%, P = 0.008), preoperative CSF Aβ42 and DNCR or POCD (I2 = 95%, P < 0.00001), postoperative plasma Aβ42 and DNCR or POCD (I2 = 96%, P < 0.00001), preoperative plasma Aβ42 and DNCR or POCD (I2 = 90%, P < 0.00001), preoperative plasma Aβ40 and DNCR or POCD (I2 = 97%, P < 0.00001) and preoperative CSF T-tau and DNCR or POCD (I2 = 91%, P < 0.00001). Based on this, we conducted a sensitivity analysis of all results using the RevMan software, applying various effect models to validate the reliability of the results. The results of this sensitivity analysis are summarised in Table 2.
Table 2 - Sensitivity analysis POD Biomarker (number of included articles) Fixed effect model Random effects model MD (95% CI) P value MD (95% CI) P value Pre-Op CSF Aβ42 (n = 5) −86.1 (−114.15 to −58.05) <0.00001 138.99 (101.67 to 176.34) <0.0001 Pre-Op CSF T-tau (n = 4) 138.99 (101.67 to 176.34) <0.00001 87.67 (−41.23 to 216.57) 0.18 Pre-Op CSF P-tau (n = 4) 20.49 (16.25 to 24.72) <0.00001 15.95 (−0.48 to 32.381) 0.06 Pre-Op CSF Aβ42/T-tau (n = 2) 0.51 (−0.77 to −0.25) 0.0001 −0.64 (−1.38 to 0.11) 0.09 Pre-Op CSF Aβ42/P-tau (n = 2) −3.89 (−5.31 to −2.47) <0.00001 −4.24 (−6.83 to −1.65) 0.001 DNCR and POCD Biomarker (number of included articles) Fixed effect model Random effects model MD (95% CI) P value MD (95% CI) P value Pre-Op CSF Aβ42 (n = 5) −57.01 (−71.45 to −42.56) <0.00001 −165.01 (−261.48 to −68.53) <0.00001 Pre-Op Plasma Aβ42 (n = 3) 2.02 (−2.59 to 6.62) 0.39 −10.56 (−42.65 to 21.54) 0.52 Post-Op Plasma Aβ42 (n = 3) 9.92 (7.14 to 12.7) <0.00001 25.2 (5.79 to 44.6) 0.01 Pre-Op Plasma Aβ40 (n = 2) −5.48 (−25.78 to 14.83) 0.6 −34.43 (−160.24 to 91.38) 0.59 Pre-Op CSF T-tau (n = 4) 3.52 (−17.33 to 24.37) 0.74 −52.87 (−144.36 to 38.61) 0.26CI, confidence interval; DNCR, delayed neurocognitive recovery; MD, mean difference; POCD, postoperative cognitive dysfunction; POD, postoperative delirium.
To our knowledge, this meta-analysis is the first study to examine the correlation between Alzheimer's disease biomarkers and the incidence of POD and DNCR or POCD. The robust evidence from TSA complemented our findings of a negative association between preoperative CSF Aβ42 levels and both POD and DNCR or POCD.
Previous research has established an association between POD with early POCD at 7 days and demonstrated that delirious patients have a 14-fold increased risk of developing POCD.45,46 Nevertheless, there remains controversy regarding biomarkers for POD and POCD. These biomarkers include apolipoprotein E4 allele (APOE ε4 allele), IL-1β, IL-6, IL-8, IL-10, C-reactive protein (CRP), tumour necrosis factor (TNF)-α, S100β, neuron-specific enolase (NSE) and neurofilament light chain (NFL). APOE ε4 allele is thought to be involved in amyloid plaque deposition and play an important role in attention deficit disorder and other neurological disorders.47 Hsiao et al.48 found that the APOE ε4 allele is genetically associated with short-term and medium-term postoperative neurologic dysfunction. The relationship between POD and biomarkers for dementia (such as IL-1β, IL-6, IL-8, IL-10, CRP, TNF-α, S100β, NSE and NFL) has been discussed by Wang et al.49 In their meta-analysis, they found that two inflammatory biomarkers (IL-6 and CRP) were significantly associated with POD, and two neuronal injury biomarkers (S100β and NFL) were positively associated with POD. In addition, no significant relationship was found between IL-1β, IL-8, IL-10, TNF-α, S100β and NSE. However, because of insufficient data, they did not analyse the correlation between amyloid and tau levels and POD. Therefore, our meta-analysis fills this research gap by investigating the relationships between Alzheimer's disease biomarkers (amyloid and tau), POD and DNCR or POCD.
In a previous study, the pathogenic peptide Aβ42 level, which is more prevalent in the CSF of Alzheimer's disease patients, showed a decreasing trend.43 Our meta-analysis confirmed this negative correlation between preoperative CSF Aβ42 levels and POD based on five studies.21,31–34 Despite the TSA not reaching the required sample size, the Z-curve crossed the TSMB, indicating that this correlation has reached statistical significance. A similar negative relationship was observed between preoperative CSF Aβ42 levels and DNCR or POCD when pooling data f
留言 (0)