
記住我
Across the field of orthopaedic surgery, fellowships are becoming the standard after residency because more than 90% of orthopaedic graduates pursue at least 1 additional year of subspecialty training.1 Subspecialized training provides additional preparation in areas of interest in line with fellowships (pediatric, arthroplasty, trauma, etc.) while gaining additional clinical expertise before independent employment.1 Over the past decade, the number of pediatric fellowships graduates has grown, keeping up with the growing nationwide pediatric caseload and the increasing number of referrals from other institutions.2,3 This trend has been noted in particular in the context of increased referrals to trauma or teaching hospitals where pediatric orthopaedic surgeons are being relied on for the treatment of injuries such as pediatric supracondylar humerus fractures (SCHFs).4,5
SCHFs are one of the most common injuries in children, accounting for nearly one-fifth of all childhood fractures.6,7 Although SCHFs are treated by general orthopaedics, pediatric orthopaedics, and orthopaedic surgeons who subspecialize in other orthopaedic areas,8 recent trends suggest a change in treatment providers with increasing case referrals and resulting case volumes to specialist centers and pediatric orthopaedic surgeons.4,5 Although pediatric orthopaedic subspecialization has been shown to be beneficial for hospitals,9 the availability of such specialization is not always accessible to all hospitals, forcing more nonspecialist centers to refer care or to proceed with care from other nonpediatric orthopaedic surgeons.10
Previous studies have attempted to examine the difference in complications among types of orthopaedic fellowship-trained surgeons, and experience in the treatment of SCHFs has mixed results.6,8,10–13 Dodds et al showed in a 90-patient cohort treated by pediatric (57) or nonpediatric orthopaedic surgeons (33) that despite differences in intermediate complications (eg, lower rate of open reduction and inadequate fracture fixation), there were no differences in clinical complications (eg, iatrogenic nerve injury, infection, and compartment syndrome), malreductions, or postoperative loss of reduction between providers.10 Silva et al13 subsequently demonstrated that surgeon experience may play a role in reducing the need for open reduction and percutaneous pinning. Recently, Ralles et al14 examined the American Board of Orthopaedic Surgery (ABOS) data set and also found evidence for value of fellowship training, but the analysis was limited to gross complication rates and lacked logistical regressions thus narrowing conclusions. Furthermore, although case volume is an important part of fellowship training, to date no study has further investigated the role of case volume because it relates to fellowship status or surgical complications after supracondylar fracture surgical management.
In light of these contradictory findings, the absence of case volume data, and the ever-increasing movement toward fellowship training, there remains the question of the importance of training specialization and experience and whether it translates to meaningful differences in postoperative complication rates for patients. It is important to continuously evaluate and assess the quality by which subspecialization improves surgical complications rates because such an understanding will allow for better training for orthopaedic residency graduates and broader implications in surgical care in the field. Thus, this study aims to identify pertinent factors in the surgeon-reported surgical complication rates of SCHFs in the training, specialization, and experience of orthopaedic surgeons by using the robust ABOS Part II Examination Case List database, which offers a large, longitudinal review of surgical SCHFs from 1999 to 2016 to better evaluate such factors.
Methods BackgroundAfter completing a 5-year accredited orthopaedic residency program in the United States or Canada, physicians can pursue Board Certification awarded by the ABOS. Certification requires physicians to complete a two-part examination made up of a computer-based multiple-choice examination (Part I) and an oral examination (Part II).15 On completing Part I, applicants become Board Eligible. After a minimum of 20 months of surgical practice in one location leading up to the examination date, a comprehensive list of all surgical procedures performed within a 6-month period (with a minimum of 35 cases) is submitted for review.16–18 This submission tracks a range of information logged by the applicant, reporting their respective fellowship status and demographics and patient and procedural information (patient age and sex, current procedural terminology [CPT] codes, and anesthetic, medical, and surgical complications). Only after review of this submission will applicants be admitted to sit for Part II. All data submitted as part of this process are deidentified and stored for subsequent research purposes through approval from ABOS. On passing Part II, the candidate becomes “Board-certified.”
DataFor our purposes, we queried the database for supracondylar fracture procedures performed between the years of 1999 and 2016, according to the following CPT codes and author-assigned categories: 24538 (simple) and 24545 or 24546 (complex). Each procedure was then grouped by trauma fellowship, pediatrics fellowship, or “other” based on the performing candidate who completed the procedure. The “other” grouping included general orthopaedic surgeons who did not complete a fellowship and candidates who had completed one or more fellowships in fields other than trauma or pediatrics. Procedures performed by candidates who had completed fellowships in both trauma and pediatrics were excluded from the analysis. Patients were also grouped by the number of cases completed by the candidate during their collection period and put into the following groupings: 0 to 15 cases, 16 to 30 cases, and 31+ cases.
AnalysisDemographic information (patient age and sex, geographic region, the year of the procedure, and procedural codes) was collected and analyzed. As coding of complications has changed in the ABOS database in recent years, this study identified surgeon-reported medical complications and surgeon-reported surgical complications that were collected across all years of data collection to ensure consistency of findings. Medical complications recorded across all years of observation were death, myocardial infarction, stroke, renal failure, pulmonary embolism, congestive heart failure, pneumonia, and medical unspecified complications. Surgical complications (bone fracture, dislocation, infection, nonunion/delayed union, skin ulcer/blister, implant failure, nerve palsy/injury, and vascular injury) were similarly recorded across all years and used for analysis. Collected demographic, medical complication, or surgical complication data that were not present across all years were excluded to ensure consistent complication rate data and comparisons. All complications were surgeon-reported. To predict the likelihood of any surgical complications, a binary logistic regression was used based on demographic covariates, including patient age, patient sex, region, year of procedure, fellowship status, procedure type, and number of cases performed. The number of cases and fellowship status were separated into parallel binary logistic regressions because of suspected high degree of collinearity.
All statistical analysis was done using IBM SPSS Statistics for Macintosh (version 26; IBM Corp). Categorical variables across the three cohorts were compared using the chi-square test. Continuous variables were compared using the Student t-test.
This study was submitted to and approved by the ABOS Research Committee and was classified as exempt by our institutional review board.
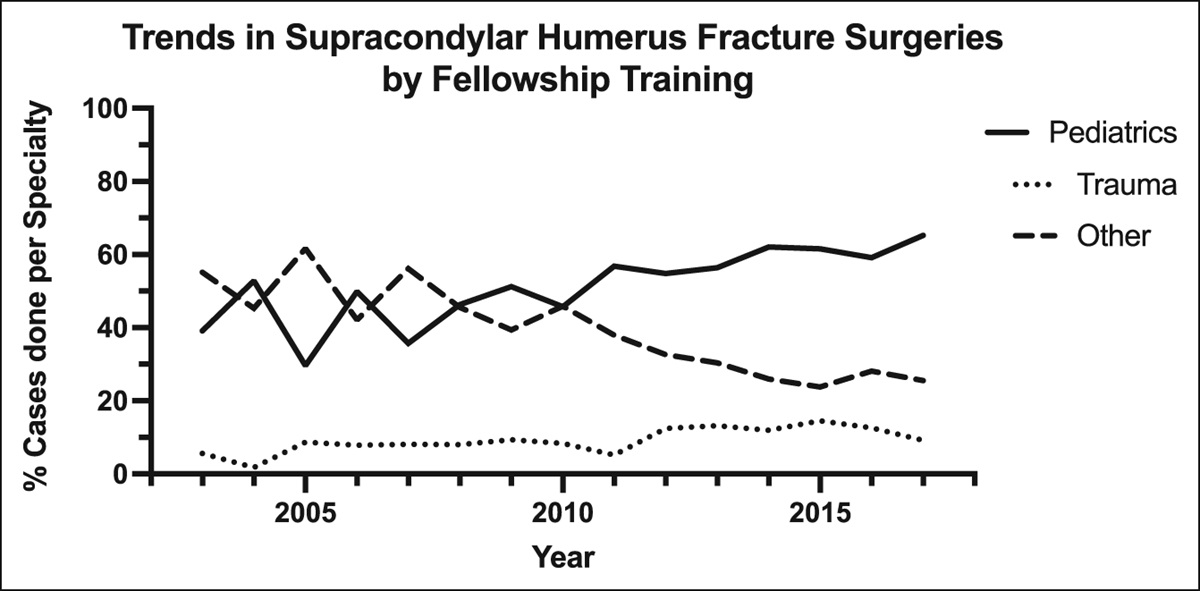
ResultsIn total, 10,961 cases were identified fitting in the inclusion criteria. Of these, 53.47% of cases were done by surgeons with fellowship training in pediatric orthopaedics, 9.66% were fellowship trained in orthopaedic trauma, and the others were done by surgeons with a different subspecialty for fellowship training (Table 1; Figure 1). The average age for cases performed by pediatric, trauma, or other fellowship-trained surgeons was 5.50, 5.83, and 5.68 years, respectively (P < 0.001). Across all patients, a total of 51.84% of surgeries were done in male patients, while 48.16% were in female patients.
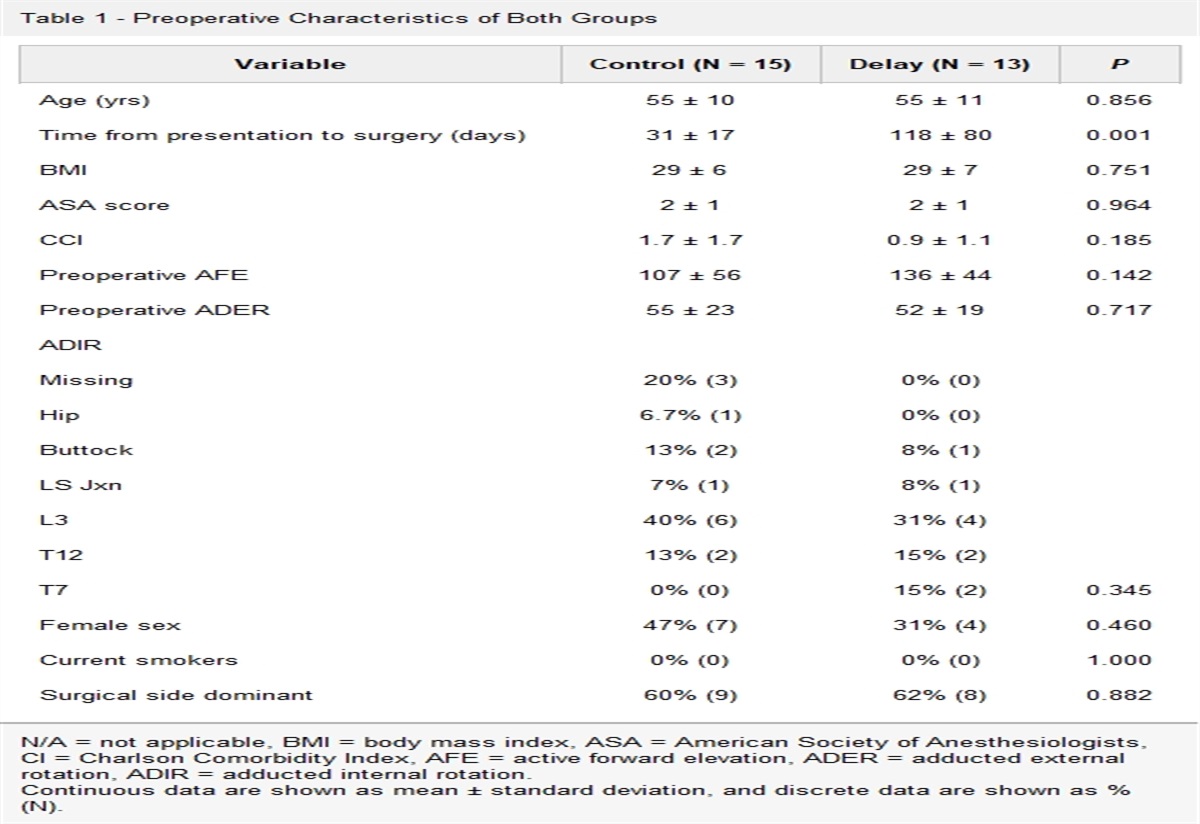
Table 1 - Demographics of Patients, Organized by Fellowship Type of the Treating Physician and Procedure Type Type: Supracondylar Humerus Fracturea Pediatrics Trauma Otherb Univariate P N = 10,961 (100%) N = 5,861 (53.47%) N = 1,059 (9.66%) N = 4,041 (36.87%) Age (SD) 5.50 (2.57) 5.83 (2.78) 5.68 (2.64) <0.001 Sex Male 3,057 (52.16%) 552 (52.12%) 2,073 (51.30%) 0.689 Female 2,804 (47.84%) 507 (47.88%) 1,968 (48.70%) Region Northeast 1,153 (19.67%) 169 (15.96%) 442 (10.94%) <0.001 Northwest 368 (6.28%) 80 (7.55%) 383 (9.48%) Midwest 1,065 (18.17%) 174 (16.43%) 742 (18.36%) South 1,221 (20.83%) 166 (15.68%) 751 (18.58%) Southeast 876 (14.95%) 193 (18.22%) 642 (15.89%) Southwest 1,147 (19.57%) 272 (25.68%) 999 (24.72%) Year of procedure 1999-2004 884 (53.22%) 80 (4.82%) 697 (41.96%) <0.001 2005-2010 1,619 (43.42%) 292 (7.83%) 1,818 (48.75%) 2011-2016 1,538 (27.61%) 687 (12.33%) 3,346 (60.06%) Procedure type (current procedural terminology code) Simple (24538) 5,478 (93.47%) 924 (87.25%) 3,606 (89.24%) <0.001 Complex (24545, 24546) 383 (6.53%) 135 (12.75%) 435 (10.76%)aPatient population only includes pediatric patients aged 15 years or younger.
bOther fellowship specialties include adult reconstruction, foot and ankle, sports medicine, hand/upper extremity, oncology, spine, and shoulder/elbow.
Bold indicates statistical significance (P < 0.05).
 Figure 1:
 Trends in supracondylar humerus fracture surgery by fellowship training.
With the exception of the Northwest United States, surgeries in various geographic regions were most often done by surgeons with pediatric fellowship training (Table 1). Interestingly, pediatric surgeons were the only group that saw a decrease in the total number of cases during in the most recent period. They treated 54.74% of all closed cases and 40.19% of all open cases.
Pediatric-trained surgeons were less likely to have a surgeon-reported surgical complication than their trauma-trained or “other” trained peers, with complications rates of 4.54%, 5.67%, and 6.24% in each of the three groups (P = 0.001; Table 2). This difference stems from a lower rate of skin ulcers/blisters, implant failures, and nerve injuries among patients treated by pediatric surgeons. However, there was a slightly higher rate of nonunion or delayed union in this group compared with trauma-trained surgeons, although still lower than the rate in other subspecialties. No notable difference was detected in the rates of subsequent fracture, infection, limb ischemia, compartment syndrome, or vascular injury between the three types of fellowship training. None of the patients had a dislocation, hemorrhagic episode, or tendinous/ligamentous injury during their postoperative course.
Table 2 - Incidence of Surgical Adverse Events After All Supracondylar Humerus Surgeries, Organized by Fellowship Type of the Treating Physician Type: Supracondylar Humerus Fracture Pediatrics Trauma Other Univariate P a N = 10,961 (100%) N = 5,861 (53.47%) N = 1,059 (9.66%) N = 4,041 (36.87%) Any medical complication 7 (0.12%) 2 (0.19%) 10 (0.25%) 0.319 Any surgical complication 266 (4.54%) 60 (5.67%) 252 (6.24%) 0.001 Bone fracture 3 (0.05%) 0 (0.00%) 3 (0.07%) 0.646 Dislocation 0 (0.00%) 0 (0.00%) 0 (0.00%) 1.000 Infection 89 (1.52%) 12 (1.13%) 56 (1.39%) 0.594 Nonunion/delayed union 3 (0.05%) 0 (0.00%) 8 (0.20%) 0.042 Skin ulcer/blister 13 (0.22%) 3 (0.28%) 23 (0.57%) 0.016 Implant failure 34 (0.58%) 15 (1.42%) 53 (1.31%) <0.001 Nerve palsy/injury 115 (1.96%) 30 (2.83%) 114 (2.82%) 0.012 Hemorrhage 0 (0.00%) 0 (0.00%) 0 (0.00%) 1.000 Limb ischemia 6 (0.10%) 0 (0.00%) 2 (0.05%) 0.412 Tendon ligament/injury 0 (0.00%) 0 (0.00%) 0 (0.00%) 1.000 Compartment syndrome 6 (0.10%) 2 (0.19%) 4 (0.10%) 0.713 Vascular injury 6 (0.10%) 0 (0.00%) 3 (0.07%) 0.550aP < 0.05 was considered significant.
Bold represents statistically significant data.
When comparing the surgeon-reported complication rate for simple percutaneous versus complex open procedures, the same pattern was identified in the percutaneous group. Those treated by pediatric-trained surgeons were less likely to experience a complication than those treated by one of the other groups (4.54% versus 5.67% and 6.24%, P < 0.001; Table 3). No significant difference was observed in complication rates among patients treated in an open manner.
Table 3 - Incidence of Surgical Adverse Events by Fracture Pattern, Organized by Fellowship Type of the Treating Physician Type: Supracondylar Humerus Fracture* Pediatrics Trauma Other Univariate P N = 10,961 (100%) N = 5,861 (53.47%) N = 1,059 (9.66%) N = 4,041 (36.87%) Simple (24538) 206 (3.51%) 43 (4.06%) 201 (4.97%) <0.001 Complex (24545, 24546) 60 (1.02%) 17 (1.61%) 51 (1.26%) 0.245*Significance level set at P = 0.0385 with Boneferroni Correction.
Bold indicates statistical significance (P < 0.05).
In univariate analysis, when stratified by case volume rather than fellowship type, those with 0 to 10 cases were significantly more likely (P = 0.001) to have any surgical complication with 6.01% complications, while those with 10 to 20 cases has 4.59% and 21+ cases with 4.29% (Table 4). Significant differences between case volume were also noted with incidence of skin ulcer/blister, implant failure, and nerve palsy/injury. Furthermore, when looking at difficulty of fracture pattern, surgeons who had higher case volumes were significantly less likely to have a complication when performing simple percutaneous procedures (P = 0.001; Table 5).
Table 4 - Incidence of Surgical Adverse Events After All Supracondylar Humerus Surgeries, Organized by Case Volume of the Treating Physician Type: Supracondylar Humerus Fracture* 0-10 Cases 11-20 Cases 21+ Cases Univariate P N = 10,961 (100%) N = 5,687 (51.88%) N = 3,267 (29.81%) N = 2,007 (18.31%) Any medical complication 12 (0.60%) 4 (0.12%) 3 (0.05%) 0.600 Any surgical complication 342 (6.01%) 150 (4.59%) 86 (4.29%) 0.001 Bone fracture 4 (0.07%) 2 (0.06%) 0 (0.00%) 0.502 Dislocation 0 (0.00%) 0 (0.00%) 0 (0.00%) — Infection 75 (1.32%) 47 (1.44%) 35 (1.74%) 0.387 Nonunion/delayed union 9 (0.16%) 2 (0.06%) 0 (0.00%) 0.110 Skin ulcer/blister 28 (0.49%) 8 (0.24%) 3 (0.15%) 0.038 Implant failure 69 (1.21%) 19 (0.58%) 14 (0.70%) 0.005 Nerve palsy/injury 161 (2.83%) 64 (1.96%) 34 (1.69%) 0.003 Hemorrhage 0 (0.00%) 0 (0.00%) 0 (0.00%) — Limb ischemia 2 (0.04%) 5 (0.15%) 1 (0.05%) 0.127 Tendon ligament/injury 0 (0.00%) 0 (0.00%) 0 (0.00%) — Compartment syndrome 8 (0.14%) 3 (0.09%) 1 (0.05%) 0.535 Vascular injury 0 (0.00%) 0 (0.00%) 0 (0.00%) —*Significance level set at P = 0.0385 with Boneferroni Correction.
Bold indicates statistical significance (P < 0.05).
*Significance level set at P = 0.0385 with Boneferroni Correction.
Bold indicates statistical significance (P < 0.05).
Multivariate regression revealed three factors to be independently associated with complication rates. Patients treated in the Southeast region of the United States were more likely to experience a complication than those treated in other regions (OR 1.50, 95% CI: 1.11 to 2.03; P = 0.008; Table 6). Treatment by pediatric-trained surgeons was associated with decreased risk of complications (OR 0.79, 95% CI: 0.66 to 0.94; P = 0.010). Finally, having surgical correction of a “complex” fracture type according to the CPT code was associated with an odds ratio of 3.37 for having a complication (95% CI: 2.70 to 4.22; P < 0.001). Sex and age did not seem to affect complication rates. When independently looking at case volume as a factor separate from fellowship status, multivariate regression revealed only Southeast region (OR 1.54, 95% CI: 1.14 to 2.07; P = 0.005) and complex procedure type (OR 3.36, 95% CI: 2.69 to 4.20; P < 0.001) to be independently associated with changes in complication rates, whereas case volume was not (Table 7).
Table 6 - Factors Independently Associated With Surgical Complications Among All Supracondylar Humerus Fracture Surgeries Based on Fellowship Status of Reporting Surgeon Factora Likelihood of Surgical Complication N = 10,961 (100%) OR 95% CI P Patient age (per decade) 0.88 0.64-1.21 0.421 Patient sex Female 1.00 — — Male 1.13 0.95-1.34 0.164 Region Northeast 1.00 — — Northwest 1.21 0.83-1.77 0.325 Midwest 1.27 0.94-1.71 0.122 South 1.00 0.74-1.37 0.985 Southeast 1.50 1.11-2.02 0.008 Southwest 1.20 0.89-1.60 0.229 Fellowship status Other 1.00 — — Trauma 0.86 0.64-1.16 0.331 Pediatrics 0.79 0.66-0.94 0.010 Procedure type Simple 1.00 — — Complex 3.38 2.70-4.22 <0.001aCovariates controlled for in this model include all factors in Table 1
Bold indicates statistical significance (P < 0.05).
留言 (0)