
Remember me
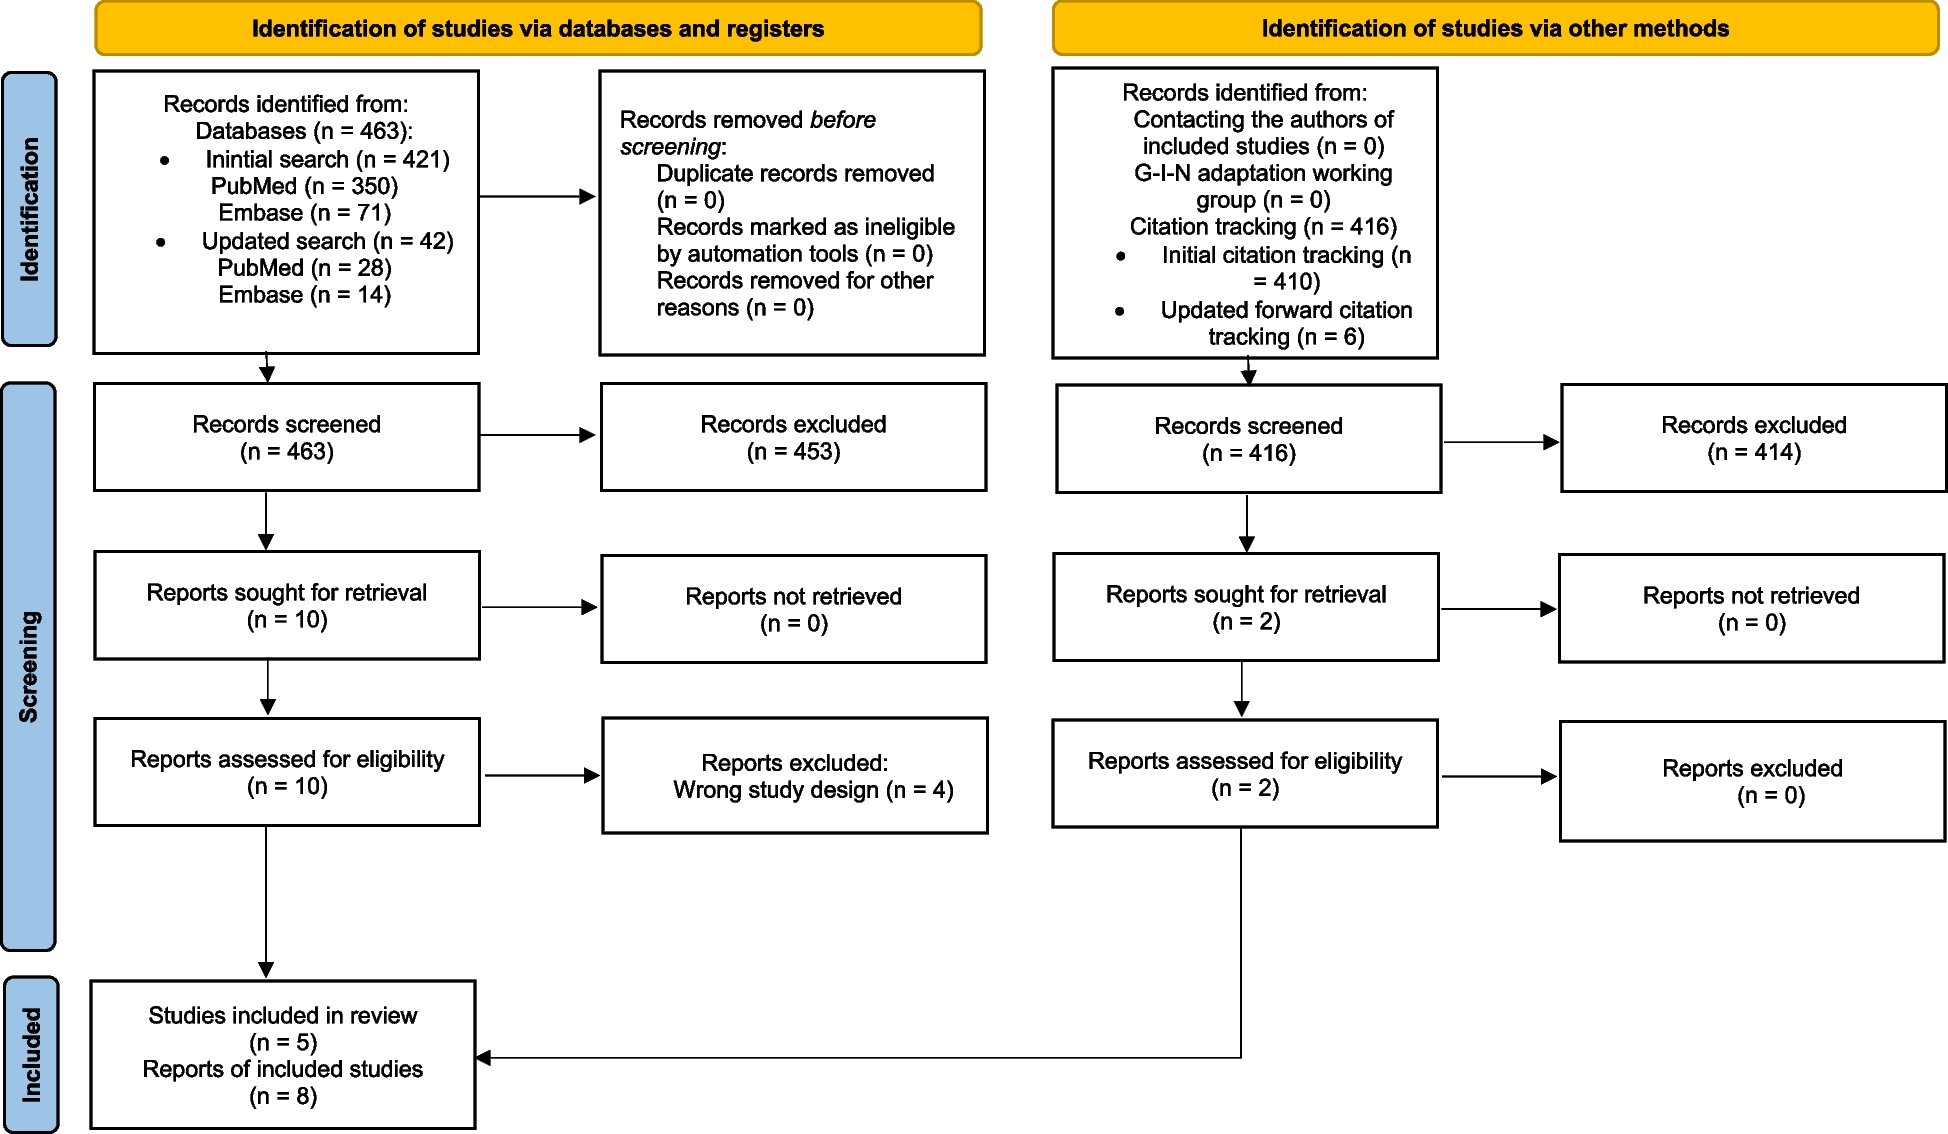
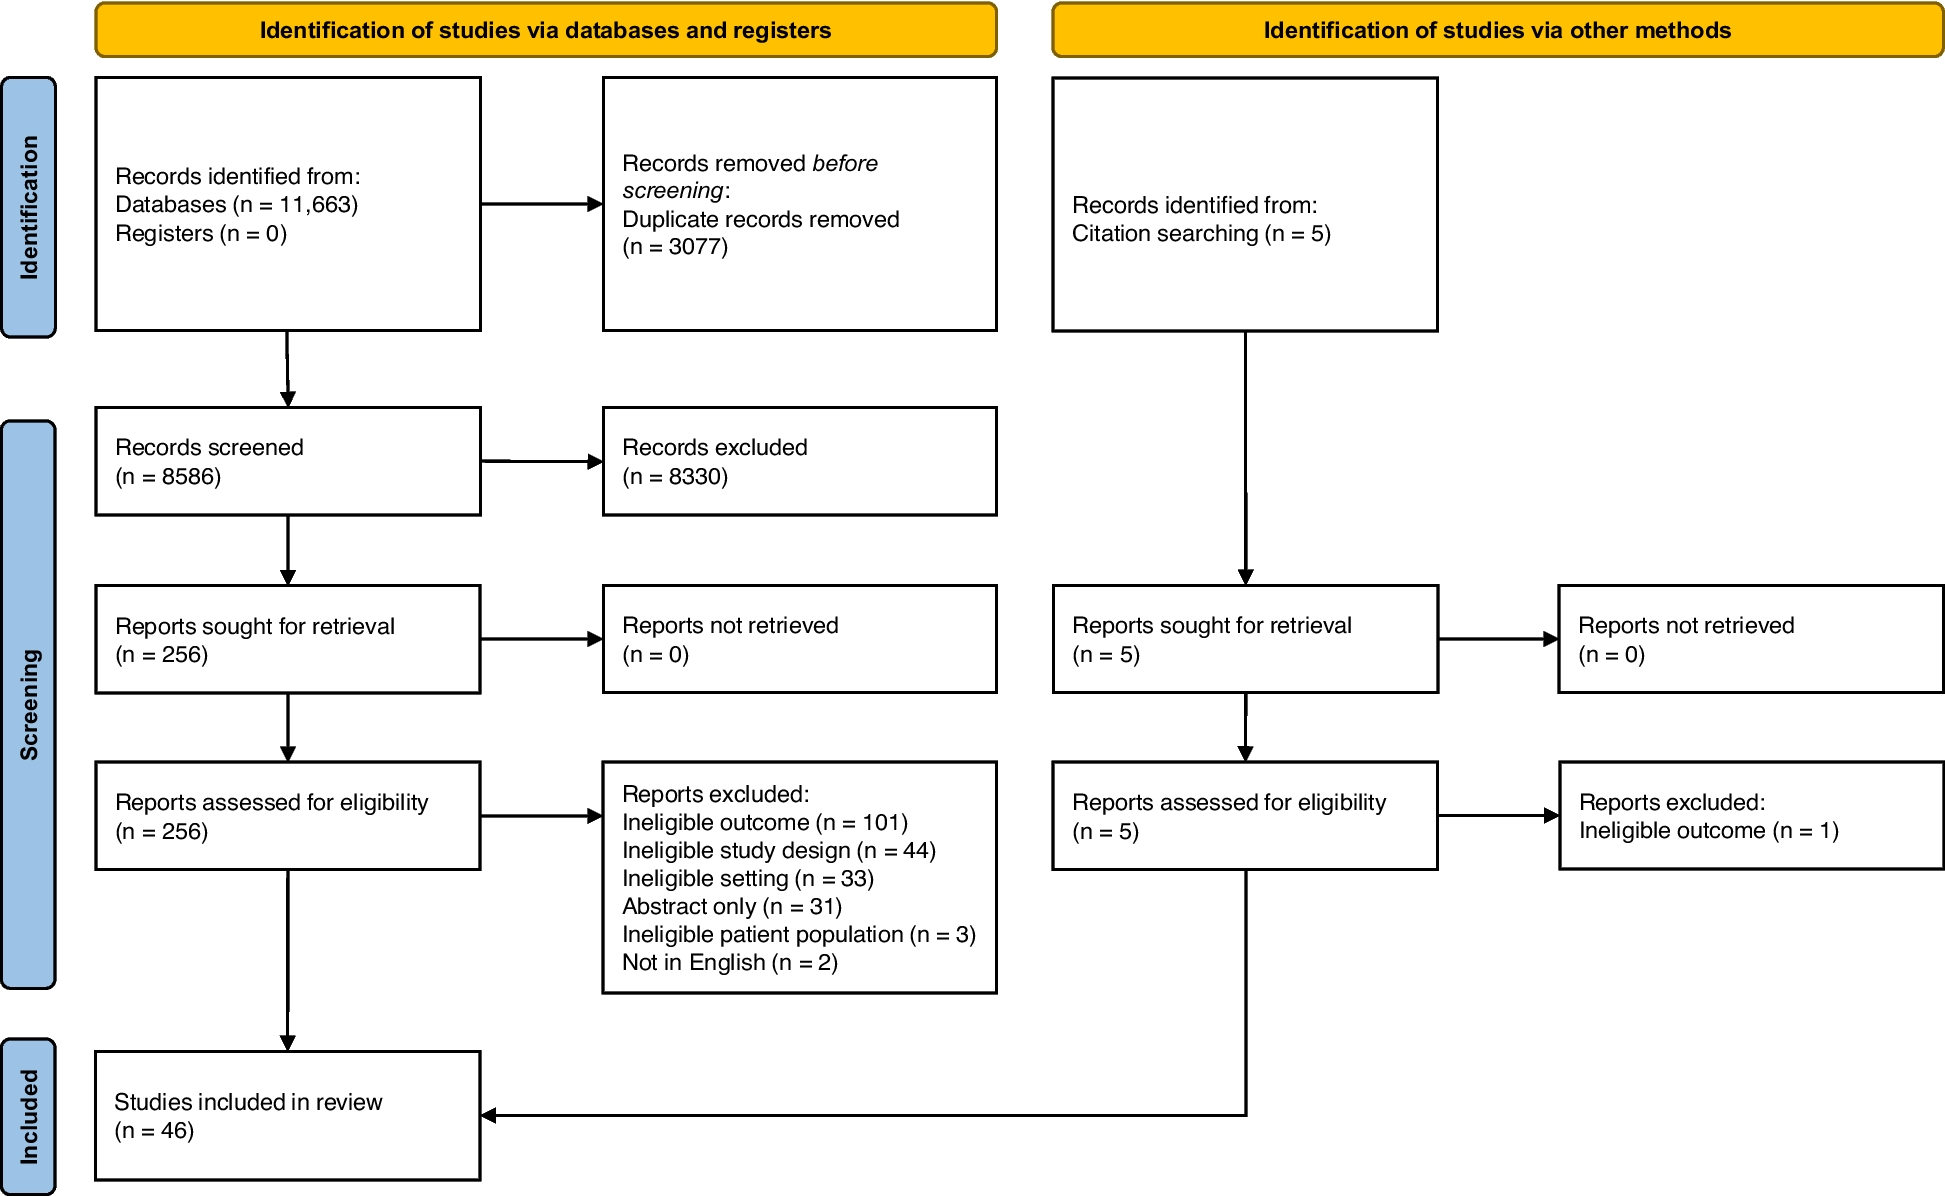


A total of 224 reports were obtained from the initial database searches. After the removal of duplicates, 192 reports were screened, and 175 reports were excluded after the first screening of the title and abstract, thus 17 reports were further included for full-text screening. According to the inclusion and exclusion criteria, nine RCTs [19,20,21,22,23,24,25,26,27] were finally included in this meta-analysis. The PRISMA flowchart of study selection is presented in Fig. 1.
Fig. 1
PRISMA flow diagram of RCT inclusion
Characteristics and quality of included RCTsThe characteristics of the included studies are presented in Table 1. Of the included RCTs, 341 patients were involved, and 165 patients underwent balance training. There are eight groups of “balance training versus no intervention” trials and two groups of “balance training versus strength training” trials. The outcome indicators of the study included seven groups of CAIT, three groups of FAAM, and seven groups of SEBT.
Table 1 The characteristics of included RCTsThe PEDro scores for the quality of the included studies are presented in Table 2. There were three RCTs with 7 points, five RCTs with 6 points, and one RCT with 5 points.
Table 2 The methodologic quality of included RCTs by Physiotherapy Evidence Database (PEDro) scaleFive RCTs reported the CAIT after the intervention, including 202 patients. There was homogeneity (I2 = 0%, P = 0.76), and the fixed effect model was used. Meta-analysis results showed that compared with the blank control group (controls without interventions), the CAI score of the balance training group was significantly improved [MD = 3.95, 95% CI (3.26, 4.64), P < 0.001, Fig. 2a].
Fig. 2
The forest plots for CAIT, FAAM-ADL, FAAM-Sports, and SEBT-A compared to black control
Two RCTs reported the FAAM-ADL after the intervention, including 70 patients. There was heterogeneity (I2 = 85%, P = 0.001), and the random effect model was used. Meta-analysis results showed that there was no significant difference in the FAAM-ADL score between the balance training group and the blank control group [MD = 8.28, 95% CI(− 3.49, 20.05), P = 0.17, Fig. 2b].
Two RCTs reported the FAAM-Sports after the intervention, including 70 patients. There was homogeneity (I2 = 48%, P = 0.16), and the fixed effect model was used. Meta-analysis results showed that compared with the blank control group, the FAAM- Sports score of the balance training group was significantly improved [MD = 17.74, 95% CI(14.36, 21.11), P < 0.001, Fig. 2c].
Five RCTs reported the SEBT-A after the intervention, including 195 patients. There was heterogeneity (I2 = 94%, P < 0.001), and the random effect model was used. Meta-analysis results showed that there was no significant difference in the SEBT-A score between the balance training group and the blank control group [MD = 4.05, 95% CI (− 1.64, 9.75), P = 0.16, Fig. 2d].
Three RCTs reported the SEBT-AM after the intervention, including 88 patients. There was heterogeneity (I2 = 51%, P < 0.001), and the random effect model was used. Meta-analysis results showed that there was no significant difference in the SEBT-AM score between the balance training group and the blank control group [MD = 1.05, 95% CI (− 1.73, 3.84), P = 0.46, Fig. 3a].
Fig. 3
The forest plots for SEBT-AM, SEBT-M, SEBT-PL, and SEBT-PM compared to black control
Three RCTs reported the SEBT-M after the intervention, including 89 patients. There was heterogeneity (I2 = 84%, P = 0.002), and the random effect model was used. Meta-analysis results showed that there was no significant difference in the SEBT-M score between the balance training group and the blank control group [MD = 4.06, 95% CI(− 1.53, 9.64), P = 0.15, Fig. 3b].
Four RCTs reported the SEBT-PL after the intervention, including 173 patients. There was homogeneity (I2 = 81%, P = 0.001), and the random effect model was used. Meta-analysis results showed that compared with the blank control group, the SEBT-PL score of the balance training group was significantly improved [MD = 5.19, 95% CI (1.57, 8.81), P = 0.005, Fig. 3c].
Six RCTs reported the SEBT-PM after the intervention, including 229 patients. There was heterogeneity (I2 = 94%, P < 0.001), and the random effect model was used. Meta-analysis results showed that compared with the blank control group, the SEBT-PM score of the balance training group was significantly improved [MD = 4.94, 95% CI(1.88, 8.00), P = 0.002, Fig. 3d].
Two RCTs reported the CAIT after the intervention between the balance training group and the strength training group, including 61 patients. There was homogeneity (I2 = 0%, P = 0.55), and the fixed effect model was used. Meta-analysis results showed that compared with the strength training group, the CAI score of the balance training group was significantly improved [MD = 2.36, 95% CI (0.29, 4.44), P = 0.03, Fig. 4a].
Fig. 4
The forest plots for CAIT, FAAM-ADL, FAAM-Sports, and SEBT-PM compared to strength training
Two RCTs reported the FAAM-ADL after the intervention between the balance training group and the strength training group, including 61 patients. There was homogeneity (I2 = 0%, P = 0.81), and the fixed effect model was used. Meta-analysis results showed that compared with the strength training group, the FAAM-ADL score of the balance training group was significantly improved. [MD = 4.06, 95% CI (1.30, 6.83), P = 0.004, Fig. 4b].
Two RCTs reported the FAAM-Sports after the intervention between balance the training group and the strength training group, including 61 patients. There was homogeneity (I2 = 0%, P = 0.73), and the fixed effect model was used. Meta-analysis results showed that there was no significant difference in the FAAM-Sports score between the balance training group and the strength training group [MD = 5.00, 95% CI (− 0.38, 10.39), P = 0.07, Fig. 4c].
Two RCTs reported the SEBT-PM after the intervention between the balance training group and the strength training group, including 61 patients. There was homogeneity (I2 = 0%, P = 0.95), and the fixed effect model was used. Meta-analysis results showed that there was no significant difference in the SEBT-PM score between the balance training group and the strength training group [MD = 0.03, 95% CI (− 0.02, 0.08), P = 0.24, Fig. 4d].
We conducted a subgroup analysis based on the duration and frequency and intensity of balance training to evaluate the homogeneity, the synthesized outcomes did not change statistically (all P > 0.05).
Publication biasLimited by as number of included studies, we could not perform a funnel plot. Regression analyses on the synthesized outcomes indicated that there was no publication bias (all P > 0.05).
Sensitivity analysisWe systematically excluded RCTs for each individual result to assess whether the overall outcomes were affected. Our investigation revealed that the overall results remained unchanged regardless of excluding any specific RCT.
Comments (0)