Study cohort and study approval
Study participants were recruited at the Department of Psychiatry and Psychotherapy at the University Medical Center Goettingen, from August 2016 to March 2020. Individual informed consent was required prior to study inclusion from all subjects or their legal representatives. Respective pseudonymized collection of biological samples and clinical data were conducted according to the revised Declaration of Helsinki and good clinical practice guidelines and their use in biomarker studies was approved by the ethics committee of the University Goettingen (9/2/16).
Classification of the study participants
The pre-selected study cohort comprised 71 subjects representing a sub-set of a sample of originally n = 80 subjects used in the previous studies [14, 22] and for whom sufficient EDTA–blood plasma was available in our local biobank. The study participants were diagnosed by a biomarker-supported clinical diagnosis [22] and dichotomized according to their CSF Aβ42/40 ratios measured with commercial Aβ-ELISA kits in the Laboratory of Clinical Neurochemistry and Neurochemical Dementia Diagnostics, Department of Psychiatry and Psychotherapy, University of Erlangen-Nuremberg, Germany. The subjects were classified according to the clinical cut-off point of 0.050 into the groups Aβ-positive (CSF Aβ42/40 ≤ 0.050, n = 32) and Aβ-negative (CSF Aβ42/40 > 0.050, n = 39). This classification was consistent with the biomarker-supported clinical diagnosis based on clinical evaluations [27], CSF biomarkers (Aβ ratio, pTau181 and total-Tau) and psychometric and neuroimaging biomarker data (16 of 71 patients), classifying all Aβ-positive participants as probable or possible AD and all other patients as Aβ-negative disease controls. In the group of Aβ-positive participants with possible or probable AD, 8 patients had mild cognitive impairment (MCI) and 24 patients had dementia, whilst in the group of Aβ negative participants with improbable AD, 1 had subjective cognitive decline (SCD), 23 had MCI and 15 had dementia. In this retrospective analysis of the participants, the evaluation of cognitive impairment was based on a combined neuropsychological and clinical examination. APOE status was determined using a modified quantitative real-time PCR protocol as described previously [28]. DNA was prepared from whole blood with the DNeasy Blood & Tissue kit (Qiagen) and analyses were performed on a CFX Connect Real-Time PCR system using the iTaq™ Universal SYBR Green Supermix (BIO-RAD). All samples were measured in duplicates for all primer combinations including negative controls. The characteristics of the study cohort and CSF biomarkers are summarised in Table 1.
Table 1 Description of the study cohort and baseline CSF biomarker dataPreparation of functionalized magnetic beads
Functionalized magnetic beads for Aβ-immunoprecipitation (Aβ-IP) were produced by covalently coupling the monoclonal antibody (mAb) 1E8 (nanoTools, Teningen, Germany) with Dynabeads M-280 Sheep anti-Mouse IgG (Invitrogen/Thermo Fisher Scientific, Waltham, MA, USA) according to the manufacturer’s instructions and as described in detail previously [17].
For immunoprecipitation of Tau proteins, functionalized magnetic beads were produced by coupling two mAbs directed to Tau. First, mAb 2B8 was used (Roboscreen, Leipzig, Germany) that binds to brain derived Tau because its binding site is formed by the last 4 amino acids of exon 4 and the first 4 amino acids of exon 5. This epitope contains amino acids 121–128 (HVTQARMV) of 2N4R Tau. Second, mAb 7E5 (Roboscreen) was used which is directed to amino acids RGAAPPGQKGQA (156–165 of 2N4R Tau). Dynabeads M-270 Epoxy (Invitrogen/ Thermo Fisher Scientific) were coupled with both mAbs according to the manufacturer’s protocol using 100 µg of mAb per 5 mg (~ 3.3 × 10⁸) of lyophilized beads. Coupling was performed at 37 °C using rotation at 25 rounds per minute overnight (12–18 h) in a mixture of 20 mM phosphate-buffered saline pH 7.4 (PBS), 0.1 M sodium phosphate buffer pH7.4 and 3 M ammonium sulphate in 0.1 M sodium phosphate buffer pH7.4 (v/v 1/1/1). After coupling, the beads were washed 3 times using 20 mM PBS pH 7,4 containing 0,1% bovine serum albumin (BSA) und 0,05% (v/v) Tween 20 and stored in the same buffer supplemented with 0.02% sodium azide or 0.1% proclin300.
Semi‑automated Aβ and Tau‑immunoprecipitations
Plasma Aβ peptides were immunoprecipitated from EDTA–blood plasma in a semi-automated fashion on a CyBio FeliX liquid handling instrument (Analytik Jena, Jena, Germany) following a modified version of our previously published Aβ IP protocol [14]. In brief, aliquots of 500 µl EDTA–blood plasma stored at –80 °C in Matrix 0.5 mL tubes (Thermo Scientific) were thawed at room temperature (RT), mixed vigorously for 5–10 s and centrifuged for 10 min at 10,000 × g at RT in a fixed angle rotor for removal of insoluble material. Next, 200 µL of plasma was transferred manually to a 96-deepwell sample plate (DeepWell MegaBlock®, 96 wells, 2.2 mL, PP (Sarstedt, Nümbrecht, Germany)) and placed inside the CyBio FeliX instrument. The plasma samples were mixed with 200 µL H2O, 100 µL of 5 × IP buffer concentrate (250 mM HEPES/NaOH, pH 7.4, 750 mM NaCl, 2.5% Igepal CA630, 1.25% sodium deoxycholate; 0.25% SDS and Complete Mini Protease inhibitor cocktail (Roche)) and 25 µL of functionalized 1E8 magnetic beads (see above), followed by overnight incubation at 4 °C with continuous agitation at 1,000 rpm on an Eppendorf ThermoMixer C (Eppendorf, Hamburg, Germany). On the next day, the incubated plate was placed in the FeliX instrument for subsequent washing steps. The magnetic beads were then immobilised with an ALPAQUA MAGNUM FLX Universal Magnet (Beverly, MA, USA) adapter and the supernatants (unbound material) were discarded. The beads were immediately washed 3 × for 5 min with 1 mL of PBS/0.1% BSA and 1 × for 3 min with 1 mL of 10 mM Tris/HCl, pH 7.5. Per well, 2 × 25 µL of PBS containing 0.05% Tween 20 (PBS-T) were used to elute the Aβ peptides from the 1E8 magnetic beads by heating the 96-deepwell round bottom plate without a lid for 5 min at 99 °C and 1,100 rpm on a BioShake 3000-T elm (QInstruments, Germany) mounted in the CyBio FeliX instrument. Per sample, a remaining volume of approximately 38 µL of bead-free Aβ eluate was obtained and diluted ~ six-fold with 190 µL of Diluent 35 (MSD). Finally, the diluted Aβ IP eluates were divided into three aliquots of 60µL and stored at − 80 °C until the Aβ measurements on the Lumipulse G System.
For the immunoprecipitation of Tau proteins, we started from 400 µL aliquots of EDTA–plasma. First, the plasma samples were depleted of Aβ peptides. For that purpose, 400 µL of EDTA–plasma was mixed with 100 µL of 5 × IP buffer concentrate and 25 µL 1E8 magnetic beads on the CyBio FeliX liquid handling robot (see above). After overnight incubation, the magnetic beads were immobilised and the unbound fractions (supernatants) were collected and stored at 4 °C for subsequent Tau IP. To each of the precleared samples, 50 µL of Tau beads (described above) were added, followed by an overnight incubation at RT with periodical mixing by pipetting up and down on the CyBio FeliX instrument. After the incubation, the beads were collected on the ALPAQUA MAGNUM FLX Universal Magnet, and the supernatants were discarded. The beads were washed 3 × for 5 min with 1 mL of PBS/0.1% BSA and 1 × for 3 min with 1 mL of PBS-T. Finally, Tau proteins were eluted in 2 × 25 µL of PBS-T by heating the 96-deepwell round bottom plate without a lid for 5 min at 99 °C and 1,100 rpm in a BioShake 3000-T elm (QInstruments, Germany). To the remaining volume of approximately 38 µL of Tau IP eluate per sample, 75 µl of PBS-T was added, resulting in a final volume of approximately 113 µl per sample. The eluates were divided into two aliquots of 50 µl and stored in 0.5 mL Protein LoBind tubes (Eppendorf) at − 80 °C until pTau181 measurements on the Lumipulse G System.
Quantification of Aβ1-40, Aβ1-42 and pTau181 on Lumipulse
The concentrations of Aβ1-40, Aβ1–42 and pTau181 were determined using the commercially available plasma β-Amyloid 1-40, 1–42 and pTau181 Immunoreaction Cartridges on the fully automated Lumipulse G600II System. A new calibration curve was performed for each analyte before the experiment. Quality control analyses were performed every start of the day using Aβ and pTau181 control samples included in the kit.
For the direct measurements of EDTA–plasma, 400 µL of centrifuged plasma was introduced into the instrument using individual 2 mL screw cap micro tubes (Sarstedt, Germany). Single measurements of Aβ1-40, Aβ1–42 and pTau181 were performed consecutively by the automated Lumipulse system using the same sample.
IP eluate analysis was divided in two steps. Quantification of Aβ1-40 and Aβ1–42 was performed by diluting one of the three 60 µL aliquots of Aβ IP eluates stored at -80 °C to a final volume of 300 µL using Specimen Diluent 1 (Fujirebio). Tau IP eluate was used to measure the levels of pTau181. A sample of 50 µL, corresponding to approximately half of the eluate volume, was diluted to a final volume of 250 µL. Diluted samples were transferred to 2 mL Sarstedt tubes and introduced into the Lumipulse instrument for the respective measurement. All assays were performed as single measurements following the kit instructions.
Statistical analysis
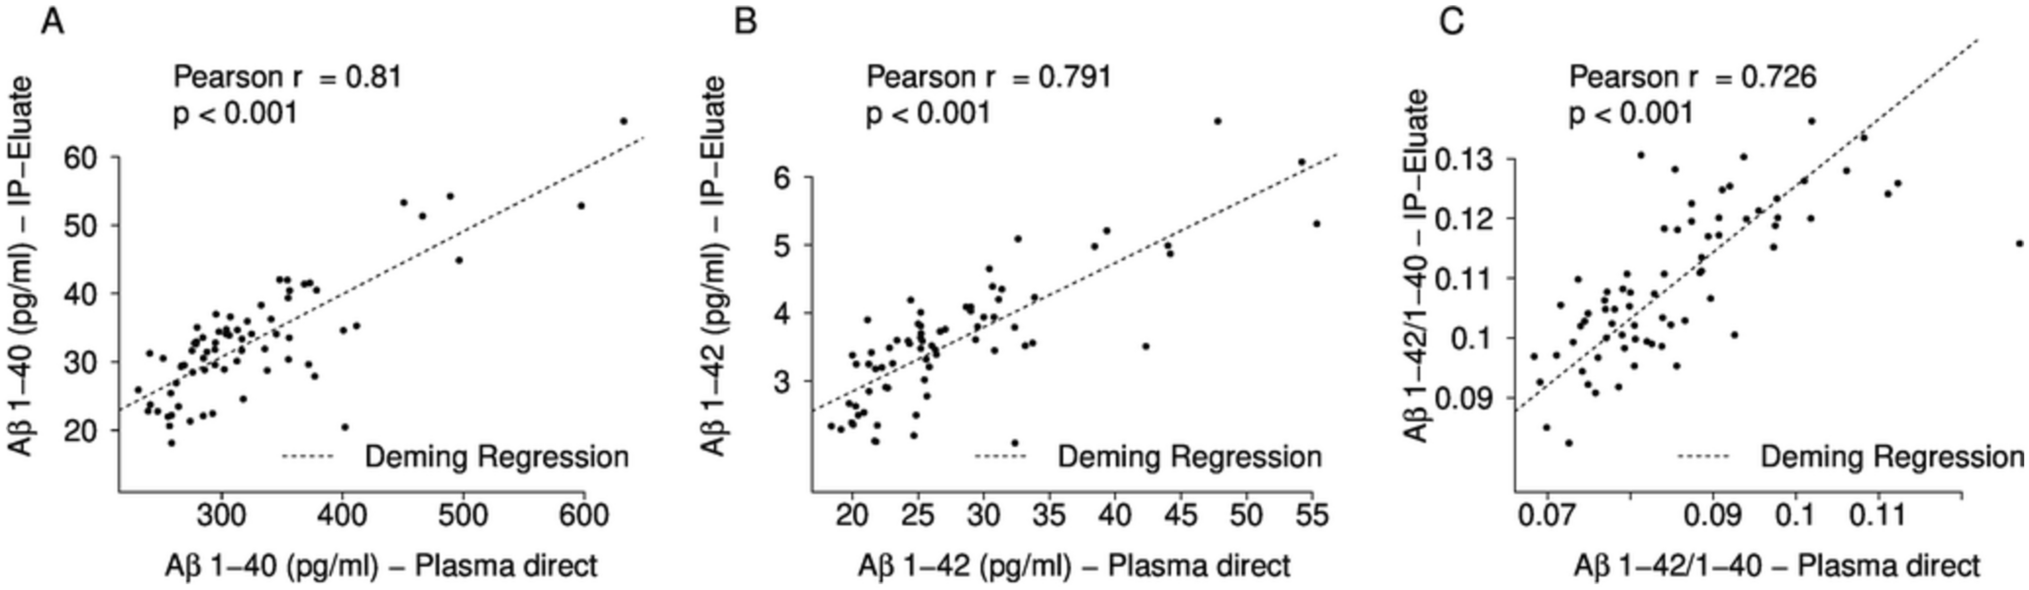
All statistical evaluations were performed with R version 4.2.3. Baseline statistics are reported as median ± median absolute deviations with scaling factor 1.4826 (MAD). To compare between amyloid-positive and amyloid-negative groups, we used two-tailed Mann–Whitney tests for numerical variables and Fisher’s exact test for categorical variables. For the calculation of correlation coefficients, we used Pearson correlations. For fitting regression lines, we used a Deming regression (R package MethComp version 1.22.2) since both variables were measured experimentally.
For assessing effect sizes, we used three parameters as measures of the magnitude of the effect:
(i) The relative median difference, calculated as:
$$\mathrm\left(\mathrm\right)=100\times \frac(\mathrm+)-}(\mathrm-)}}(\mathrm-)}$$
(ii) The relative mean difference, calculated as:
$$\mathrm\left(\mathrm\right)=100\times \frac\left(\mathrm+\right)-}(\mathrm-)}(\mathrm-)}$$
(iii) Cohen’s d (standardised effect size), calculated with R package “effsize” (version 0.8.1).
For testing the significance of the observed difference of effect sizes, we applied a 0.632 bootstrapping (re-sampling of patients with replacement including refinement of the estimator as proposed by Efron in 1983) [29]. We applied 1000 replications of the bootstrapping and calculated the difference of effect sizes (e.g. 0.632 × median difference of the resampling + 0.368 × median difference of data without resampling). The differences of the resulting effect sizes were normally distributed (Shapiro p value: 0.85). Making use of this fitted normal distribution, bootstrapping p values were calculated using a normal distribution after normalisation of the standard deviation. Single value ROC curves, AUCs and Delong p value for comparing ROC curves were calculated with R package pROC (version 1.18.0). Classification with logistic regression was done with a tenfold cross-validation in order to avoid overfitting. Classification performance was assessed at the Youden point of the ROC curve. Mixture models were used to fit two Gaussian distributions for the Aβ1-42/1-40 ratios. R package ‘mixtools’ (version 2.0.0) was used with the precondition of similar standard deviations between the two groups.


留言 (0)