
記住我


The Korean Ministry of Food and Drug Safety and the Institutional Review Board of the Seoul National University Hospital reviewed and approved this study. The study was registered in the open registry of ClinicalTrials.gov (NCT05202912) and conducted following the Declaration of Helsinki and Korean Good Clinical Practice guidelines [15, 16]. Written informed consent was obtained from all subjects prior to any procedures.
SubjectsHealthy Korean, Caucasian, and Chinese male subjects aged 19–50 years with a body weight of ≥ 55.0 kg and a body mass index of 18–30 kg/m2 were eligible for this study. The Korean subjects had to be born in Korea, have biological parents and grandparents of Korean origin, and had lived outside Korea for less than 10 years. The Caucasian subjects had to be born in Europe, have biological parents and grandparents of European origin, and had lived outside Europe for less than 10 years. The Chinese subjects had to be born in China, have biological parents and grandparents of Chinese origin, and had lived outside China for less than 10 years. The major exclusion criteria were as follows [17]: any history of clinically significant disorders; hemoglobin level of < 12.0 g/dL; estimated glomerular filtration rate based on the modification of the diet in the renal disease formula of < 60 mL/minute/1.73 m2; Bazett’s corrected QT interval (QTcB) of > 450 milliseconds; subjects who had used drugs that induce or inhibit drug-metabolizing enzymes within 1 month prior to the first dose of study drug; and subjects who had consumed foods containing grapefruit within 24 h of each admission. Moreover, subjects or their partners should have used medically acceptable contraception for at least three months after the last venadaparib dose [18, 19].
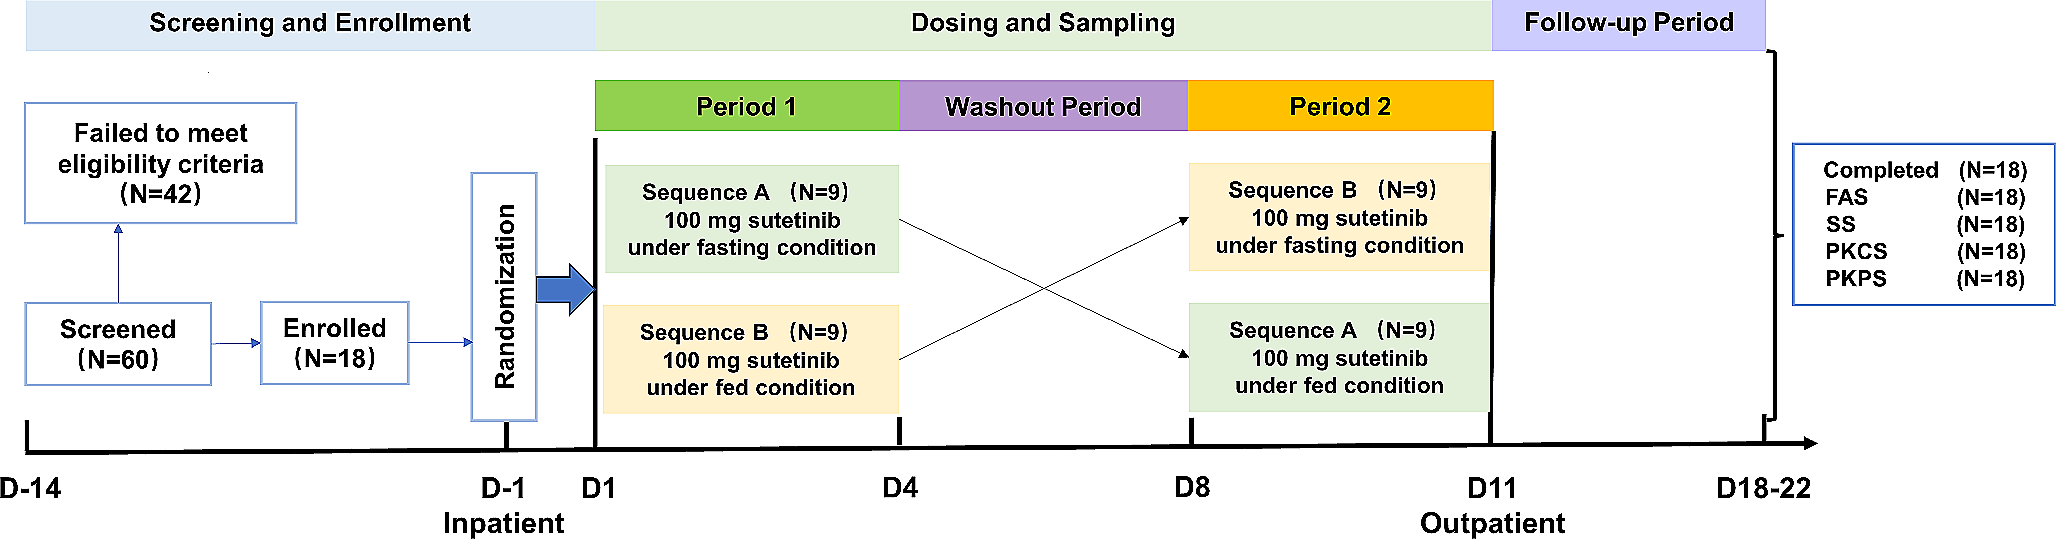
Study designA randomized, open-label, single-dose, two-sequence, and two-period crossover study was conducted with 12 Korean and 12 Caucasian subjects. Subjects in each ethnic group were randomly assigned to one of the two sequences at a ratio of 1:1 (Fig. 1). The subjects were orally administered 80 mg of venadaparib in each treatment period (fasted or fed state), following an overnight fast of at least 10 h. There was a seven-day washout between the two treatment periods. In the fed state, the subjects consumed an entire high-fat meal (total of 800–1000 kcal, fat of 500–600 kcal) within 20 min and were subsequently administered the study drug with 240 mL of water 30 min after the start of the meal [20]. An open-label, single-dose study was conducted on 12 Chinese subjects who received 80 mg of venadaparib only in the fasted state (Fig. 1).
Fig. 1
Based on the PK results of venadaparib in a previous study (NCT03317743), serial blood samples for the PK analysis of venadaparib were collected at 0 (pre-dose), 0.25, 0.5, 1, 2, 3, 4, 6, 8, 10, 12, 24, 36, 48, and 72 h post-dose for all treatment and ethnic groups. The blood samples were collected in a K2-ethylenediaminetetraacetic acid (EDTA) vacutainer, centrifuged at 4 ℃ and 3000 rpm for 10 min, and stored at − 70 ℃ until analysis.
Determination of plasma venadaparib concentrationPlasma concentrations of venadaparib were determined using validated high-performance liquid chromatography (Exion LC, AB Sciex) coupled with mass spectrometry (Triple Quad 5500+, AB Sciex). Venadaparib as an analyte and olaparib as the internal standard were separated using a Gemini 3 μm NX-C18 110 Å (100 × 3 mm) column (Phenomenex, CA, USA) at 40 ℃. The mobile phase comprised 0.1% formic acid in distilled water and 100% acetonitrile at a flow rate of 0.3 mL/minute. Venadaparib and olaparib were detected with a turbo-ion spray in positive ionization mode at an m/z transition of 407.2 → 70.0 and 435.2 → 281.1, respectively [21].
The calibration curve for venadaparib ranged from 5 to 5000 μg/L, with precision and accuracy ranging from 1.89 to 4.00% and 92.98 to 102.80%, respectively. For the quality control sample data of venadaparib, the precision and accuracy ranged from 4.38 to 5.18% and 96.75 to 102.59%, respectively.
Pharmacokinetic and statistical analysesThe PK parameters of venadaparib were calculated by a non-compartmental method using Phoenix WinNonlin software version 8.3.4 (Certara, NJ, USA). The area under the plasma concentration-time curve (AUC) was determined using the linear-up log-down trapezoidal method. The primary PK parameters were Cmax and AUC from time zero to the last measurable time point (AUClast) for comparison between the exposures to the effects of food and ethnicity. The following secondary PK parameters were calculated: AUC from time zero to infinity (AUCinf), time to reach Cmax (Tmax), t1/2, apparent total clearance (CL/F), and apparent volume of distribution (Vd/F).
Statistical analyses were conducted using SAS software version 9.4 (SAS Institute Inc., NC, USA). The primary PK parameters in the fed and fasted states were compared by estimating the geometric mean ratios and 90% confidence intervals using a linear mixed-effects model. The model included the sequence, period, and treatment as fixed effects, and the subject nested within the sequence as a random effect. Analysis of variance (ANOVA) tests were conducted to assess possible differences in the values of the primary PK parameters among the ethnic groups in the fasted state.
Safety assessmentSafety was assessed in all subjects who received the study drug at least once throughout the study based on adverse event (AE) monitoring, physical examinations, vital signs, 12-lead electrocardiograms (ECGs), and clinical laboratory tests.
To support the evaluation of the relationship between concentration and QT/corrected QT (QTc) interval effects in the early stage of the clinical development of venadaparib, triplicate ECG tests were conducted in the middle of the study [22]. A triplicate ECG test was conducted in three Caucasian and five Chinese subjects after the protocol amendment. The 12-lead ECG schedules at 1, 2, 3, 4, 6, 8, 10, 12, 24, and 48 h post-dosing were added to the existing time points at 0 h (pre-dosing) and 72 h post-dosing. Fridericia’s corrected QT interval (QTcF) was collected, along with the existing ventricular rate, PR interval, QRS duration, QT interval, and QTcB. Triplicate ECGs were measured three times at intervals of 30 s to 2 min at each time point after at least 5 min of resting, and the median value of the three measurements was considered a representative value. QTcF and QTcB were calculated using the following population-derived correction equations: QTcF = QT/RR0.33 and QTcB = QT/RR0.5 [22].
留言 (0)