That microcirculatory dysfunction causes ischemia and hypoxia in local tissues plays a critical role in the pathogenesis of diabetic foot [20], hence the importance of an accurate evaluation of microcirculatory function. Currently, various techniques can be used to evaluate the microcirculatory perfusion in diabetic foot. Among them, percutaneous partial pressure of oxygen monitoring, dynamic capillary microscopy, laser Doppler perfusion imaging, etc. can only evaluate the microcirculation of the capillaries in the skin due to their limited penetration capabilities; iontophoresis measures red blood cell flow by nourishing the subpapillary vascular plexus, but only indirectly reflects microcirculation to the tissue [21,22,23]. Magnetic resonance imaging (MRI) can offer quantitative analysis of perfusion to the underlying soft tissue, but being time-consuming and expensive with various contraindication have made it unfeasible to be a routine diagnostic work-up [24,25,26].
CEUS has been widely used to evaluate microcirculatory perfusion in the heart and kidneys of patients with T2DM [27, 28]. And in the peripheral vasculature, CEUS has been reported to be mainly used in the evaluation of the arterial patency in the lower extremities, the stability of arterial plaque, the extent of ischemia in foot ulcers, and the microcirculatory function in the calf muscle [29,30,31], whereas studies on its usage in evaluating microcirculatory perfusion in diabetic foot are still lacking. Li et al. [32] reported that CEUS could distinguish the differences of microcirculatory perfusion to the phalangeal area in the foot between patients with impaired glucose tolerance (IGT) and patients with diabetes (without complications), but to date no studies addressing diabetic foot microcirculatory perfusion in female patients and across different disease courses have been reported. Therefore, this study included both male and female patients with diabetic foot in equal proportions across Wagner’s 0–5 grades to investigate the value of CEUS in evaluating microcirculatory perfusion to the foot of T2DM patients in a wider patient population.
In this study, group C with the most severe conditions of diabetic foot had the longest disease course and the highest HbAlc and blood sugar, indicating that the length of disease course; the fluctuation range of blood sugar were directly proportional to the severity of impairment in the foot of diabetic patients; the longer the disease course and the poorer the blood sugar control, the severe the impairment in the foot.
This study compared the TIC data of the dorsalis pedis artery obtained from CEUS for all groups. PI and AUC values reflected the volume of blood flow in the region of interest and larger values indicated better perfusion, while RT, AS, TTP, and DT/2 values reflected the blood flow velocity in the region of interest and would indicate a fast or slow perfusion. The results showed that the differences of the TIC data of the dorsalis pedis artery were statistically significant between the control group and group C only, which might indicate that long-term abnormal glucose metabolism had led to the severest atherosclerosis in group C where the narrowed or even occluded lumen impeded the passage of the contrast agent, resulting in a lowered blood flow velocity at the distal end of the stenosis, a delayed enhancement of the dorsalis pedis artery, and a reduced amount of contrast agent to the artery, whereas there were no statistically significant difference in the TIC data between the other two experimental groups and the control group, which might indicate that less severe atherosclerosis in the other groups allowed for a smoother passage of the contrast agent.
The intergroup comparison of TIC data of the underlying soft tissue in the dorsal region of the foot of all groups showed that as the condition of diabetic foot worsened, parameters reflecting the rapidity of perfusion such as TTP, RT, and DT/2 prolonged and AS decreased; among them, TTP, RT, and AS reflected the rapidity of wash-in while DT/2 reflected the rapidity of the return of blood flow; and parameters reflecting the intensity of perfusion such as PI and AUC decreased. These signs demonstrated an enhancement pattern of “delayed wash-in, delayed wash-out and weak enhancement” for microcirculatory impairment in the dorsum of the foot on CEUS. This may be due to the thickening of microvascular basement membrane, the microvascular distortion, and the narrowing or even occlusion of the lumen following microvascular impairment under the influence of hyperglycemia, which resulted in the prolonged passage time and the decreased passed amount of the contrast agent. Meanwhile, due to the insufficient perfusion, the distal venules were in a diastolic state, which slowed down the return of the contrast agent, further reducing effective perfusion and aggravating ischemia, hypoxia, and undermining the vitality of local tissues, thereby resulting in local “weak enhancement.”
The comparison of TIC data of the underlying soft tissue showed that compared with the control group, AUC and PI decreased and AS increased in group A, and the difference was statistically significant, indicating the existence of microcirculatory perfusion abnormalities in the dorsum of the foot of patients with diabetes mellitus alone (without diabetic foot). The intergroup comparison among the three experimental groups showed that AUC and PI decreased and AS increased from group A to group B and then group C, suggesting the differentiated microcirculatory impairment between different grades of diabetes. Moreover, as the condition of diabetic foot worsened, the soft tissue perfusion intensity decreased, the perfusion time extended, and the microcirculation became worse. AS, RT, and AUC of groups A and B were statistically different from the control group, whereas DT/2 reflecting the rapidity of the return of blood flow between them was without statistically significant difference, suggesting that the microcirculatory impairment mainly involve the arterioles and metarterioles and relatively less impact the venules.
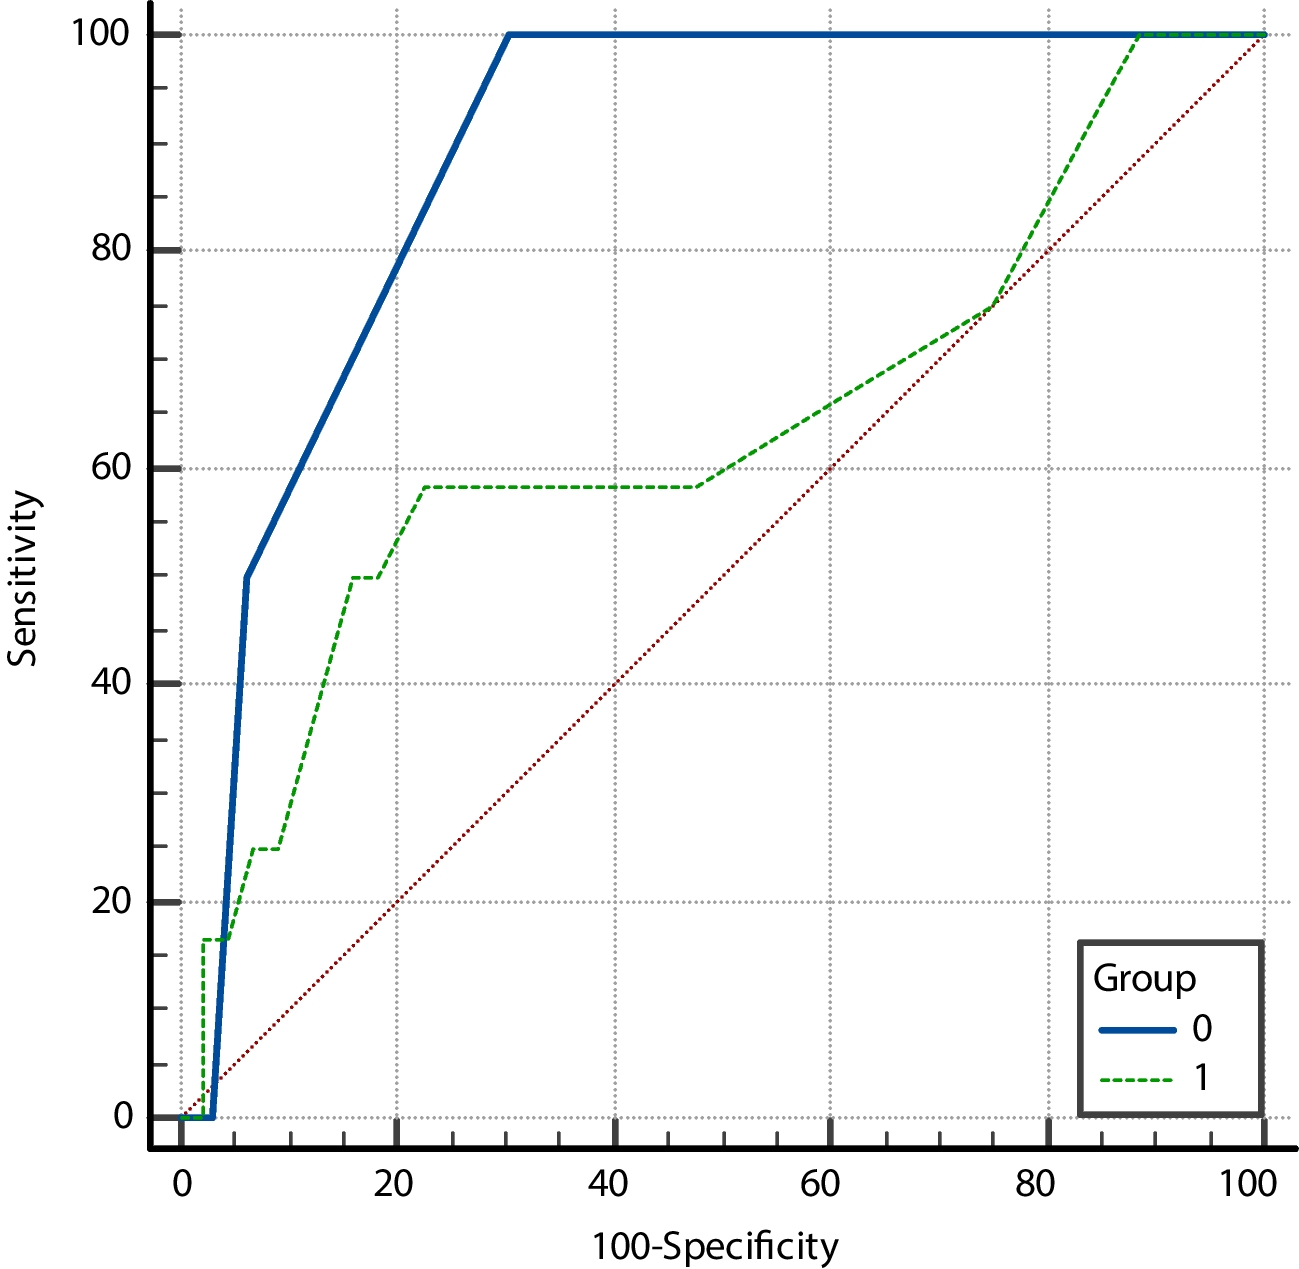
From the results of correlation analysis and ROC curve analysis, TIC parameters were found to be correlated with microcirculatory perfusion abnormalities in the dorsal area of a diabetic foot and could be used to predict the severity of lesions, particularly, AUC, PI, and AS of the TIC had higher diagnostic efficacy for microvascular lesions in the dorsal area of a diabetic foot. Further, the study used Youden’s index to determine the best cut-off values of the three parameters. By this way, the obtained best cut-off values of AUC, PI, and AS of the TIC for diagnosing microcirculatory perfusion impairment in diabetic feet were 290.23, 1.05, and 10.17, respectively. The presence of anomalies of at least two of the three parameters was used as the criteria for diagnosing diabetic foot microvascular impairment, and the results were compared with that of TcPO2. The results showed that CEUS and TcPO2 had the same efficacy in detecting microcirculatory perfusion impairment for patients in group C with severe diabetic foot, while for patients with milder microcirculatory perfusion impairment in group A and group B, the positive rate with CEUS was significantly higher than that with TcPO2. This indicated a higher sensitivity of CEUS in detecting milder microcirculatory perfusion impairment than TcPO2. It might be due to the limited performance of electrodes which were deployed on the skin surface to detect oxygen partial pressure on in TcPO2 and cannot detect microcirculatory perfusion in deep underlying soft tissues. And since its results are influenced by various factors such as environmental temperature, skin thickness, edema degree, and patient preparation, the TcPO2 test is often considered for screening. In contrast, CEUS utilizes a contrast agent that has a similar diameter to red blood cells and can enter the microvasculature to directly display the microcirculation status of the region of interest (ROI), without being impeded by the ROI’s depth. Meanwhile, the TIC quantitative assessment with CEUS better overcomes the aforementioned interference and provide more scientific details of the microcirculation status of soft tissue. It is arguable that CEUS may be reliable and superior to TcPO2 in detecting microcirculatory perfusion impairment in the dorsal area of the foot.
In this study, three patients from group C showed bimodal changes in sync in their TIC curves of the dorsalis pedis artery and the underlying soft tissue, with the first peak higher than the second. The medical records of the three patients showed that they all received digital subtraction angiography (DSA), and all were confirmed to have severe stenosis of the anterior tibial artery with collateral angiogenesis. The collateral vessels resulted by atherosclerosis now first allowed the majority of the contrast agent to pass and reach the dorsalis pedis artery to form the first main peak of the TIC curve, while the rest small portion of the contrast agent reached the artery through the narrowed lower extremity arteries and its delay resulted a secondary peak lower than the previous one. The above perfusion patterns suggested that collateral circulation in the lower extremity of diabetic foot might be assessed and quantified through TIC curves obtained from CEUS.
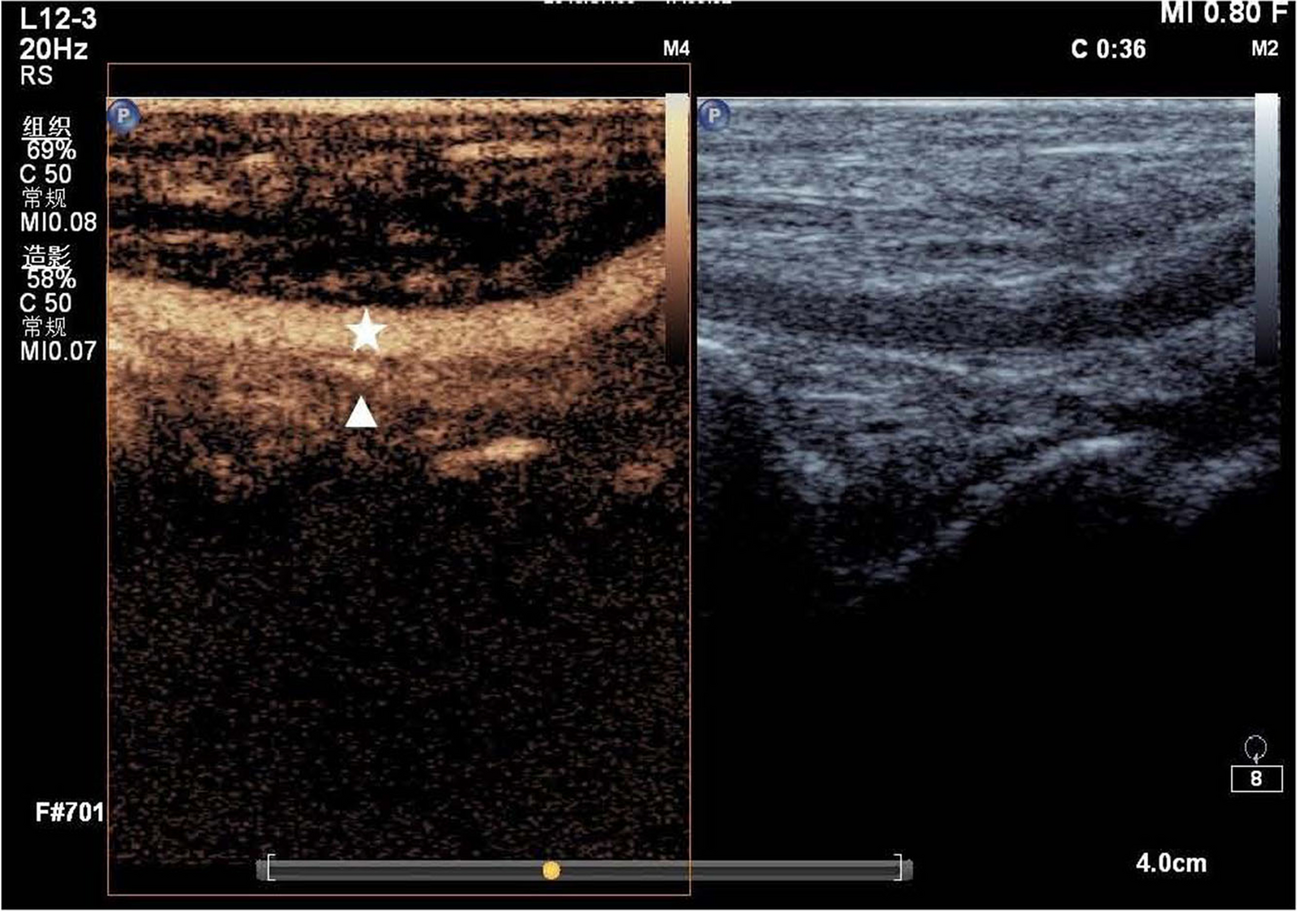
Atherosclerosis of all pedal vessels, either the dorsalis pedis artery or its distal extensions and arterioles, affect the microcirculatory perfusion in the soft tissues of the foot. However, an effective tool to detect calcification in the distal arterioles are still absent. The study chose the dorsalis pedis artery because it is superficially located and relatively larger in diameter, making it easily detectable. And since the superficial soft tissue above the dorsalis pedis artery is located in the near field of ultrasound which has a poorer image resolution, this study chose the deep underlying soft tissue as the ROI. All patients were examined with the same instrument by the same radiologist, the size and location of the ROI were kept the same for quantitative analysis to ensure the reliability of the acquired data. The limitation to our study is that it is a single-center study, so additional centers and patients are needed for further study.


留言 (0)