
記住我


Interoception—processing internal bodily sensations—is critical to homeostasis, health,50 and emotion regulation.10–12 Interoceptive sensibility (IS)14,28—the self-reported experience of internal states and one's relationship with own bodily sensations—is one of the many features of interoception.28 This multidimensional construct encompasses several skills,14 such as the ability to focus attention on bodily sensations, noticing their interactions with external factors, using bodily information for insight and self-regulating distress, and trusting the body. The relationship between IS and chronic pain (CP) is poorly investigated, and this study intends to bridge this gap.
Most studies on IS and CP have analyzed the independent effects of IS skills on pain-related outcomes, showing inconsistent results.8,37,48,57 For example, fewer worries about bodily sensations and higher body trust were associated with lower perceived stress and depression.37 Better self-regulation of bodily sensations was associated with lower pain disability57 and intensity.48,57 By contrast, higher awareness of the links between emotional and bodily states was associated with higher pain intensity and central sensitization symptoms.8 To the best of our knowledge, no studies have investigated how the interplay between the different IS skills may account for CP outcomes. Such integrated analysis might clarify whether individuals with different IS skills profiles show different CP outcomes, potentially informing the development of tailored IS interventions. Therefore, the first aim of this study was to identify IS skills profiles among individuals with chronic musculoskeletal pain—the most prevalent and burdensome worldwide6—and to investigate how these profiles were associated with CP outcomes. Drawing on theoretical models on body–mind relations in health (eg, psychosomatic competence model18), we expected individuals with a higher IS skills profile to report better CP outcomes, namely, lower pain intensity and interference, better physical function and vitality, and lower affective distress.
Furthermore, we aimed to investigate whether individuals with different IS skills profiles differed in psychological and behavioral processes known to be risk or protective factors in CP. According to the fear-avoidance model (FAM),59 fear-avoidance beliefs or affect (pain catastrophizing and kinesiophobia) lead to hypervigilance to threat signs and movement or activity avoidance, resulting in increased distress, pain persistence, and disability. Conversely, confronting movement or activity despite pain—often associated with high pain-related self-efficacy53,55—leads to recovery.59 Recent conceptual advances have stressed the role of interoceptive awareness in fear-avoidance psychological and behavioral processes. Some authors emphasized the role of interoceptive sensations as conditioned stimuli in pain-related fear13,41 and as a trigger to negative emotions and catastrophic worry.49 Others hypothesized that disruptions in interoceptive awareness hamper some of the self-regulation processes proposed by the FAM.57 Although evidence for the association between IS and pain-related behaviors, such as activity patterns (eg, avoidance or pacing or overdoing30) is lacking, some findings support the link between IS and pain-related cognitive and affective processes. For example, according to a recent literature review on body–mind relations in chronic musculoskeletal pain,46 interoceptive-based interventions (psychomotor therapy) might improve individuals' mental health and quality of life by increasing pain-related self-efficacy and decreasing pain catastrophizing. Drawing on these theoretical models, we expected individuals with higher IS skills to report higher pain-related self-efficacy, lower catastrophizing and kinesiophobia, and more adaptive activity patterns.
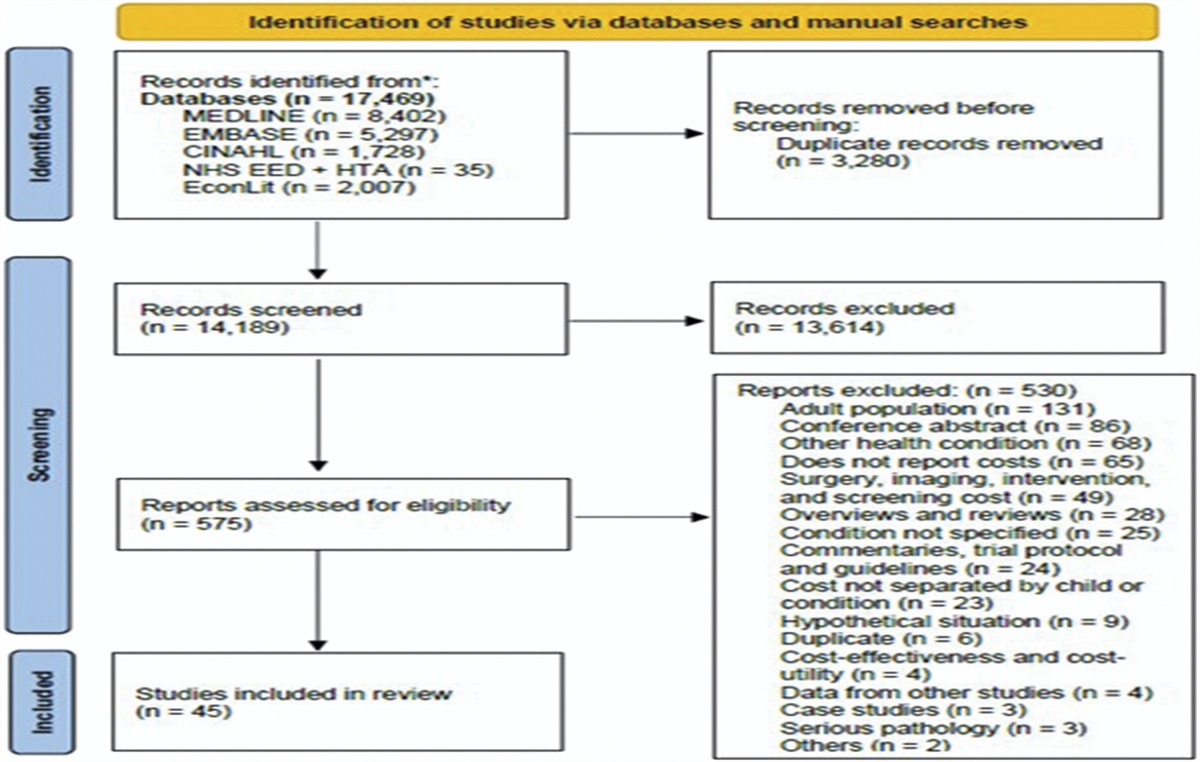
2. Method 2.1. Study design and participant recruitmentThis is a cross-sectional study using the entire data set of the first assessment wave of a prospective study (still unpublished), the ISENSE-Pain (Interoceptive SENSibility and PAIN), investigating the role of IS on chronic musculoskeletal pain. To participate in this study, individuals had to be older than 18 years old, suffer from chronic musculoskeletal pain (ie, pain originating in the musculoskeletal system, such as in muscles, joints, ligaments, or bones) for more than 3 months,40 and be able to use a communication device (eg, computer, tablet, and smartphone) with an Internet connection. Exclusion criteria included (1) having experienced recent fractures or surgeries (≤ 3 months), (2) reporting cancer-related pain, or (3) being pregnant.
Active recruitment was performed in hospital pain units in the Lisbon area. Potential participants were presented with study information by healthcare professionals and decided if they agreed to be contacted by phone by the research team. Passive recruitment was implemented in patients' associations and the community through study diffusion in internal mailing lists or the distribution of flyers. In this case, those who considered enrolling in the study directly contacted the research team. The first phone contact provided detailed information about the study objectives and procedures. After participants expressed their willingness to enroll in the study, sociodemographic (age, sex, place of birth, marital and cohabitation status, work status, occupation, and years of education) and clinical data (pain duration, location or regions, and pattern, ie, continuous vs recurrent; current treatments and pain management activities, and if participants were attending a pain consultation) were also collected. Then, a link to an online survey (Qualtrics, Provo, UT) was sent, including self-report measures of IS, pain-related processes (ie, self-efficacy, pain catastrophizing, kinesiophobia, and activity patterns), and outcomes (ie, depression, anxiety, pain intensity and interference, physical function, and vitality). Informed consent was obtained by telephone and online immediately before answering the survey. The study was approved by the Ethics Review Board of Iscte (99/2020) and each of the hospitals that participated in the study. Data were collected over a year, ending in March 2022. During this period, contacts with 208 potential participants were made, 19 of which did not participate in the study because (1) they did not have a communication device with an Internet connection (n =10), (2) they did not meet clinical inclusion criteria (not having pain or reporting other types of pain such as complex regional pain syndrome, neuralgia, and headaches; n = 5), and (3) after receiving detailed information, they were not interested in participating in the study (n = 4). Of the 189 individuals who were sent an online questionnaire, 91.5% (N = 173) completed it.
2.2. MeasuresAll variables were assessed with the Portuguese versions of the self-report measures presented below. The Multidimensional Assessment of Interoceptive Awareness (MAIA) was used to assess IS skills and define interoceptive profiles. The psychological and behavioral risk or protective processes were assessed with the Pain Self-Efficacy Questionnaire, the Pain Catastrophizing Scale, the Tampa Scale of Kinesiophobia, and the Patterns of Activity Measure-Pain. Chronic pain outcomes were assessed with the Depression Anxiety Stress Scales, the Brief Pain Inventory—Short Form, and the Medical Outcomes Study-36—Short Form 36v2.
Noteworthy, some of these instruments were validated with participants with different characteristics from this study sample. For example, the MAIA validation study35 was conducted with healthy college students instead of adults with chronic pain. As assuming factorial invariance across these samples could be a risk, we analysed the factorial structure of each instrument in our sample before computing the respective scores. This procedure is in line with some authors' suggestions,27 stressing that the construct validity of an instrument should be investigated in every sample to ensure its fit to the specific population under study.
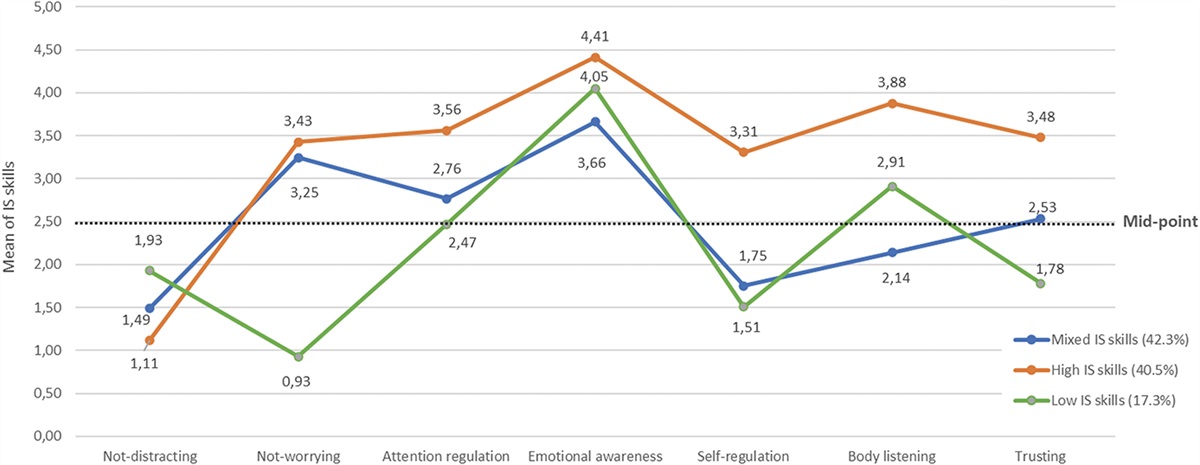
2.2.1. Interoceptive sensibilityInteroceptive sensibility was measured with the MAIA.38 This questionnaire assesses the ability to identify bodily sensations and emotional responses, to be aware of the body–mind relationship, and to report body confidence with 32 items, rated on a 6-point scale from 0 (never) to 5 (always). Originally, MAIA included 8 subscales (noticing, not distracting, not worrying, attention regulation, emotional awareness, self-regulation, body listening, and trusting). This study used the Portuguese version of MAIA,35 which showed good psychometric properties. To analyze the psychometric properties of the MAIA in the present sample, we ran a principal axis factor analysis with orthogonal rotation. The factorability of the data was verified (KMO = 0.81; Bartlett χ2 (435) = 2523.46, P < 0.001). After excluding 3 items due to low communalities or high or ambiguous cross-loadings, 8 factors were extracted based on the Kaiser criterion, accounting for 68.5% of the total variance: (1) not distracting (4 reversed items; α = 0.8231), ie, the ability to not ignore or not distract from sensations of pain or discomfort (eg, I push feelings of discomfort away by focusing on something else); (2) not worrying I (2 items; SB = 0.81,31), ie, the ability to not being worried or emotionally distressed by sensations of pain or discomfort (eg, I can notice an unpleasant body sensation without worrying about it); (3) not worrying II (2 items; SB = 0.56,31) included 2 items, from the original not worrying dimension, that loaded in a different factor (eg, I start to worry that something is wrong if I feel any discomfort); as this factor presented low reliability, it was discarded; (4) attention regulation (7 items; α = 0.8431), ie, the ability to perceive and sustain attention towards bodily sensations (eg, I can pay attention to my breath without being distracted by things happening around me); (5) emotional awareness (5 items; α = 0.7831), ie, the awareness of the connection between bodily and emotional states (eg, I notice how my body changes when I am angry); (6) self-regulation (4 items; α = 0.8631), ie, the capacity to regulate psychological distress by directing attention to bodily sensations (eg, I can use my breath to reduce tension); (7) body listening (3 items; α = 0.8331), ie, the ability to listen to the body for insight (eg, I listen to my body to inform me about what to do); and (8) trusting (3 items; α = 0.8531), ie, the experience of having a safe and trustworthy body (eg, I trust my body sensations). The final scores of the 7 IS skills were calculated by averaging the respective items and higher scores mean higher IS.
Noteworthy, as in MAIA's original main structure, these factors can be conceptually organized into 4 overarching types of IS skills, with an increasing degree of complexity38: (1) emotional and attentional response to bodily sensations (not distracting and not worrying), (2) attention regulation by staying focused on bodily sensations when facing numerous sensory stimuli competing for attention (attention regulation), (3) awareness of mind–body integration (emotional awareness, self-regulation, and body listening), and (4) trust in bodily sensations (trusting).
2.2.2. Pain-related psychological and behavioral processes 2.2.2.1. Pain-related self-efficacyThe Pain Self-Efficacy Questionnaire (PSEQ)43; p.v.21 assessed individuals' confidence levels regarding their ability to engage in activities or goals despite pain.43 It includes 10 items rated on a 7-point scale, ranging from 0 (not at all confident) to 6 (completely confident) (eg, I can still accomplish most of my goals in life, despite the pain). Both the original and the Portuguese versions identified a unidimensional structure showing good psychometric properties. In our sample, after checking the factorability of the data (KMO = 0.92; Bartlett's χ2 (45) = 1123.48, P < 0.001), a principal axis factor analysis was performed. Based on the Kaiser criterion, one factor was extracted. This factor accounted for 60.3% of the total variance and presented an excellent internal reliability (α = 0.9231). The final score was computed by calculating the average of the 10 items; higher scores indicate higher levels of pain-related self-efficacy.
2.2.2.2. Pain catastrophizingThe Pain Catastrophizing Scale (PCS)54; p.v.,1,26 measures pain-related catastrophic thinking, ie, a maladaptive cognitive–affective response consisting in exaggerating and ruminating about actual or anticipated pain and helplessness regarding pain management.33,51 This instrument includes 13 items rated on a 5-point scale, ranging from 0 (never) to 4 (always) (eg, I can´t stop thinking about how much it hurts). After establishing the adequacy of the factorial analysis (KMO = 0.94; Bartlett χ2 (78) = 1711.06, P < 0.001) and based on the Kaiser criterion, a principal axis factor analysis identified one factor. This solution accounted for 62.0% of the variance. The factor showed excellent internal reliability (α = 0.9531). The final score was calculated based on the items' average, and higher results correspond to higher levels of pain catastrophizing.
2.2.2.3. KinesiophobiaThe Tampa Scale of Kinesiophobia (TSK-13-VP)42; p.v.,9 assesses fear of movement, ie, an excessive and maladaptive fear of activity due to the feeling of being vulnerable to pain or (re)injury.32 It assesses 2 dimensions: the fear of suffering from a serious medical condition (henceforth, somatic focus) and the fear that activity may lead to increased pain or reinjury (henceforth, fear of activity). The Portuguese version includes 13 items, answered on 4-point scales ranging from 1 (strongly disagree) to 4 (strongly agree). To identify latent factors under the scale and given the adequacy of the data (KMO = 0.87; Bartlett χ2 (45) = 606.41, P < 0.001), a principal axis factor analysis with orthogonal rotation was conducted. After excluding 3 items due to low communalities or ambiguous loadings, 2 factors were extracted based on the Kaiser criterion, accounting for 57.0% of the total variance: (1) somatic focus (4 items; α = 0.7531), eg, My body is telling me I have something dangerously wrong, and (2) fear of activity (6 items; α = 0.8431), eg, I'm afraid that I might injure myself if I exercise. The final score of each factor was computed by averaging the respective items, with higher scores indicating higher levels of somatic focus and fear of activity.
2.2.2.4. Pain-related activity patternsThe Patterns of Activity Measure-Pain (POAM-P)5; p.v.58 measures 3 activity patterns, ie, how people carry out their daily activities when in pain (avoidance, pacing, and overdoing). The Portuguese version includes 28 items assessed on a 5-point scale ranging from 0 (never) to 4 (always). In our sample, the dimensions were identified through a principal axis factor analysis with orthogonal rotation after ensuring the adequacy of the matrix (KMO = 0.87; Bartlett χ2 (210) = 1777.56, P < 0.001). During the process, 7 items were excluded due to high or ambiguous cross-loadings or low communalities. The 3 factors explained 55.4% of the total variance: (1) avoidance (10 items; α = 0.8731), ie, decreasing activity as a result of pain-related experience or its anticipation (eg, There are many activities that I avoid because they flare up my pain); (2) pacing (8 items; α = 0.8931), ie, balancing activity management between movement and rest aiming to achieve individual goals (eg, Instead of doing the whole activity, I divide it into small parts and do one part at a time); and (3) overdoing (3 items; α = 0.8131), ie, persistence in activity despite the pain (eg, I keep doing what I am doing until my pain is so bad that I have to stop). The final scores were computed by averaging the respective items; higher scores correspond to higher levels of each activity pattern.
2.2.3. Chronic pain outcomes 2.2.3.1. Depression and anxietyThe Depression Anxiety Stress Scales (DASS-21)34; p.v.47 evaluate 3 dimensions of affective distress experienced during the previous week (depression, anxiety, and stress). In both original and Portuguese versions, each dimension consists of 7 items, answered on 4-point scales ranging from 0 (did not apply to me at all) to 3 (applied to me very much or most of the time). In our study, we only used the depression and anxiety subscales and the factorability of the matrix was accepted (KMO = 0.91; Bartlett χ2 (55) = 1144.21, P < 0.001). A principal axis factor analysis with orthogonal rotation was performed, and 2 factors were identified using the Kaiser criterion. Three items were excluded because of their high or ambiguous cross-loadings, and the 2 factors accounted for 67.3% of the total variance: (1) depression (7 items; α = 0.9331), ie, the degree of depressive symptoms experienced such as hopelessness, devaluation of life, self-depreciation, anhedonia, dysphoria, lack of interest, and inertia (eg, I was unable to become enthusiastic about anything), (2) and anxiety (4 items; α = 0.7631), ie, the degree of anxious symptoms experienced such as autonomic arousal, skeletal muscle effects, situational anxiety, and subjective experience of anxious affect (eg, I was aware of dryness of my mouth). The final score of each factor was achieved by averaging the items, and higher scores correspond to more depression and anxiety.
2.2.3.2. Pain intensity and interferenceThe Brief Pain Inventory—Short Form (BPI-SF)7; p.v.1 assessed pain intensity and interference. In both the original and Portuguese versions, these dimensions include 4 and 7 items, respectively, assessed with 11-point rating scales ranging from 0 (no pain or interference) to 10 (the greatest pain imaginable or completely interfered). From a principal axis factor analysis with adequacy (KMO = 0.92; Bartlett χ2 (36) = 965.7, P < 0.001), 2 factors were extracted by Kaiser criterion and with orthogonal rotation. After removing 2 items due to high or ambiguous cross-loadings, the final solution accounted for 73.0% of the total variance. The identified factors were (1) pain intensity (4 items; α = 0.8831), ie, the self-reported magnitude of the current, worst, least, and average pain experience (eg, Please rate your pain by indicating the one number that best describes your pain at its worst in the last 24 hours), and (2) pain interference (5 items; α = 0.89,31), ie, the extent to which pain interferes with daily activities such as general activity, walking, work, mood, enjoyment of life, social relations, and sleep (eg, Indicate the one number that describes how, during the past 24 hours, pain has interfered with your general activity). The final scores resulted from averaging the respective items with higher values indicating higher pain severity and interference levels.
2.2.3.3. Physical function and vitalityThe Medical Outcomes Study-36—Short Form 36v2 (SF-36 v2)60; p.v.19,20 was used to assess physical function and vitality. Original and Portuguese versions measured physical function with 10 items using using a 3-point scale ranging from 1 (very limited) to 3 (not limited). Vitality in the previous 4 weeks was assessed by 4 items rated on 5-point scales ranging from 1 (always) to 5 (never). After checking the factorability of the data (KMO = 0.85; Bartlett χ2 (91) = 1234.58, P < 0.001), a principal axis factor with orthogonal rotation was performed. Three factors were extracted (Kaiser criterion), which accounted for 63.3% of the total variance: (1) physical function (10 items; α = 0.8931), ie, functional limitations in daily physical activities such as running, climbing stairs, using a vacuum cleaner, bathing, or dressing (eg, Does your health now limit you in these activities? If so, how much? Vigorous activities, such as running, lifting heavy objects, participating in strenuous sports); (2) vitality energy (2 items; SB = 0.8631), ie, levels of energy (eg, How much of the time during the past 4 weeks did you have a lot of energy?); (3) and vitality fatigue (2 items; SB = 0.8831), ie, levels of fatigue (eg, How much of the time during the past 4 weeks did you feel tired?). As in previous studies,24 the original vitality dimension was split into 2 factors, detecting energy and fatigue levels separately. The final score of each dimension was computed through an algorithm for converting the respective item ratings into a single score ranging from 0 to 100,19,20 with higher scores indicating better physical function, higher energy, and lower fatigue.
2.3. Data analysisDescriptive statistics of the study variables were analyzed. To assess whether the variable distributions tended towards higher or lower scale levels, one-sample t tests were conducted. Considering the absence of normative standard cut-offs to use as reference and given that most variables were symmetrical, the sample mean was compared with the midpoint of each scale. A bootstrap estimation was performed when a lack of symmetry was found in a few variables (nondistraction, emotional awareness, and depression). The bias obtained was minimal, demonstrating the accuracy of the reported results. Consequently, variable means rated significantly above or below the scale midpoint were considered as reflecting high or low levels of the respective construct being measured. Variables that did not significantly differ from the scale midpoint were interpreted as reflecting moderate levels of the construct being measured. This information was necessary to substantively interpret the meaning of the identified IS profiles.
As the first goal of this study was to understand how the interrelationships between the IS skills may allow the definition of different and multivariate profiles in individuals with chronic musculoskeletal pain, a cluster analysis was conducted. If different IS profiles exist, a cluster analysis can aggregate individuals into groups (clusters), thereby maximizing intragroup homogeneity and intergroup heterogeneity.25 The 7 MAIA dimensions were the input variables for clustering, and entered directly into the algorithm, ie, as quantitative variables. The basis of the algorithm is a proximity matrix, and the distance measure used was the Squared Euclidean distance. From this matrix, the hierarchical clustering algorithm, according to different aggregation methods, analyses the similarity between the individuals and proceeds with the agglomeration. To obtain a more robust extracted solution, 2 different statistical linkage methods were used: the Ward method (its minimum variance method) and the Complete Method (also known as farthest neighbour clustering). Five participants were excluded from the cluster analysis due to missing data. Afterward, one-way analysis of variances (ANOVAs) with Tukey honest significant difference (HSD) for post hoc comparisons were used to identify differences between profiles in the 7 IS skills. Then, to examine the differences between the IS skills profiles in sociodemographic (age, sex, place of birth, marital and cohabitation status, work status, occupation, and years of education) and clinical characteristics (pain duration, regions and pattern, current treatments, pain management activities, and if participants were attending a pain consultation), χ2 and 1-way ANOVAs with Tukey HSD with Bonferroni correction (P = 0.05/3 = 0.017) were conducted for categorical and continuous variables, respectively. Finally, to investigate the differences between IS skills profiles on pain-related processes and outcomes, univariate and multivariate analyses of variance (ANOVA and MANOVA) were conducted. MANOVA were conducted to analyze 5 sets of dependent variables (regarding outcomes and processes). In line with current guidelines,25 these sets of dependent variables were defined based on their conceptual links and correlations (see results section). First, according to the fear-avoidance model,59 pain catastrophizing and kinesiophobia (both dimensions) were grouped in the same set as fear-avoidance beliefs and affects. Second, the 3 activity patterns assessed by the POAM-P (avoidance, pacing, and overdoing) constituted the activity patterns set. Third, depression and anxiety were considered an expression of affective distress.39 Fourth, both dimensions of vitality (energy and fatigue) were considered together as representing vitality. Finally, pain intensity and interference were grouped since they express pain severity. Univariate analyses of variance followed by the Tukey HSD test were used for physical function and pain-related self-efficacy. The ANOVA and MANOVA were conducted using an unbalanced design. Nevertheless, the recommended minimum cell size (2025) was guaranteed, and all the necessary assumptions (equality of variance and normality) were confirmed. When necessary, in ANOVA, Welch and Brown–Forsythe tests were also performed to confirm the robustness of the results, as they are more reliable than the classic F when variances are unequal.22 Data management and analysis were performed using the Statistical Package for the Social Sciences, version 28.0 (SPSS, Inc, Chicago, IL).
3. Results 3.1. Participants' characteristicsTable 1 presents detailed information about the sociodemographic and clinical characteristics of the participants. One hundred seventy-three adults with chronic musculoskeletal pain participated in this study. They were mostly women born and living in Portugal and aged between 22 and 86 years old. Most participants were married or in common-law and were living with family members. Their years of formal education ranged between 0 and 26 years. Most participants were working at the time of the study, and about 14% were on sick leave.
Table 1 - Sociodemographic and clinical characteristics of the overall sample and the participants of the 3 profiles of interoceptive sensibility skills. Total sample (n = 173) Mixed interoceptive skills (1) (N = 71) High interoceptive skills (2) (N = 68) Low interoceptive skills (3) (N = 29) Differences between profiles* p Sex N (%) Males*To examine sociodemographic and clinical differences between profiles, χ2 was conducted for categorical variables and 1-way ANOVAs with Tukey HSD with Bonferroni correction (P = 0.05/3 = 0.017) were calculated for continuous variables.
†Other places of birth included Angola, Brazil, Cabo Verde, France, Germany, Mozambique, São Tomé and Príncipe, Spain, and Venezuela.
‡Categories based on the International Standard Classification of Occupations.
n.s., nonsignificant.
As for the clinical characteristics, participants reported an average pain duration of over a decade, ranging from 7 months to 49 years. Most participants reported experiencing generalized continuous pain. Localized pain was mostly reported on low back and hip or lower limbs. Almost half of our sample was attending a specialized pain unit or consultation, and most were taking medication for pain relief. About one-fifth reported having psychiatric or psychological support, but only 15.0% were receiving physiotherapy treatments. Almost half of the participants reported performing activities to self-manage their pain (eg, walking, exercise, and Pilates).
3.2. Analysis of the study variablesDescriptive statistics and one-sample t tests having as reference the scale midpoint of each variable are presented in Table 2. Overall, most variables showed symmetrical (−3.00 < skewness/SE of skewness < 3.0029) and mesokurtic distributions (−0.3.00 < kurtosis/SE of kurtosis < 3.0029), with participants responses covering the entire scale ranges. The exceptions were not distracting, emotional awareness, and depression, which were particularly skewed, with most participants' responses concentrating on the scale's lower (not distracting and depression) and higher (emotional awareness) values, respectively. Emotional awareness also presented a leptokurtic distribution.
Table 2 - Descriptive statistics and one sample t test for interoceptive sensibility skills and pain-related processes and outcomes. Variable [possible min-max] Midpoint Min-max M SD Kurtosis/SE kurtosis Skewness/SE skewness One-sample t test* P Interoceptive sensibility Not distracting [0-5]
留言 (0)