
記住我


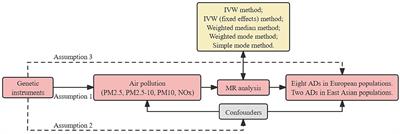

Acute myocardial infarction (AMI) continues to carry a substantial health burden worldwide (1). Ambient temperature has been established to mediate an elevated risk of AMI (2–4). However, long-term cold and heat exposure generates biological and behavioral acclimatization, thus modifying the influence of absolute temperature (5, 6). For example, early studies showed a more pronounced effect of lower temperatures during warmer years (4). Prior studies linked short-term cold exposure to increased inflammation and hyper-coagulation, predisposing individuals to AMI (7). Also, temperature fluctuations disrupt autonomic function by elevating blood pressure and heart rate (8), exaggerating the myocardial oxygen demand–supply imbalance in those with preexisting coronary lesions (9).
Recent data highlighted the adverse effect of temperature fluctuation using an array of metrics (10–16). Intra-day temperature range and day-to-day temperature difference are commonly studied metrics, capturing different aspects of temperature fluctuations. In prior studies, greater neighboring day temperature differences were linked to increased cardiovascular visits and hospitalizations (17). A larger diurnal temperature range contributed to increased coronary heart disease-related death (18) and out-of-hospital cardiac arrests (19). However, few studies examined the impacts of temperature range differences within a single cohort. Also, it remains unclear whether 1-day intervals are the optimal observation periods for assessing day-to-day temperature differences and temperature ranges.
In this time-series study, we used registry data for all AMI hospitalization in Beijing, China, a heavily populated city with a humid continental climate. We performed an extended analysis on two basic measures: temperature range and daily mean temperature difference, aiming to understand their effects on AMI hospitalization and explored the optimal observation intervals. Additionally, we sought to identify susceptible age and sex subgroups for different patterns of temperature fluctuation, thus informing targeted prevention strategies.
2 Materials and methods 2.1 Data collectionWe collected all cases of hospital admission for AMI between January 1st, 2013 and December 31st, 2016 in Beijing. Data were obtained from the Beijing Municipal Health Commission Information Center. Anonymous demographic and residential information was collected, including the institute of admission, date of onset, gender, age, primary diagnosis, and comorbidities. Birthplace, current residential address, and workplace address were used to exclusively include patients who resided in Beijing. Patients aged between 20–74 years old were included in the analysis. AMI hospitalization was identified by the primary diagnostic code of I21–I22, according to the International Classification of Diseases 10th revision (ICD-10). The study was approved by the Peking Union Medical College Hospital (PUMCH) Institutional Review Board.
City-level meteorological data, including daily mean temperature (Tmean), maximum temperature (Tmax), minimum temperature (Tmin), air pressure, relative humidity (RH), and wind speed (WS) were recorded by the China Meteorological Administration (CMA). The data were collected by a stationary monitoring station located near the city center (Station code: 54511). Air pollutant data were included as confounding factors, which were collected from 35 monitoring stations across Beijing. This included the hourly concentration of both the particulate (PM2.5, PM10) and gaseous air pollutants (SO2, NO2, O3, CO). To address daily variations in a set of pollutants, we calculated the Air Quality Index (AQI) which combines the effects of six common air pollutants for the same period. Influenza was independently associated with an increased risk of AMI in the previous study (20). We collected data on influenza epidemic (IF), which was defined as when the positive rate of influenza isolation in any given week exceeded 20% of the maximum weekly positive rate of influenza isolation in the whole surveillance season (from the 27th week of the previous year to the 26th week of the following year) in northern China (13, 14). The influenza surveillance data were obtained from the Chinese National Influenza Center.
2.2 Temperature variablesWe estimated the influence of temperature range (TRn) and daily mean temperature difference (DTDmeann) on the count of AMI hospital admissions. TRn represents the difference between maximal temperature and minimum temperature over an n-day period, ie. Tmax minus Tmin over n days. DTDmeann was derived from the mean temperature difference between the current day and n day prior. To further understand the intra-day cold and heat effects, we investigated intra-day cold and heat effects using daily maximum/minimum and mean temperature difference (TDmax/TDmin) which represented the same-day Tmax/ Tmin minus mean temperature.
2.3 Statistical analysisDistributed Lag Non-linear Model was established to fit the nonlinear effect and lag effect of independent variables (12–14). Long-term and seasonal trends were controlled using a natural cubic spline with 7 degrees of freedom (df) for the time. We defined the seasons based on astronomical seasons, which were spring (March 20th to March 21st), summer (June 20th to June 21st), autumn (September 22nd to September 23rd), and winter (December 20th to December 21st). Wind speed, air pressure, relative humidity, and Air Quality Index were adjusted using a natural cubic spline with 3 df. Public holiday (PH) and day of the week (DOW) were adjusted for their impacts on the behavioral patterns. The full model was as below:
logEYt=α+cbTempt,lag,df=4+nsTime,df=7peryear+nsWS,df=3+nsAP,df=3+nsRH,df=3+nsAQI,df=3+β1∗DOW+β2∗IF+β3∗PHE (Yt) denotes the number of AMI hospital admissions on day t. α and β were the model intercept and regression coefficient, respectively. cb represents the cross-basis function and ns indicates the natural cubic spline function. Tmp refers to different temperature variables. Time refers to the time to control the season and long-term trends. df represents the degree of freedom.
3D maps depicted the overall relationship between temperature variables and AMI relative risks (RR) over 21 lag days (lag). We plotted the lag-response curves of temperature variables at 1st, 5th, 95th, and 99th, respectively. Twenty-one-day cumulative relative risk (CRR), the sum of the relative risk of each lag day within 21 days, was calculated to assess the overall effects of temperature variables and control the possible harvesting effect. The most moderate temperature difference (MMTD) was defined as the optimal temperature difference that carries the lowest risk of AMI, which served as the reference when evaluating relative risks. We performed stratification analysis by gender and age (<65 vs. ≥65 years old) and tested the reliability of the results. Statistical analyses were conducted in R software (R x64 v3.4.2) using “mgcv” and “dlnm” packages. A two-sided p value of 0.05 was considered statistically significant.
3 Results 3.1 Descriptive analysisBetween 2013 and 2016, we identified a total of 81,029 hospitalizations for AMI, with 55,669 (68.7%) being male and 36,989 (45.6%) under the age of 65. We observed a trend of increase in hospital admissions for AMI. Supplementary Table S1 shows the descriptive statistics of the study population and meteorological data in Beijing, China.
The maximum, mean, and minimum daily temperatures were 19.01°C, 12.94°C, and 7.19°C, respectively. The mean Air Quality Index, relative humidity, wind speed, and air pressure were 123.65 ± 75.17, 53.43 ± 19.86, 9.29 ± 4.75 m/s, 53.43 ± 19.86%, and 1016.555 ± 10.17 hPa, respectively. Summary statistics for meteorological and air pollution are summarized in Supplementary Table S2.
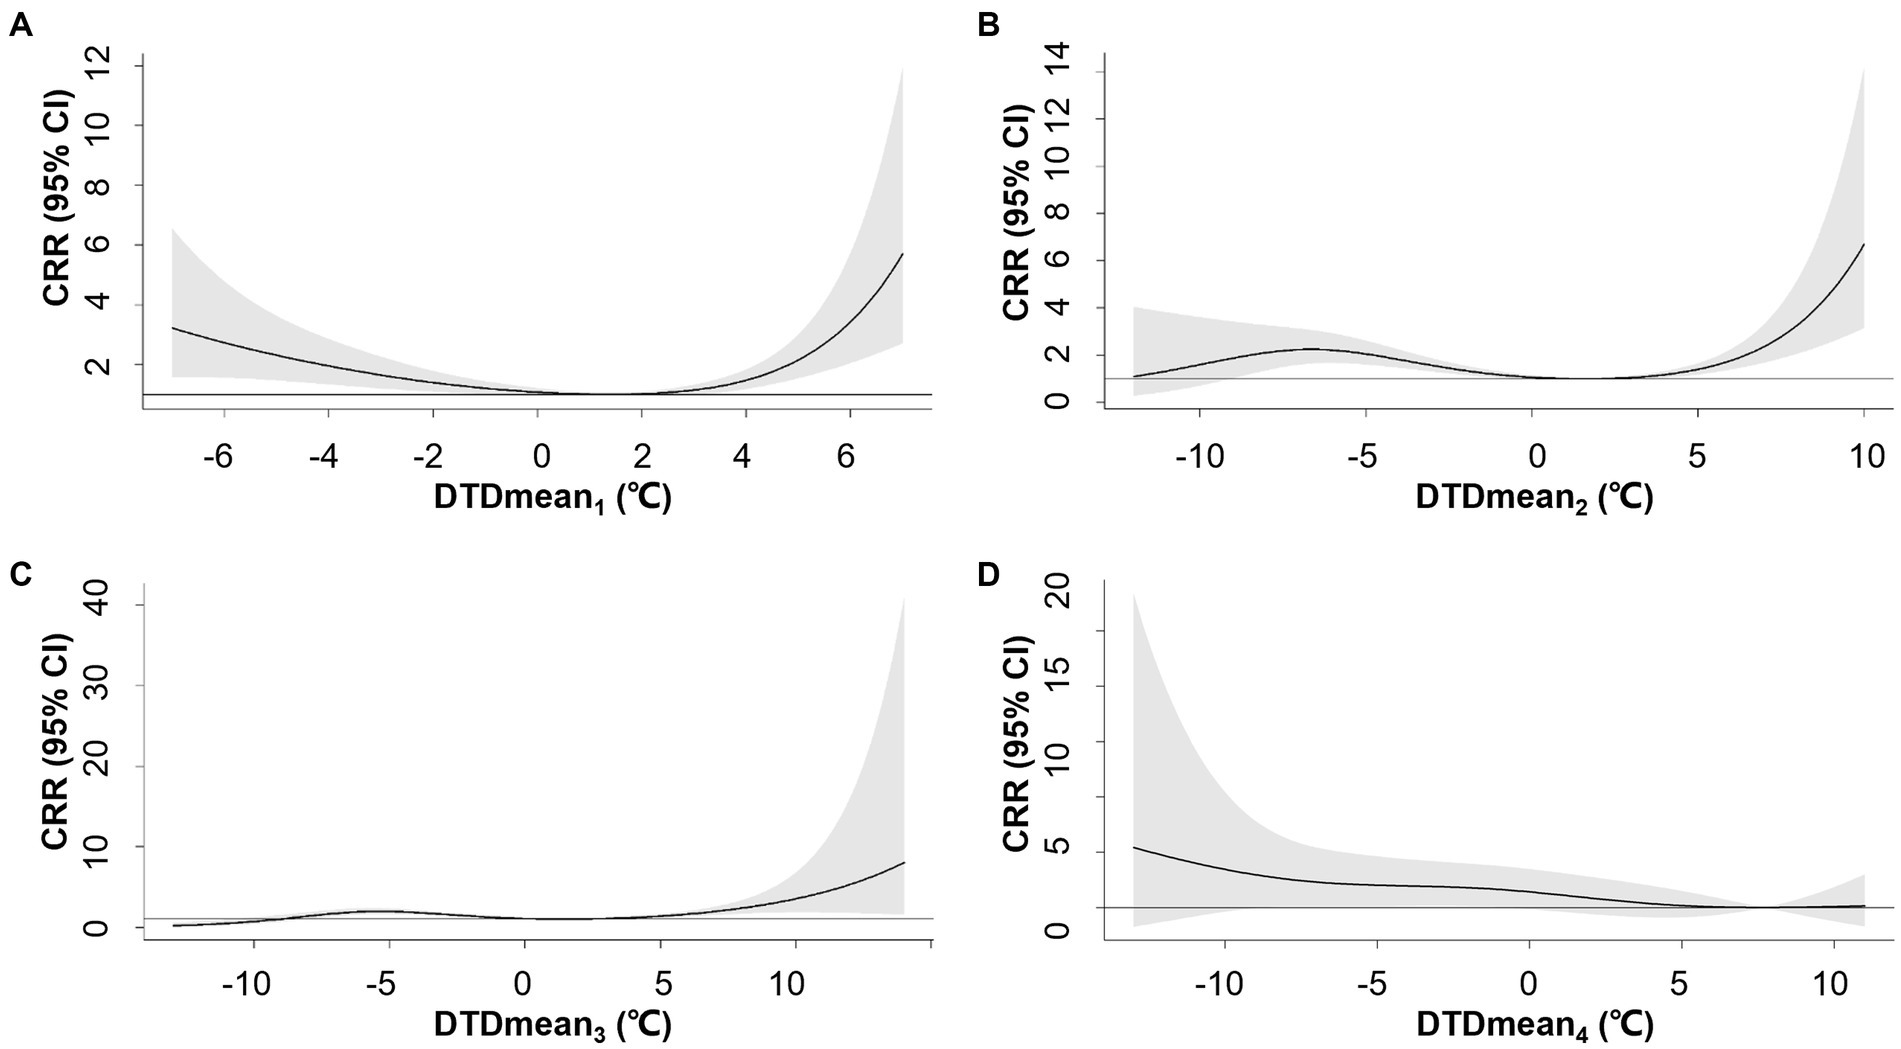
3.2 Cumulated relative riskCompared to DTDmean1, longer exposure intervals (DTDmean2-4) attenuated the association between DTDmean and AMI hospitalization (Figure 1). Notably, DTDmean4 did not increase the risk of AMI hospitalization. The exposure-response association between DTDmean1 and AMI hospitalization was U-shaped. The AMI hospitalization risk reached a nadir at 1.4°C, namely MMTD for DTDmean1, and marked increases in risk were observed at both low and high DTDmean1. On days with DTDmean1 values at the 1st percentile (−6°C) and 99th percentile (5°C), the CRR reached 2.73 (95% confidence interval, CI: 1.56–4.79) and 2.15 (95% CI: 1.54–3.01), respectively (Supplementary Table S3).
Figure 1. Overall exposure-response associations between neighboring-day mean temperature difference (DTDmean) over 1–4 days (A–D) and cumulative relative risks (CRR) for AMI hospitalization. Shaded areas represent 95% CI.
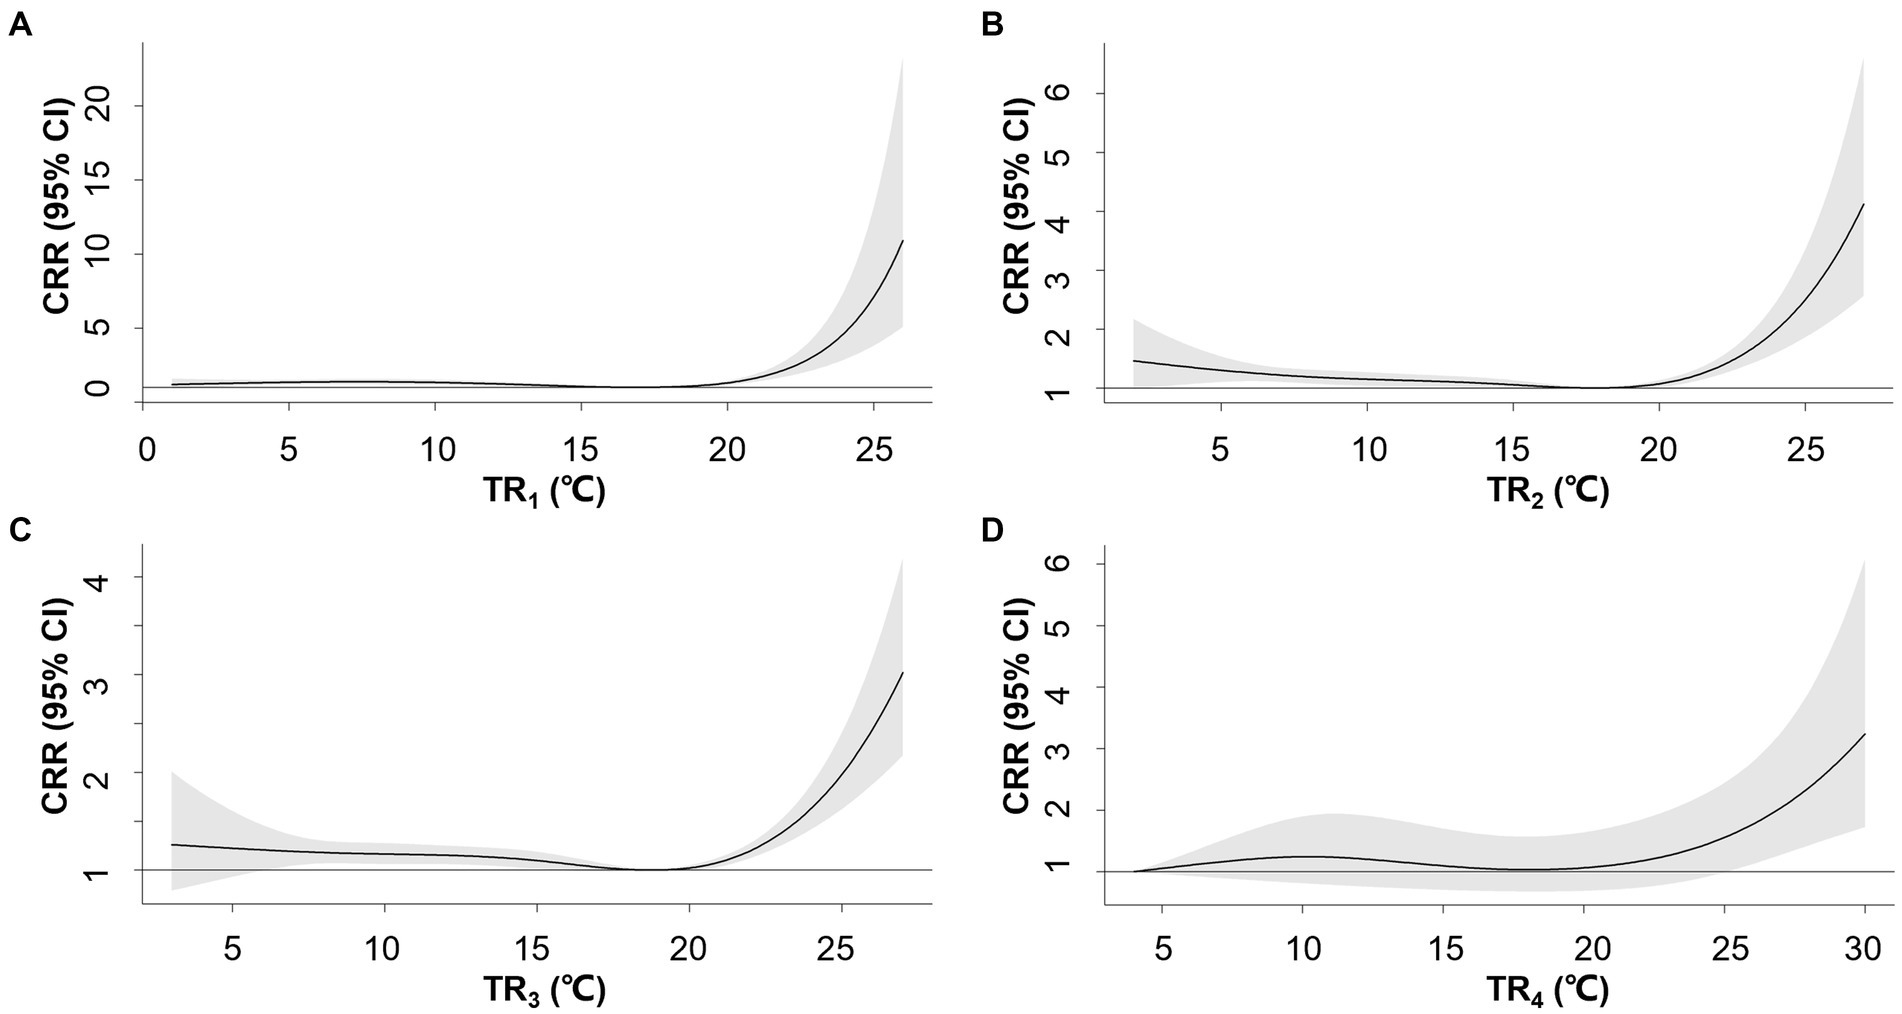
The association between TR and AMI hospitalization weakened with longer exposure intervals when comparing TR1-5 (Figure 2). No significant relationship was observed between TR5 and the risk of AMI hospitalization. The association between TR1 and the risk of AMI hospitalization exhibited a J-shaped pattern, where the risk increased when TR1 exceeded 16.9°C. TR1 at the 95th (19°C) and 99th percentile (22°C) were associated with CRRs of 1.12 (95% CI: 1.04–1.20) and 2.0 (95% CI: 1.73–2.85), respectively (Supplementary Table S4).
Figure 2. Overall exposure-response associations between temperature range (TR) over 1–4 days (A–D) and cumulative relative risks (CRR) for AMI hospitalization. Shaded areas represent 95% CI.
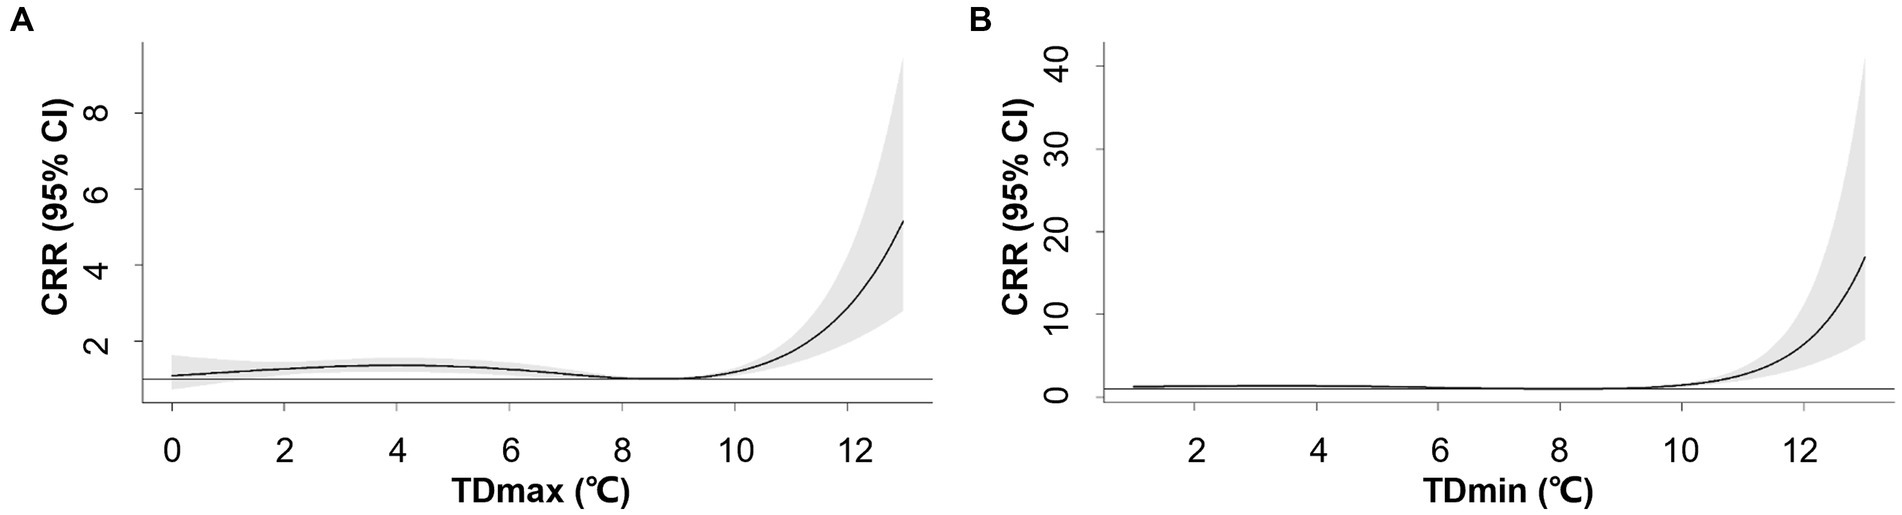
The overall patterns of TDmax/TDmin-AMI hospitalization association were similar to TR1 with varying magnitude of association (Figure 3). The positive associations were observed when TDmin and TDmax exceeded 8.1°C and 8.6°C, respectively. For TDmax at the 95th percentile (10°C) and 99th percentile (11°C), the CRRs were 1.18 (95% CI: 1.09–1.29) and 1.71 (95% CI: 1.40–2.09), respectively (Supplementary Table S5). For TDmin at the 95th percentile (9°C) and 99th percentile (11°C), the corresponding CRRs were 1.07 (95% CI: 1.00–1.15) and 2.73 (95% CI: 2.04–3.66), respectively (Supplementary Table S6).
Figure 3. Overall exposure-response associations between maximum-mean temperature difference (TDmax, A), mean-minimum temperature difference (TDmin, B) and cumulative relative risks (CRR) for AMI hospitalization. Shaded areas represent 95% CI.
3.3 Single-day Lag effectsNegative (temperature decline) and positive (temperature rise) DTDmean1 showed different patterns of lag effects (Supplementary Figure S1). The RR of DTDmean1 at −6°C (1st percentile) and − 4°C (5th percentile) peaked on lag day 10 and yielded a lag effect throughout lag day 3 to 18 and lag day 3 to 21, respectively. For positive DTDmean1, we observed delayed peak lag effects. The effect of DTDmean1 at 5°C (99th percentile) and 4°C (95th percentile) both extended from lag day 1 to 21, with the RR peaked on lag day 21.
Similar lag patterns were observed among TR1, TDmax, and TDmin at the 99th percentile, which lasted for 20 days and peaked on lag day 2–3 (Supplementary Figure S2). No significant associations were found for TR1 and TDmax at the 95th percentile. For TDmin at the 95th percentile (9°C), the lag effect was only significant on lag day 0 and 1, reaching the peak RR on lag day 0.
Supplementary Figure S3 shows the 3D mapping of the association between relative risk AMI hospitalization and DTDmean1, TR1, TDmax, and TDmin over the 21-day lag period.
3.4 Age- and sex-specific effectCompared to their younger counterparts, individuals aged over 65 years were at higher risk of AMI hospitalization on days with negative DTDmean1 (−6°C) [3.04 (95% CI: 1.48–6.22) vs. 2.40 (95% CI: 1.17–4.92)]. Negative DTD mean1 was more strongly associated with the AMI hospitalization risk in females than males [3.40 (95% CI: 1.42–8.12) vs. 2.46 (95% CI: 1.29–4.67)] (Supplementary Figure S4). Comparable CRRs were observed among age and sex subgroups with positive DTDmean1 (Supplementary Table S3).
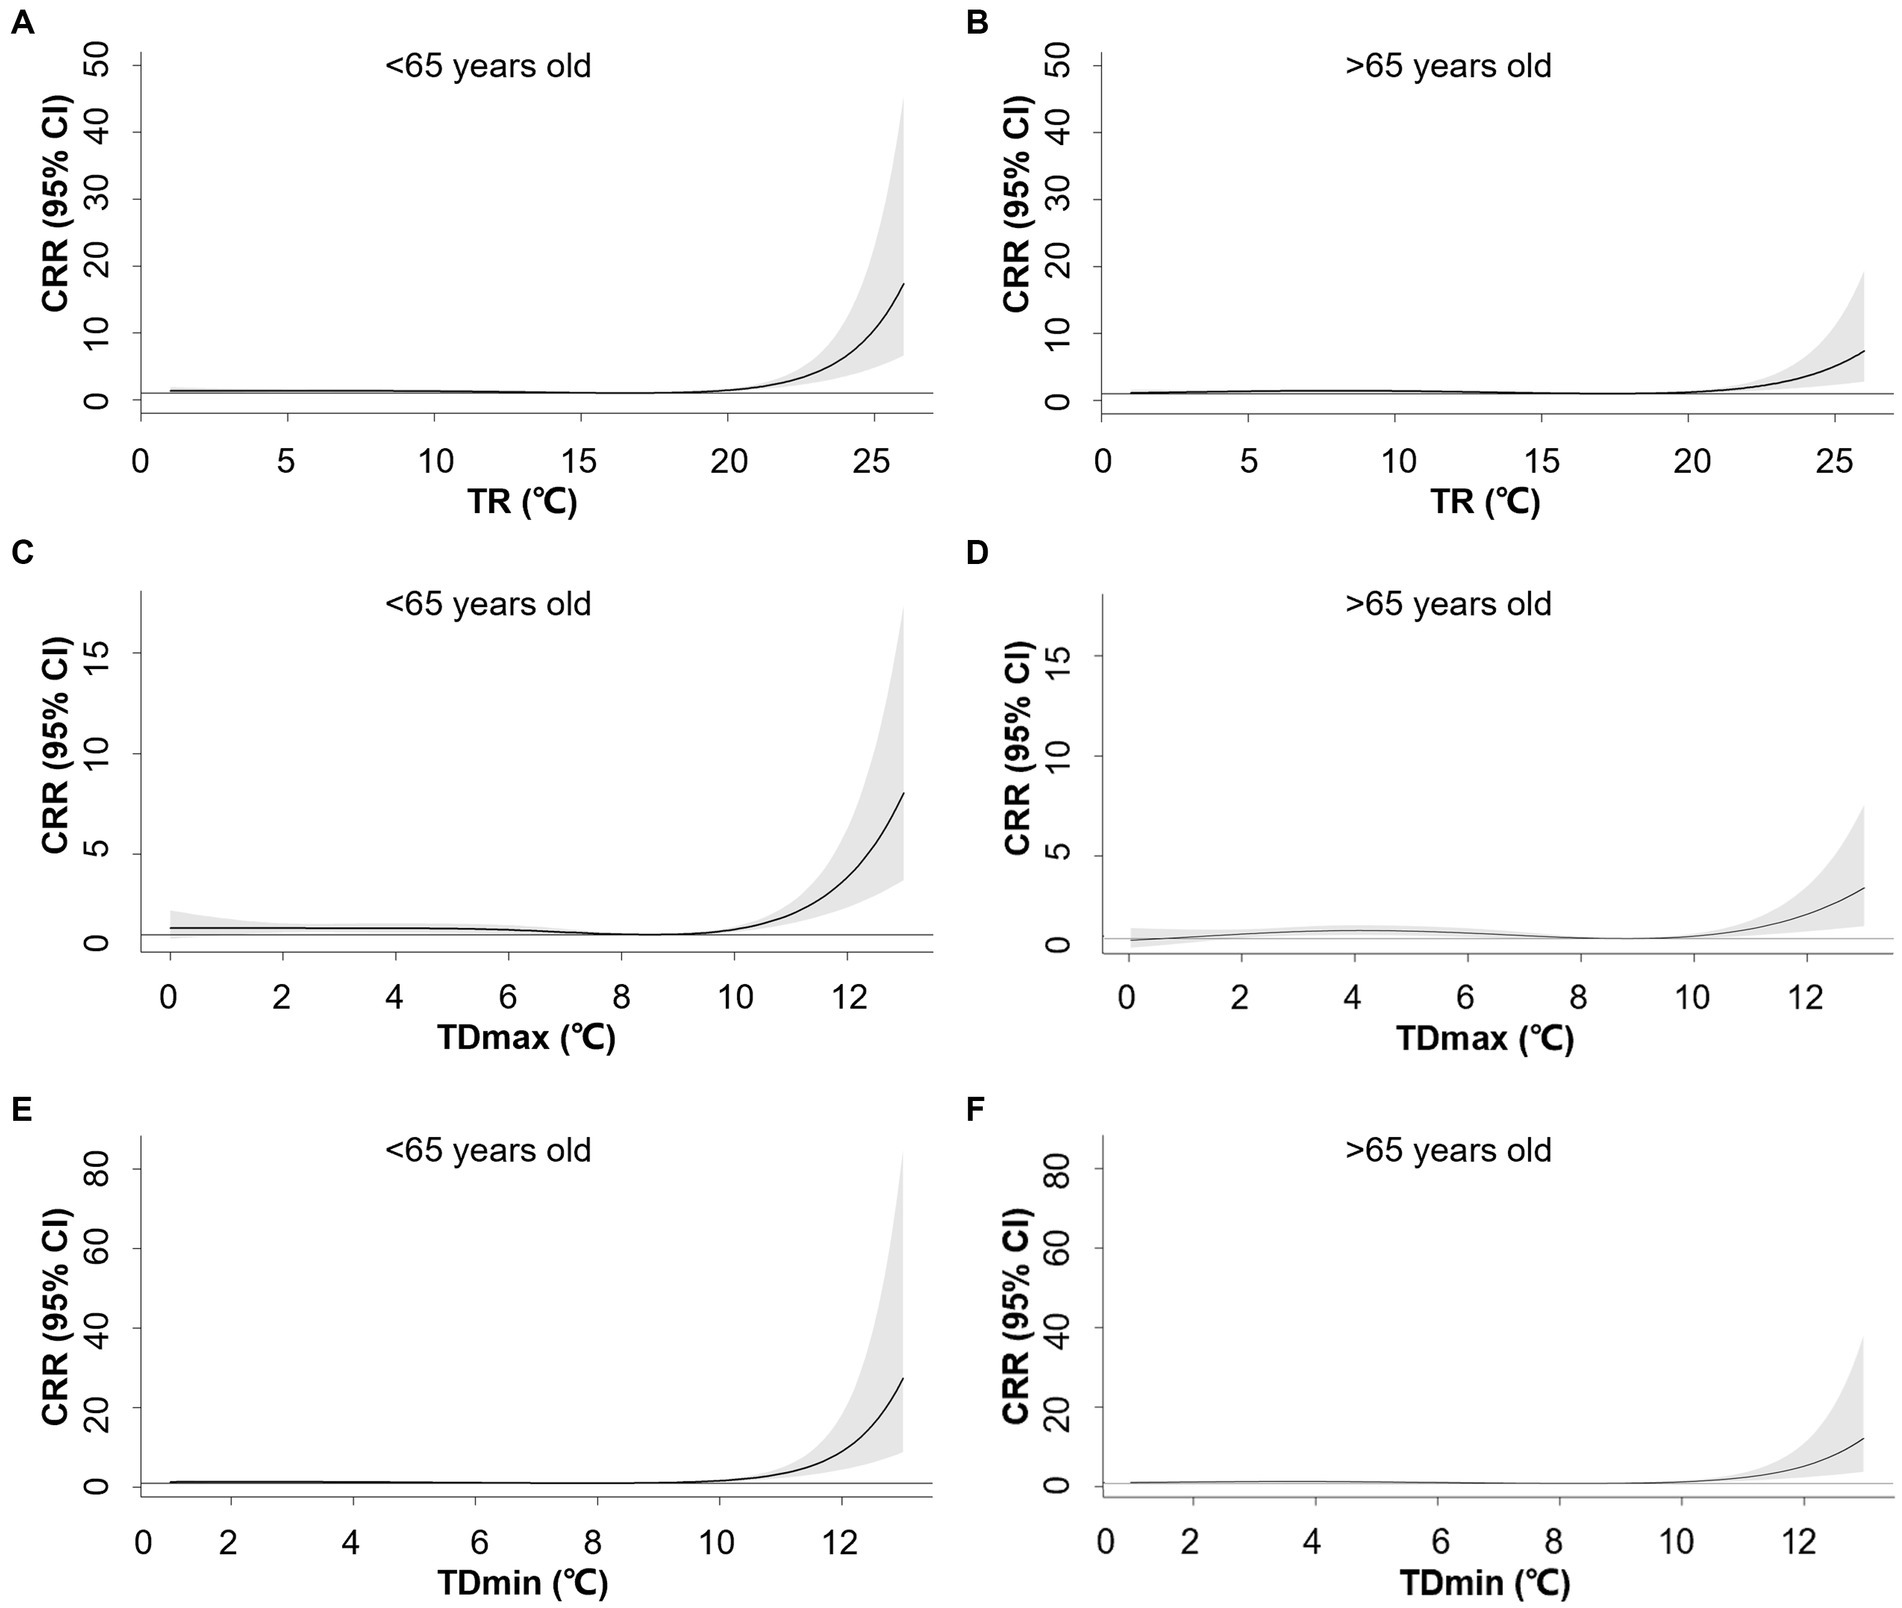
In contrast, the associations between TR1, TDmax, and TDmin were attenuated at older ages. For TR1 at the 99th (22°C) percentile, the CRR was 2.69 (95% CI: 1.07–3.68) for the younger group and 1.90 (95% CI: 1.38–2.60) for the older group. TDmax at the 99th percentile (11°C) corresponded to a CRR of 2.01 (95% CI: 1.56–2.59) for the younger group and 1.49 (95% CI: 1.15–1.92) for the older group. Specifically, TDmin yielded a CRR of 3.36 (95% CI: 2.32–4.87) for the younger group and 2.29 (95% CI: 1.58–3.33) for the older group at the 99th percentile (11°C) (Figure 4). Slightly increased risks were noted for females with greater TR1, TDmax, and TDmin (Supplementary Figure S5 and Supplementary Tables S4–S6).
Figure 4. Exposure-response associations between 1-day temperature range (TR1, A,B), maximum-mean temperature difference (TDmax, C,D), mean-minimum temperature difference (TDmin, E,F) and cumulative relative risks (CRR) for AMI hospitalization stratified by age. Shaded areas represent 95% CI.
4 DiscussionIn this study, we conducted a comprehensive analysis of the impacts of temperature range and differences on AMI hospitalization in Beijing, China. Increased temperature range and day-to-day temperature difference were both associated with higher AMI risk with the optimal 1-day observation interval. Specifically, the older adult population was more susceptible to day-to-day temperature differences, while the younger population was subject to larger temperature ranges, represented by TR1, TDmin, and TDmax. Females were more affected by neighboring-day temperature declines.
Previous studies have linked neighboring-day temperature differences to coronary heart disease. In a study conducted in Brisbane and Los Angeles, a temperature drop and increase of more than 3°C between neighboring days were associated with a relative risk of 1.252 (95%CI: 1.131–1.386) and 1.35 (95% CI: 1.033, 1.772) for cardiovascular deaths during summer (21). Similarly, Shi et al. demonstrated a V-shaped relationship between neighboring day temperature differences and cardiovascular visits and hospitalizations in northwest China (17). These findings suggest that day-to-day temperature change, regardless of the direction of the change, contributes to increased cardiovascular risks.
The diurnal temperature range (DTR), in our setting, TR1, was also related to increased AMI risks. A study in Shanghai, China showed that a 1°C increment in the DTR yielded a 2.46% increase in coronary heart disease-related death (18). In a New York-state-based study, DTR was positively associated with AMI risk (10). In a Japanese study between 2005 and 2013, DTR was related to increased risks of out-of-hospital cardiac arrests, but less significant when compared to mean temperature (19). However, Lim et al. found an adverse effect between DTR and cardiovascular admissions, but no effect on AMI in Korea between 2003 and 2006 (22). In addition, we examined the influence of cold and heat effects by incorporating TDmin and TDmax. We found that TDmin had a more substantial impact on AMI risks, indicating a stronger association with cold temperature extremes.
Few studies examined the impacts of observation intervals, primarily focusing on 1 to 2 days of variability. A Brazilian study between 2000 and 2015 observed the most significant effect of temperature variability (measured as the standard deviation of daily minimum and maximum temperatures) on ischemic heart disease risk during 0–1 day, with the effect diminishing over 0–4 days (23). Despite the strongest estimates for 1-day exposure, we also identified a minor yet statistically significant effect of temperature fluctuation over 2 to 3 days. These results are consistent with the findings of Pearce et al., who showed that temperature trajectories in preceding days modified the associations between daily temperature and mortality in Melbourne, Australia (24).
The effect of temperature fluctuations on the risk of AMI hospitalization varied by age. In line with the previous studies, the older adult population, characterized by diminished thermoregulatory capacity, displayed greater susceptibility to day-to-day temperature variations (10, 22). Contrary to prior findings, we observed that younger participants were more prone to significant intra-day temperature ranges. In addition, low-temperature extremes, represented by TDmin may contribute to a more pronounced influence on AMI. This discrepancy might be attributed to the lower age cut-off compared to the previous studies (75 years) (22, 25), which consisted mainly of the working population. We hypothesized that daily commutes led to greater temperature fluctuation exposure, resulting in a higher risk of AMI in the younger population. Additional behavioral studies are needed to investigate these discrepancies.
Existing data demonstrated inconsistent modification effects by sex. In the WHO MONICA project between 1980 and 1995, females living in warm climates exhibited higher coronary event rates during cold periods (2). However, no gender differences in the seasonality of AMI hospitalization in the Taiwan study between 1997 and 2011 (26). An hour-to-hour study in Queensland, Australia, showed that elevated risks occurred more acutely in males following extreme cold exposure (9 h in males vs. 19 h in females) (27). Physiological studies suggest that females had weaker sweating responses, greater heat loss due to a larger surface area, and periodic thermoregulation due to menstrual cycles (28, 29). However, geographic differences may account for the divergence across the study, involving biological and habitual adaptations. For example, in the Brazilian study, males engaged in more outdoor activities, possibly making them more susceptible to ambient temperature (23).
Our study focused on observations in Beijing, a densely populated temperate city. We investigated the effects of DTDmean and TR over 1–5 days’ exposure and their differential effects on age and sex. However, our study has several limitations. Firstly, as a single-city study, the findings may not apply to regions with different climate types. Secondly, the data might not represent individual-level exposure, as indoor temperature exposure was not analyzed. Lastly, using data from city-wide monitoring stations introduces potential measurement errors that cannot be fully eliminated.
5 ConclusionTemperature fluctuations were linked to increased AMI hospitalizations, with low-temperature extremes having a more pronounced effect. Females and the older adult were more susceptible to daily mean temperature variations, while younger individuals were more affected by larger temperature ranges.
Data availability statementThe original contributions presented in the study are included in the article/Supplementary material, further inquiries can be directed to the corresponding authors.
Ethics statementThe studies involving humans were approved by Peking Union Medical College Hospital (PUMCH) Institutional Review Board. The studies were conducted in accordance with the local legislation and institutional requirements. Written informed consent for participation was not required from the participants or the participants' legal guardians/next of kin in accordance with the national legislation and institutional requirements.
Author contributionsST: Formal analysis, Writing – original draft, Writing – review & editing. JF: Conceptualization, Data curation, Formal analysis, Writing – original draft. YL: Formal analysis, Writing – review & editing. YZ: Data curation, Writing – review & editing. YC: Methodology, Writing – original draft. YH: Software, Writing – original draft. XZ: Project administration, Writing – review & editing. YL: Software, Writing – original draft. XJ: Investigation, Project administration, Supervision, Validation, Visualization, Writing – review & editing. ZF: Funding acquisition, Project administration, Supervision, Validation, Writing – review & editing.
FundingThe author(s) declare financial support was received for the research, authorship, and/or publication of this article. This work was funded by National High Level Hospital Clinical Research Funding (2022-PUMCH-C-024, 2022-PUMCH-B-030, 2022-PUMCH-A-241), National Natural Science Foundation (12126602 and 91643208), Chinese Academy of Medical Sciences Initiative for Innovative Medicine (2017-I2M-2-001), Yunnan Provincial Clinical Research Center for Cardiovascular Diseases (202302AA310045), and Fuwai Yunnan Cardiovascular Hospital for Cardiovascular Diseases (2019YFKT-09).
AcknowledgmentsWe sincerely thank Beijing Municipal Health Commission Information Center, Chinese National Influenza Center, and China Meteorological Administration for data collection.
Conflict of interestThe authors declare that the research was conducted in the absence of any commercial or financial relationships that could be construed as a potential conflict of interest.
Publisher’s noteAll claims expressed in this article are solely those of the authors and do not necessarily represent those of their affiliated organizations, or those of the publisher, the editors and the reviewers. Any product that may be evaluated in this article, or claim that may be made by its manufacturer, is not guaranteed or endorsed by the publisher.
Supplementary materialThe Supplementary material for this article can be found online at: https://www.frontiersin.org/articles/10.3389/fpubh.2023.1287821/full#supplementary-material
Footnotes References1. Mensah, GA, Roth, GA, and Fuster, V. The global burden of cardiovascular diseases and risk factors: 2020 and beyond. J Am Coll Cardiol. (2019) 74:1558–3597. doi: 10.1016/j.jacc.2019.10.009
CrossRef Full Text | Google Scholar
2. Barnett, AG, Dobson, AJ, McElduff, P, Salomaa, V, Kuulasmaa, K, Sans, S, et al. Cold periods and coronary events: an analysis of populations worldwide. J Epidemiol Community Health. (2005) 59:551–7. doi: 10.1136/jech.2004.028514
PubMed Abstract | CrossRef Full Text | Google Scholar
3. Gerber, Y, Jacobsen, SJ, Killian, JM, Weston, SA, and Roger, VL. Seasonality and daily weather conditions in relation to myocardial infarction and sudden cardiac death in Olmsted County, Minnesota, 1979 to 2002. J Am Coll Cardiol. (2006) 48:287–92. doi: 10.1016/j.jacc.2006.02.065
PubMed Abstract | CrossRef Full Text | Google Scholar
4. Wolf, K, Schneider, A, Breitner, S, von Klot, S, Meisinger, C, Cyrys, J, et al. Air temperature and the occurrence of myocardial infarction in Augsburg, Germany. Circulation. (2009) 120:735–42. doi: 10.1161/CIRCULATIONAHA.108.815860
PubMed Abstract | CrossRef Full Text | Google Scholar
5. Yurkevicius, BR, Alba, BK, Seeley, AD, and Castellani, JW. Human cold habituation: physiology, timeline, and modifiers. Temperature (Austin). (2022) 9:122–57. doi: 10.1080/23328940.2021.1903145
PubMed Abstract | CrossRef Full Text | Google Scholar
6. Young, AJ, Castellani, JW, O’Brien, C, Shippee, RL, Tikuisis, P, Meyer, LG, et al. Exertional fatigue, sleep loss, and negative energy balance increase susceptibility to hypothermia. J Appl Physiol. (1998) 85:1210–7. doi: 10.1152/jappl.1998.85.4.1210
PubMed Abstract | CrossRef Full Text | Google Scholar
7. Mercer, JB, Østerud, B, and Tveita, T. The effect of short-term cold exposure on risk factors for cardiovascular disease. Thromb Res. (1999) 95:93–104. doi: 10.1016/S0049-3848(99)00028-6
PubMed Abstract | CrossRef Full Text | Google Scholar
8. Tang, M, He, Y, Zhang, X, Li, H, Huang, C, Wang, C, et al. The acute effects of temperature variability on heart rate variability: a repeated-measure study. Environ Res. (2021) 194:110655. doi: 10.1016/j.envres.2020.110655
PubMed Abstract | CrossRef Full Text | Google Scholar
10. Rowland, ST, Parks, RM, Boehme, AK, Goldsmith, J, Rush, J, Just, AC, et al. The association between ambient temperature variability and myocardial infarction in a New York-state-based case-crossover study: an examination of different variability metrics. Environ Res. (2021) 197:111207. doi: 10.1016/j.envres.2021.111207
PubMed Abstract | CrossRef Full Text | Google Scholar
11. Marti-Soler, H, Gonseth, S, Gubelmann, C, Stringhini, S, Bovet, P, Chen, PC, et al. Seasonal variation of overall and cardiovascular mortality: a study in 19 countries from different geographic locations. PLoS One. (2014) 9:e113500. doi: 10.1371/journal.pone.0113500
PubMed Abstract | CrossRef Full Text | Google Scholar
12. Zhang, Y, Xiang, Q, Yu, C, Bao, J, Ho, HC, Sun, S, et al. Mortality risk and burden associated with temperature variability in China, United Kingdom and United States: comparative analysis of daily and hourly exposure metrics. Environ Res. (2019) 179:108771. doi: 10.1016/j.envres.2019.108771
PubMed Abstract | CrossRef Full Text | Google Scholar
13. Chen, J, Gao, Y, Jiang, Y, Li, H, Lv, M, Duan, W, et al. Low ambient temperature and temperature drop between neighbouring days and acute aortic dissection: a case-crossover study. Eur Heart J. (2022) 43:228–35. doi: 10.1093/eurheartj/ehab803
PubMed Abstract | CrossRef Full Text | Google Scholar
14. Zhan, Z, Zhao, Y, Pang, S, Zhong, X, Wu, C, and Ding, Z. Temperature change between neighboring days and mortality in United States: a nationwide study. Sci Total Environ. (2017) 584-585:1152–61:1152-61. doi: 10.1016/j.scitotenv.2017.01.177
CrossRef Full Text | Google Scholar
15. Burkart, KG, Brauer, M, Aravkin, AY, Godwin, WW, Hay, SI, He, J, et al. Estimating the cause-specific relative risks of non-optimal temperature on daily mortality: a two-part modelling approach applied to the global burden of disease study. Lancet. (2021) 398:685–97. doi: 10.1016/S0140-6736(21)01700-1
PubMed Abstract | CrossRef Full Text | Google Scholar
16. Yu, X, Xia, L, Xiao, J, Zheng, J, Xu, N, Feng, X, et al. Association of Daily Mean Temperature and Temperature Variability with Onset Risks of acute aortic dissection. J Am Heart Assoc. (2021) 10:e020190. doi: 10.1161/JAHA.120.020190
PubMed Abstract | CrossRef Full Text | Google Scholar
17. Shi, Q, Wei, X, Liu, Y, Meng, X, Zhu, W, Wang, M, et al. An effect of 24-hour temperature change on outpatient and emergency and inpatient visits for cardiovascular diseases in Northwest China. Environ Sci Pollut Res Int. (2021) 28:45793–804. doi: 10.1007/s11356-021-13961-z
PubMed Abstract | CrossRef Full Text | Google Scholar
18. Cao, J, Cheng, Y, Zhao, N, Song, W, Jiang, C, Chen, R, et al. Diurnal temperature range is a risk factor for coronary heart disease death. J Epidemiol. (2009) 19:328–32. doi: 10.2188/jea.JE20080074
PubMed Abstract | CrossRef Full Text | Google Scholar
19. Onozuka, D, and Hagihara, A. Associations of day-to-day temperature change and diurnal temperature range with out-of-hospital cardiac arrest. Eur J Prev Cardiol. (2017) 24:204–12. doi: 10.1177/2047487316674818
PubMed Abstract | CrossRef Full Text | Google Scholar
20. Garcia-Lledo, A, Rodriguez-Martin, S, Tobias, A, Garcia-de-Santiago, E, Ordobas-Gavin, M, Ansede-Cascudo, JC, et al. Relationship between influenza, temperature, and type 1 myocardial infarction: an ecological time-series study. J Am Heart Assoc. (2021) 10:e019608. doi: 10.1161/JAHA.120.019608
PubMed Abstract | CrossRef Full Text | Google Scholar
21. Guo, Y, Barnett, AG, Yu, W, Pan, X, Ye, X, Huang, C, et al. A large change in temperature between Neighbouring days increases the risk of mortality. PLoS One. (2011) 6:e16511. doi: 10.1371/journal.pone.0016511
PubMed Abstract | CrossRef Full Text | Google Scholar
22. Lim, YH, Hong, YC, and Kim, H. Effects of diurnal temperature range on cardiovascular and respiratory hospital admissions in Korea. Sci Total Environ. (2012) 417-418:55–60:55-60. doi: 10.1016/j.scitotenv.2011.12.048
CrossRef Full Text | Google Scholar
23. Zhao, Q, Li, S, Coelho, M, Saldiva, PHN, Hu, K, Huxley, RR, et al. Temperature variability and hospitalization for ischaemic heart disease in Brazil: a nationwide case-crossover study during 2000-2015. Sci Total Environ. (2019) 664:707–12. doi: 10.1016/j.scitotenv.2019.02.066
PubMed Abstract | CrossRef Full Text | Google Scholar
24. Pearce, JL, Hyer, M, Hyndman, RJ, Loughnan, M, Dennekamp, M, and Nicholls, N. Exploring the influence of short-term temperature patterns on temperature-related mortality: a case-study of Melbourne, Australia. Environmental health: a global access science source. (2016) 15:107. doi: 10.1186/s12940-016-0193-1
PubMed Abstract | CrossRef Full Text | Google Scholar
25. Zheng, S, Wang, M, Li, B, Wang, S, He, S, Yin, L, et al. Gender, age and season as modifiers of the effects of diurnal temperature range on emergency room admissions for cause-specific cardiovascular disease among the elderly in Beijing. Int J Environ Res Public Health. (2016) 13:447. doi: 10.3390/ijerph13050447
PubMed Abstract | CrossRef Full Text | Google Scholar
26. Chu, ML, Shih, CY, Hsieh, TC, Chen, HL, Lee, CW, and Hsieh, JC. Acute myocardial infarction hospitalizations between cold and hot seasons in an island across tropical and subtropical climate zones-a population-based study. Int J Environ Res Public Health. (2019) 16:2769. doi: 10.3390/ijerph16152769
PubMed Abstract | CrossRef Full Text | Google Scholar
27. Cheng, J, Su, H, Xu, Z, and Tong, S. Extreme temperature exposure and acute myocardial infarction: elevated risk within hours? Environ Res. (2021) 202:111691. doi: 10.1016/j.envres.2021.111691
PubMed Abstract | CrossRef Full Text | Google Scholar
28. Castellani, JW, and Young, AJ. Human physiological responses to cold exposure: acute responses and acclimatization to prolonged exposure. Auton Neurosci. (2016) 196:63–74. doi: 10.1016/j.autneu.2016.02.009
留言 (0)