
記住我

Tinnitus is a distressing condition characterized by a persistent perceived ringing or buzzing sound in the absence of any external sound source (Baguley et al., 2013). The prevalence of tinnitus has been reported to range from 6 to 22% (Axelsson and Ringdahl, 1989; Kim et al., 2015; Wu et al., 2015), and tends to increase with age (Oiticica and Bittar, 2015; Wu et al., 2015; McCormack et al., 2016), posing a significant social burden in an aging society. Unfortunately, there is currently no known cure for tinnitus, which is attributed to the great heterogeneity in the symptom characteristics of individuals (Cederroth et al., 2019).
Tinnitus is generally considered to be not only a consequence of cochlear damage, but also a symptom involving the plasticity of the central nervous system (Lanting et al., 2009; van Der Loo et al., 2009; Chen et al., 2016). The underlying mechanisms of tinnitus can be divided into three broad categories: (a) peripheral auditory afferentation and central maladaptive plasticity changes, (b) hyperactivity of spontaneous auditory neurons, and (c) increased cross-fiber synchronization between neurons (Eggermont and Roberts, 2012; Baguley et al., 2013). Neuroimaging, electrophysiology and invasive and non-invasive neuromodulation techniques are widely used in the study of chronic tinnitus (Claes et al., 2014; De Ridder and Vanneste, 2014; De Ridder et al., 2015a; Mohan et al., 2016, 2017; Hullfish et al., 2018a,b; Hullfish et al., 2019).
Pathological oscillatory activity in the brain has found considerable support in the theory of tinnitus etiology. In fact, differences in oscillatory activity within different frequency bands may indicate functional lesions, since focal low-frequency activity is often associated with abnormal brain function (Papanicolaou, 2009). Therefore, extensive research has been devoted to identifying neural correlates of conscious tinnitus perception by comparing spontaneous resting state brain activity oscillations in individuals with and without tinnitus, using non-invasive recording methods obtained in non-invasive silence, such as magnetoencephalography (MEG) or electroencephalography (EEG). In response to the theory of abnormal oscillatory behavior in tinnitus and its supporting evidence, many proposed treatments aim to directly or indirectly alter oscillatory activity with the aim of alleviating symptoms, such as transcranial magnetic stimulation (Londero et al., 2018; Dong et al., 2020; Pink et al., 2021), transcranial direct current stimulation (Santos et al., 2018; Wang et al., 2018; Labree et al., 2021), neurofeedback (Güntensperger et al., 2017; Kleinjung et al., 2018; Czornik et al., 2022), alternating current stimulation, transcranial random noise stimulation, transcutaneous vagus nerve stimulation, and bimodal stimulation (Langguth, 2020; Yakunina and Nam, 2021; Herrera-Murillo et al., 2022).
In 1971, Feldmann found that the presence of noise caused tinnitus symptoms to be suppressed after noise cancelation for about 1 min (Feldmann, 1971; Roberts et al., 2006; Roberts, 2007), a phenomenon known as “residual inhibition” (RI; Vernon, 1977; Henry and Meikle, 2000). RI can be observed with various types of sounds, including pure tones (Feldmann, 1971; Roberts et al., 2008; Reavis et al., 2012; Tyler et al., 2014; Neff et al., 2017, 2019), narrow-band noise (Roberts et al., 2008), amplitude-modulated sound (Reavis et al., 2012; Tyler et al., 2014; Neff et al., 2017, 2019; Schoisswohl et al., 2020), frequency-modulated sound (Reavis et al., 2012; Neff et al., 2017), white noise (WN) (Henry et al., 2004; Sedley et al., 2012, 2015), or broadband noise (Feldmann, 1971, 1983; Tyler et al., 1984; Kaltenbach, 2006; Roberts et al., 2006, 2008; Kahlbrock and Weisz, 2008; Fournier et al., 2018). RI is one of the few interventions that can temporarily inhibit tinnitus. Its potential as a valuable measure is evident in the clinic, especially as a diagnostic marker of subtypes and a prognostic indicator of an individual’s response to therapeutic acoustic stimuli. Consequently, RI proves to be an invaluable asset in investigating the intricate mechanisms underlying tinnitus and is expected to be a suitable technique to detect the resting-state neural networks underlying tinnitus perception (Sedley et al., 2015; Hu et al., 2019).
Sound therapy is a non-invasive method recommended for the treatment of tinnitus, as stated in the 2014 American Academy of Otolaryngology–Head and Neck Surgery Foundation (AO-HNSF) clinical practice guidelines (CPGs) (Tunkel et al., 2014). A novel and effective technique for non-invasive neuromodulation of the auditory cortex in patients with chronic tinnitus is tailor-made notched music training (TMNMT) (Pantev et al., 2012). In 2010, Okamoto et al. (2010) proposed TMNMT to modify pleasant music by filtering out an octave range of individual’s tinnitus frequency as the central frequency band, which strengthens lateral inhibition and inhibits the hyperactivity of auditory cortical neurons, thereby potentially eliminating or weakening tinnitus (Okamoto et al., 2010; Teismann et al., 2011, 2014; Pantev et al., 2014; Pape et al., 2014; Stein et al., 2015a,b, 2016).
Microstates refer to electric potential topographies recorded in a multichannel array across the scalp, that remain quasi-stable for 60–120 ms before rapidly transitioning to a different microstate (Michel and Koenig, 2018). In contrast to some other techniques, microstate analysis simultaneously considers signals from all electrodes to build a global representation of a functional state. The rich syntax of the microstate time series provides a range of novel quantifications of the EEG signal with potential neurophysiological relevance. Indeed, many studies have demonstrated that characteristics of the EEG microstate time series vary across behavioral states (Stevens and Kircher, 1998; Lehmann et al., 2010), personality types (Schlegel et al., 2012), consciousness (Bréchet and Michel, 2022), sleep (Peng et al., 2021), pain (May et al., 2021) and neuropsychiatric disorders, such as Alzheimer’s disease (Dierks et al., 1997; Hanoglu et al., 2022), Parkinson’s disease (Pal et al., 2021; Hanoglu et al., 2022), Huntington’s disease (Faber et al., 2021), schizophrenia (Lehmann et al., 2005; Kim et al., 2021), panic (Kikuchi et al., 2011), dementia (Lin et al., 2021). Multiple evidence suggest that the microstate time series may provide insights into the neural activity of the brain in the resting state (Britz et al., 2010; Musso et al., 2010; Yuan et al., 2012). Microstate analysis of EEG presents a potent, cost-effective, high-time resolution and clinically applicable neurophysiological approach to study and evaluate the global functional states of the brain in both health and disease.
To our knowledge, however, there is a lack of research examining the residual inhibition (RI) of tinnitus induced by tailor-made notched music training (TMNMT). Therefore, the objective of this study is to utilize scalp EEG recordings technology to investigate the phenomenon of RI in tinnitus by TMNMT, we aim to provide valuable experimental evidence and practical implications for the potential applications of TMNMT in tinnitus treatment.
2 Materials and methods 2.1 Participants and subgroupingThe study consisted of 44 participants recruited from the faculty and students of Tsinghua University, who had been experiencing tinnitus for a duration of more than 6 months. During the recruitment process, we have established specific requirements for potential subjects beyond tinnitus, including proficiency in language expression, as well as the ability to identify and comprehend frequency and loudness. Certain exclusion criteria were applied, included Meniere’s disease, chronic ear infections, otosclerosis, tumors, mental disorders, a history of drug/alcohol abuse, chronic headaches, and pulsating tinnitus. Eligible participants, with 22 in each group of TMNMT (nm) and Placebo (pb), were kept unaware of their group assignment as part of a single-blind study, using a prespecified label. A participant in TMNMT group who was unable to identify and comprehend the frequency and loudness of tinnitus was reassigned to Placebo group. Prior to conducting the study, the Medical Ethics Committee of Tsinghua University granted approval, and all participants provided their informed consent.
2.2 Audiological and behavioral assessmentsAll participants underwent a pure-tone hearing test, which obtained hearing thresholds of 125, 250, 500, 1,000, 2,000, 3,000, 4,000, 6,000 and 8,000 Hz according to the procedures prescribed by the British Academy of Audiology. The mean hearing threshold of all participants was below 70 dB HL. The mean hearing threshold was calculated as the average of the hearing thresholds at 500, 1000, 2,000 and 4,000 Hz (Dispenza et al., 2011; Bing et al., 2018). Furthermore, Tinnitus Handicap Inventory (THI), Tinnitus functional index (TFI), and Visual Analogue Scale (VAS, included Loudness and Annoyance) were employed to evaluate the distress and impact of tinnitus-related on participants’ daily lives.
2.3 Tinnitus pitch and loudness matching testsTinnitus pitch and loudness matching tests were conducted using a portable instrument named QingEr Tinnitus Treatment Instrument (QEHS-TI01, designed and manufactured by Wuxi QingEr HuaSheng Technology Co., LTD). A comprehensive set of 188 pure tone frequencies ranging from 125 Hz to 8.5 kHz, divided by 1/30 octave intervals, was utilized to match the pitch of the participants’ tinnitus (Gong et al., 2022). The participants were asked to compare the tones they heard with the pitch of individual tinnitus until they achieved a tone that exactly matched their tinnitus pitch. Following confirming the tinnitus pitch, an approximate tinnitus loudness level was given using the same instrument, which the level was adjusted in 1 dB sound pressure level (SPL) steps until participants reported that the loudness accurately matched their perception of tinnitus loudness (Kim et al., 2016). This process allowed for the fine-tuning of the loudness level to align with the subjective experience of each participant.
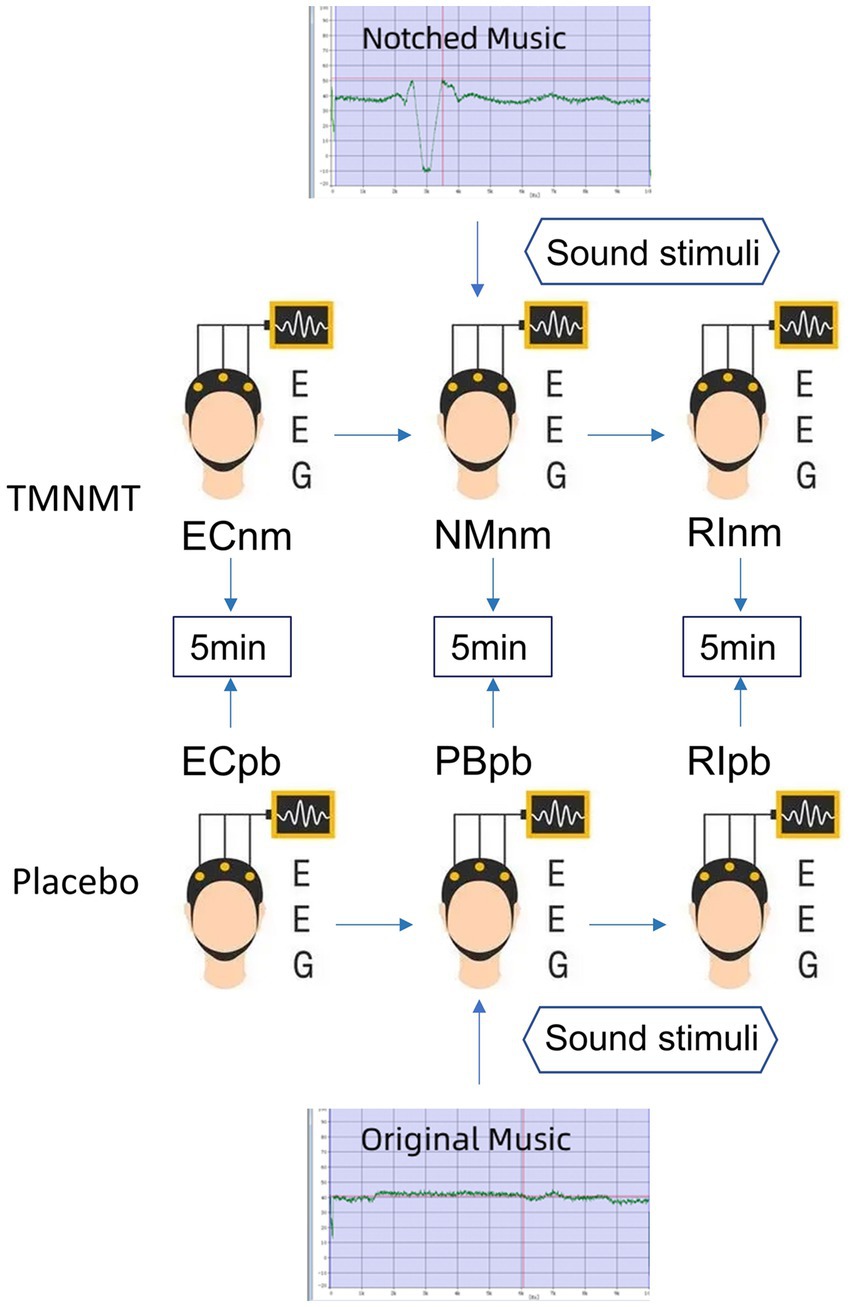
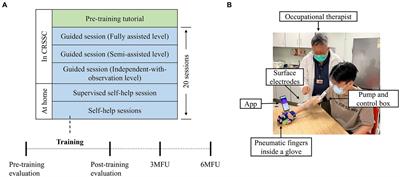
2.4 Experimental pipelineIn TMNMT group, the participants underwent a series of EEG recordings during different stages of the experiment. Initially, a 5-min resting-state EEG with eyes closed (ECnm subgroup) was recorded. Following this, there was a brief period of rest with eyes open. Subsequently, a 5-min segment of notched music with a loudness of 10 dB SPL above the threshold of tinnitus loudness was played by QEHS-TI01, which specifically filtered out the tinnitus central frequency and increased the lateral inhibition effect on the edge frequency bands of the notch area, associated with each participant’s individual tinnitus. To better target tinnitus participants with notched music, the music energy spectrum was equalized by digitally redistributing energy from lower to higher-frequency ranges, a process often referred to as “flattening” (Teismann et al., 2011), thereby enriching the energy spectrum in the higher-frequency range (Figure 1). The music was delivered to the both ears via a pair of insert earphones. The EEG data was simultaneously recorded with eyes closed at the same time (NMnm subgroup). Finally, another 5-min EEG recording was conducted with eyes closed, known as residual inhibition (RInm subgroup).
Figure 1. Experimental pipeline. ECnm, NMnm, RInm subgroups in TMNMT group and ECpb, PBpb, RIpb subgroups in Placebo group. ECnm, EEG recordings with eyes closed stimuli-pre by TMNMT music; NMnm, EEG recordings with eyes closed stimuli-ing by TMNMT music; RInm, EEG recordings with eyes closed stimuli-post by TMNMT music; ECpb, EEG recordings with eyes closed stimuli-pre by Placebo music; PBpb, EEG recordings with eyes closed stimuli-ing by Placebo music; RIpb, EEG recordings with eyes closed stimuli-post by Placebo music.
In contrast, Placebo group, as control group, underwent a similar procedure but with slight variations. The participants in Placebo group also underwent a 5-min resting-state EEG with eyes closed (ECpb subgroup). However, instead of the notched music intervention, a 5-min segment of original music with a loudness of 10 dB SPL above the threshold of tinnitus loudness without any specific processing was played by QEHS-TI01. The EEG data was recorded simultaneously with eyes closed during this period (PBpb subgroup). Similar to TMNMT group, a subsequent 5-min EEG recording for the residual inhibition (RIpb subgroup) was conducted with eyes closed. A schematic representation of these procedures can be seen in Figure 1.
TMNMT and Placebo music were derived from the nature environmental sounds (Strauss et al., 2017), such as rain, streams, wind and waves, etc., which were sounds comfortable and relaxed. The distinction between TMNMT music and Placebo music is subtle, and participants were unable to discern their respective groups based solely on the auditory stimuli they received.
2.5 EEG data collection and pre-processingThe electroencephalography (EEG) data were acquired using the Neuroscan system in a quiet room, with each participant seated in a comfortable chair in an upright position. To minimize potential interference from alcohol, coffee, cola, and tea on EEG recordings (Barry et al., 2011; Foxe et al., 2012; Vanneste and De Ridder, 2012b), participants were instructed to abstain from consuming these substances for 24 h prior to the study. Cleaned scalp with a scrub to ensure optimal signal quality before recording baseline EEG. The 64-channel Neuroscan synnamps2 Quick Cap placed in the international standard 10–20 system was utilized to collect EEG, and the EEG signals was sampled at a rate of 1,000 Hz using a Neuroscan synnamps2 amplifier to check that the impedance levels remained below 5 kΩ throughout the recording session. The midline reference point was located at the vertex (Cz), and the ground electrode was located at the AFZ.
The acquired EEG data were preprocessed using MATLAB and EEGLAB. The preprocessing steps consisted of the following procedures: Removal of irrelevant electrodes and resampling the data to 512 Hz. a Finite Impulse Response (FIR) filter performed for bandpass filtering in the frequency range of 0.5 to 100 Hz, with additional notch filtering at 50 Hz and 100 Hz, re-selected average reference and divided the data into 2 s epochs, identified and rejected the bad epochs via visual inspection, including instances of swallowing, gnashing, chewing and excessive muscle artifacts. Subsequently, performed a spherical interpolation algorithm to interpolate the removed channels, to ensure that have an equal number of channels for all participants. Data from the remaining electrodes were performed using the infomax algorithms for independent component analysis (ICA) (Jung et al., 1998) to remove eye blinks, saccades, muscle artifacts, electrocardiogram (ECG) signals, head movements, channel noise, and other transient noises. Artifact detection was detected on all epochs by a voltage threshold of ±100 μV, and any epochs not within this threshold were excluded.
These preprocessing steps helped ensure the data’s quality and remove unwanted artifacts, allowing for more accurate subsequent analysis and interpretation.
2.6 Spectral analysisSpectral analysis was performed by Welch’s method. The Welch’s method involves dividing the signal of N samples into K data segments of M samples, with an overlap of D samples. If D = M/2, the overlap is 50%; while D = 0, the overlap is 0%. The overlapping segments are then windowed (i.e., multiplied by a symmetric bell-shaped window). Subsequently, the Discrete Fourier Transform (DFT) is computed for each windowed data segment, resulting in the periodogram. The final spectral estimate is obtained by averaging the periodograms of all data segments. The Welch’s method can lead to a reduction in the variance of spectral estimate as 1/K. The power spectral density [PSD, 10 log10 (V2/Hz, dB)] for each channel based on the periodogram was calculated and averaged across channels to measure comparisons between groups in each frequency band.
Spectral estimation was applied on the EEG recordings in a specific time period to calculate the power of various certain rhythms: delta (0.5 ~ 4 Hz), theta (4 ~ 8 Hz), alpha1 (8 ~ 10 Hz), alpha2 (10 ~ 13 Hz), beta1 (13 ~ 18 Hz), beta2 (18 ~ 21 Hz), beta3 (21 ~ 30 Hz), gamma1 (30 ~ 45 Hz), gamma2 (55 ~ 100 Hz). By examining the power values within these frequency bands, comparisons between different groups could be made, shedding light on potential differences in neural activity.
2.7 Microstate analysisMicrostate analysis can be considered as a method to reveal the topographic steady period (80–120 ms) from EEG signals. In fact, applying spatial reduction using a clustering algorithm allows extraction of a certain number of fixed topologies (global templates), called microstates. By fitting such topographic maps to the EEG time processes, it is possible to obtain a discrete sequence of microstates (Prete et al., 2022). Microstate analysis aims at identifying major topographic configurations (global templates or microstates) that alternate over the course of EEG time to describe the ongoing brain dynamics (Khanna et al., 2015). By quantitative measures, characteristics characterizing the specific sequences of microstates can be calculated.
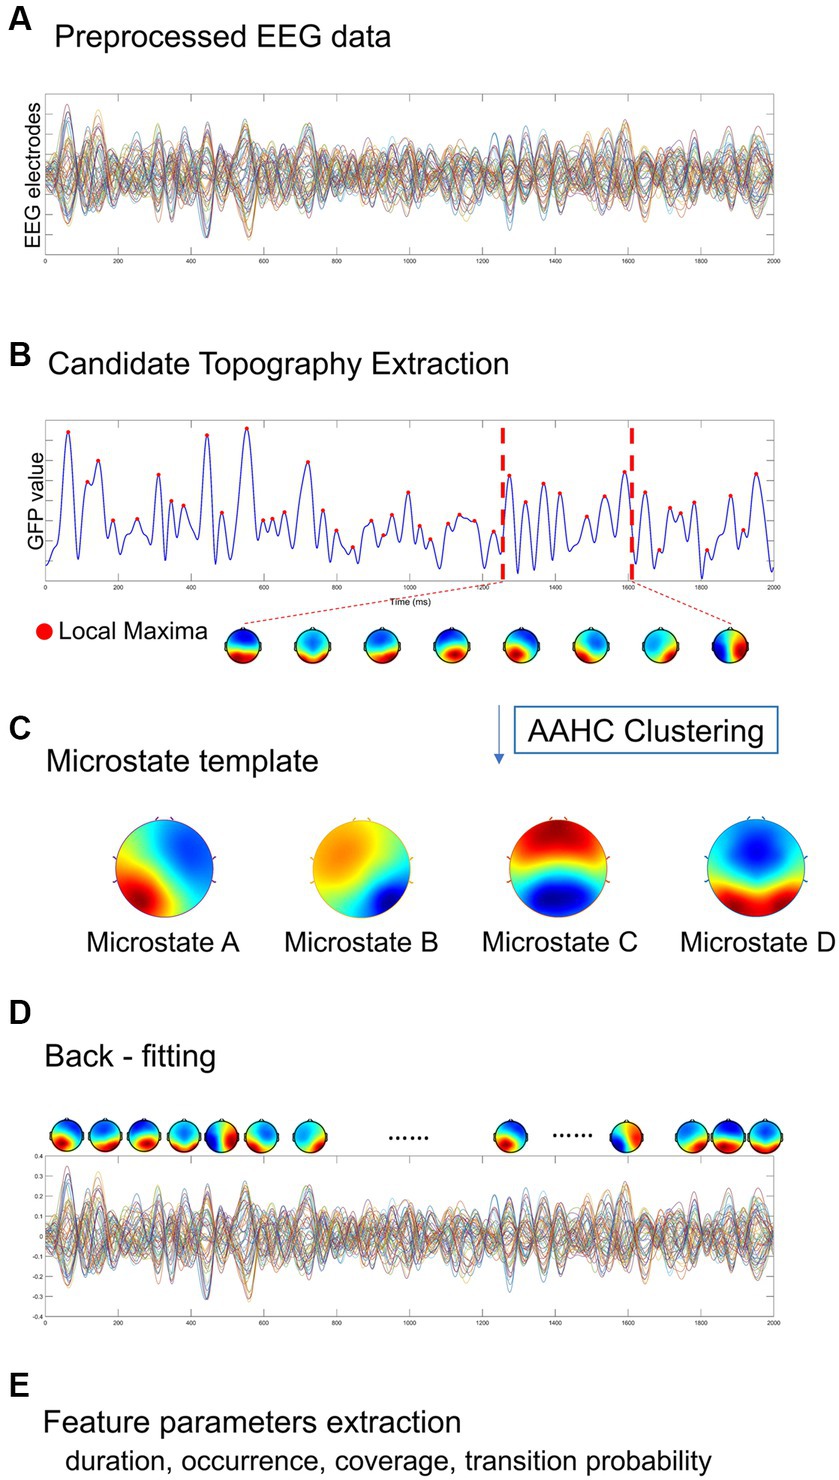
The Microstate analysis was conducted using EEGLAB plug-in for artifact-free EEG data analysis. The EEG data performed digital bandpass filtering in the range of 2 ~ 20 Hz (Koenig et al., 2002; Kindler et al., 2011; Nishida et al., 2013). A resting-state EEG microstate analysis is implemented as shown in Figure 2, including global field power extraction, microstate clustering, back-fitting (Pascual-Marqui et al., 1995). EEG microstate analysis begins with a bottom-up extraction of EEG microstate templets from the spontaneous EEG signals (Figures 2A,C). Then, a top-down process termed back-fitting (Figure 2D) is conducted to re-represent the EEG data into a series of dynamic microstate sequences. The global field power (GFP) of multi-channel EEG data represents global brain activity, which is a real-time, reference-independent measure of whole brain neuronal activity (Lehmann and Skrandies, 1980). The EEG topography is stable around the peak of GFP (Koenig et al., 2002). Therefore, EEG data were first simplified to the time point at the local maximum of global field power (GFP), representing the time point at the highest signal-to-noise ratio (Murray et al., 2008; Khanna et al., 2015; Michel and Koenig, 2018). The GFP reflects the potential variances across multiple electrodes at a specific point in time. The timepoints between two GFP peaks were obtained using nearest-neighbor interpolation. GFP can be calculated by the following formula:
Where N represents the number of electrodes in the EEG data (i = 1: 60), V represents the electrical potential measured over the scalp. Vi(t) represents the instantaneous electrical potential at electrode i and time t, and Vmean(t) represents the average electrical potential at all electrodes at time t. The global field power time series (GFP) is calculated as the spatial standard deviation of the EEG topography at each given time to quantify synchronous activity across all the electrodes at each timepoint (Figure 2B) (Skrandies, 1990). At the local GFP maximum (red dots), the spatial configuration of the EEG is considered stable and accounts for most of the variance of the time series (Wackermann et al., 1993), and switch to the next topographic map immediately after the GFP reaches a minimum peak (Lehmann et al., 1987). In microstate analysis, the topographies of GFP peaks are considered to be discrete microstates, whereas dynamic changes in EEG signals as variations of these states (Khanna et al., 2015). The atomize-agglomerate hierarchical cluster (AAHC), a modified k-means that provides a unique cluster for microstate analysis, was used to generate EEG topological clusters (Tibshirani and Walther, 2005; Murray et al., 2008; Britz et al., 2009). In the process of clustering, the algorithm ignores EEG polarity (Schlegel et al., 2012; Kuhn et al., 2015; Pipinis et al., 2017). Cluster analysis is conducted first at the individual template maps level and then at group level, and determine the optimal number of clustering based on cross validation (CV) criterion and Krzanowski-Lai (KL) criteria (Murray et al., 2008). Previous researches have suggested that EEG can typically be clustered into four distinct microstates, categorized as classes A, B, C, and D (Brodbeck et al., 2012; Khanna et al., 2015).
Figure 2. A standard procedure of EEG microstate analysis. Based on (A) the preprocessed EEG data, (B) candidate topographies with high signal-to-noise ratios were extracted from the local maxima of the GFP curve, (C) four templates were obtained after AAHC Clustering. (D) The final detected EEG microstate templates were then fitted back into the preprocessed EEG data by assigning each time point to a predominant microstate. After EEG microstates back-fitting, the original EEG time series were re-represented into EEG microstate sequences covering whole-brain spontaneous spatial–temporal activities. (E) A several of microstate feature metrics were calculated for quantitative measurement, including duration, occurrence, coverage, transition probability.
In this study, we categorized the microstates of each subject and each group. Firstly, the EEG maps of all participants were clustered into four grand subsets from all groups (TMNMT and Placebo). With the mean map of each subset computed, the four grand subsets were assigned to classes A, B, C, and D, respectively. Then, the EEG maps within each group were clustered into four group subsets. Each group subsets were assigned to the same class as the grand subset that exhibited the highest similarity. Finally, the EEG maps of each subject from TMNMT and Placebo groups were clustered and assigned to one of the four microstate classes. Spatial correlations were calculated between each map at group level and the topographies (maps) at the GFP peaks of the original EEG signals at individual level. Therefore, microstate maps were used to determine the back-fitting to the original map topography at each GFP peak according to maximum spatial correlation.
With the obtained microstates sequence, we conducted the computation and analysis of several metrics that hold potential neurophysiological significance (Figure 2E):
1) mean duration (ms) of a microstate class: defined as the average time covered by the same microstate class (Michel and Koenig, 2018).
2) occurrence rate (/s) per second of a microstate class: defined as the number of occurrences of a given microstates class per second across all analyzed epochs (Michel and Koenig, 2018).
3) time coverage (%) of a microstate class: defined as the percentage of the total analysis time in a given microstate class (Lehmann et al., 1987, 2005; Andreou et al., 2014; Khanna et al., 2015; Seitzman et al., 2017).
4) transition probability (%) between microstate classes: defined as the probability of transition from one given class to another one (Khanna et al., 2015; Michel and Koenig, 2018). The transition probability of a microstate means that the microstate is non-random and has the potential significance of sequence transition (Lehmann et al., 2005).
2.8 Statistical analysisContinuous variables were compared between the two groups using an independent sample t-test, and gender distribution was compared using Pearson’s χ2 test. To compare the power spectral density (PSD), repeated measures analysis of variance (RM-ANOVA) and two-tailed paired t test were performed separately for each group, with corrected effects for multiple comparisons of the false discovery rate (FDR). RM-ANOVA was also applied to analyze inter-group differences, with microstate classes (microstate A, B, C, and D) and microstate metrics (duration, occurrence, coverage, transition probabilities) as within-subject factors and group as between-subject factors. In case where significant group main effects or interactions were found in the RM-ANOVA, univariate ANOVA was then performed to investigate the simple effects. FDR correction was performed to adjust for multiple comparisons.
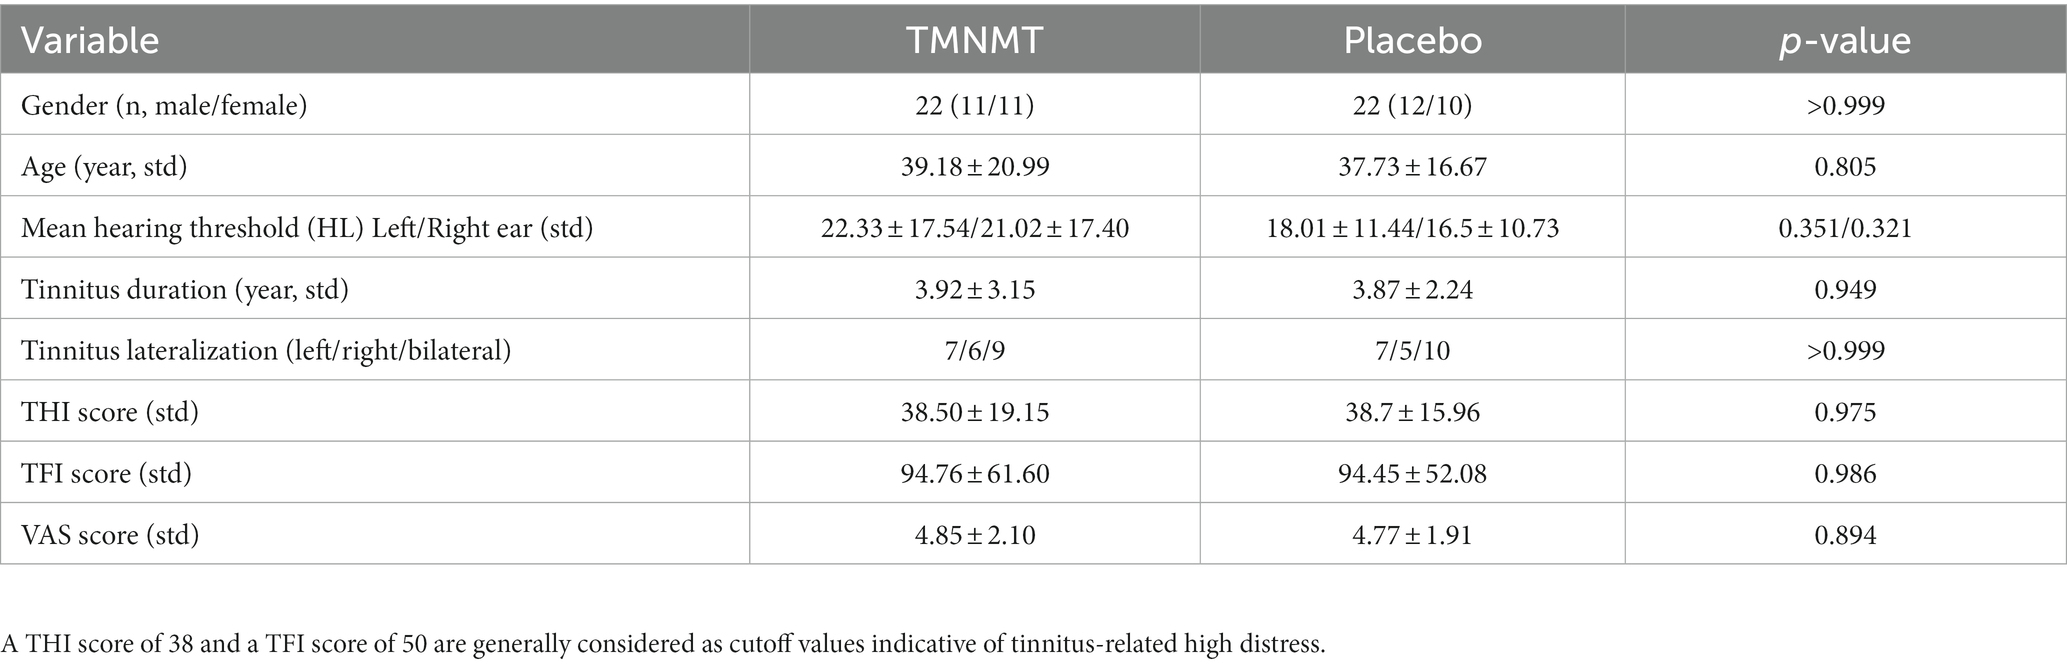
3 Results 3.1 Demographics and clinical characteristicsThere were no significant differences in terms of gender, age, mean hearing threshold, tinnitus duration, tinnitus lateralization, THI score, TFI score, and VAS score between TMNMT group and Placebo group. Demographics and clinical characteristics were given in Table 1.
Table 1. Demographics and clinical characteristic of two groups.
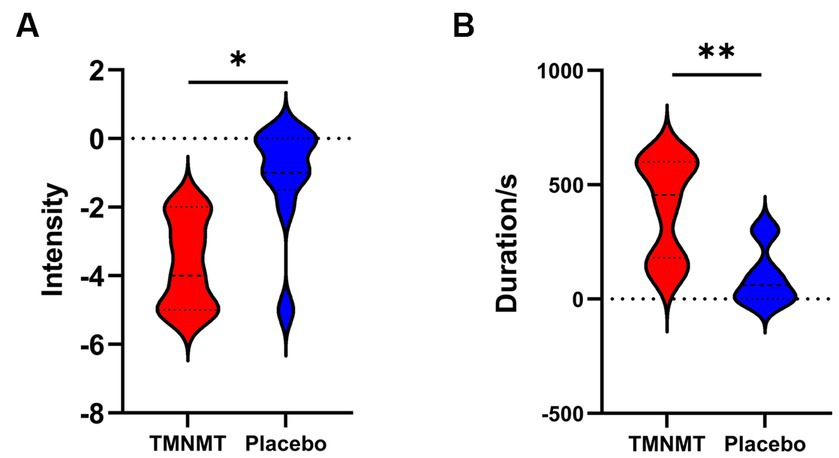
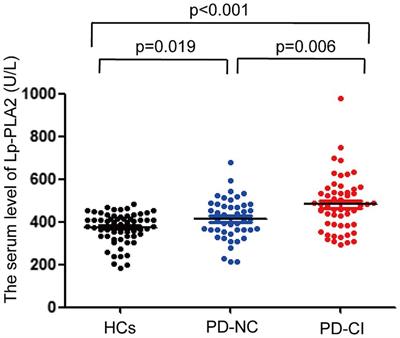
3.2 Behavioral testsA Likert scale was used to assess the effectiveness of TMNMT and Placebo interventions in tinnitus inhibition. The scale ranged from −5 to 5 (−5 indicates that tinnitus disappears after the sound stimuli; 0 indicates that no change in tinnitus loudness; and 5 indicates that tinnitus loudness doubled). We also recorded the duration of residual inhibition (RI), which spanned from the end of the sound stimuli until the tinnitus loudness returned to its initial level. The results showed TMNMT had a significantly stronger inhibition intensity (TMNMT: −3.6 ± 1.3; Placebo: −1.1 ± 1.6, p = 0.0257; Figure 3A) and longer inhibition time (TMNMT: 403 ± 215 s; Placebo: 96 ± 123 s, p = 0.0045; Figure 3B) compared to Placebo group by independent samples t test.
Figure 3. The intensity and duration of residual inhibition (RI) between TMNMT and Placebo groups. (A) TMNMT: −3.6 ± 1.3; Placebo: −1.1 ± 1.6, p = 0.0257; (B) TMNMT: 403 ± 215 s; Placebo: 96 ± 123 s, p = 0.0045; *p < 0.05, **p < 0.01.
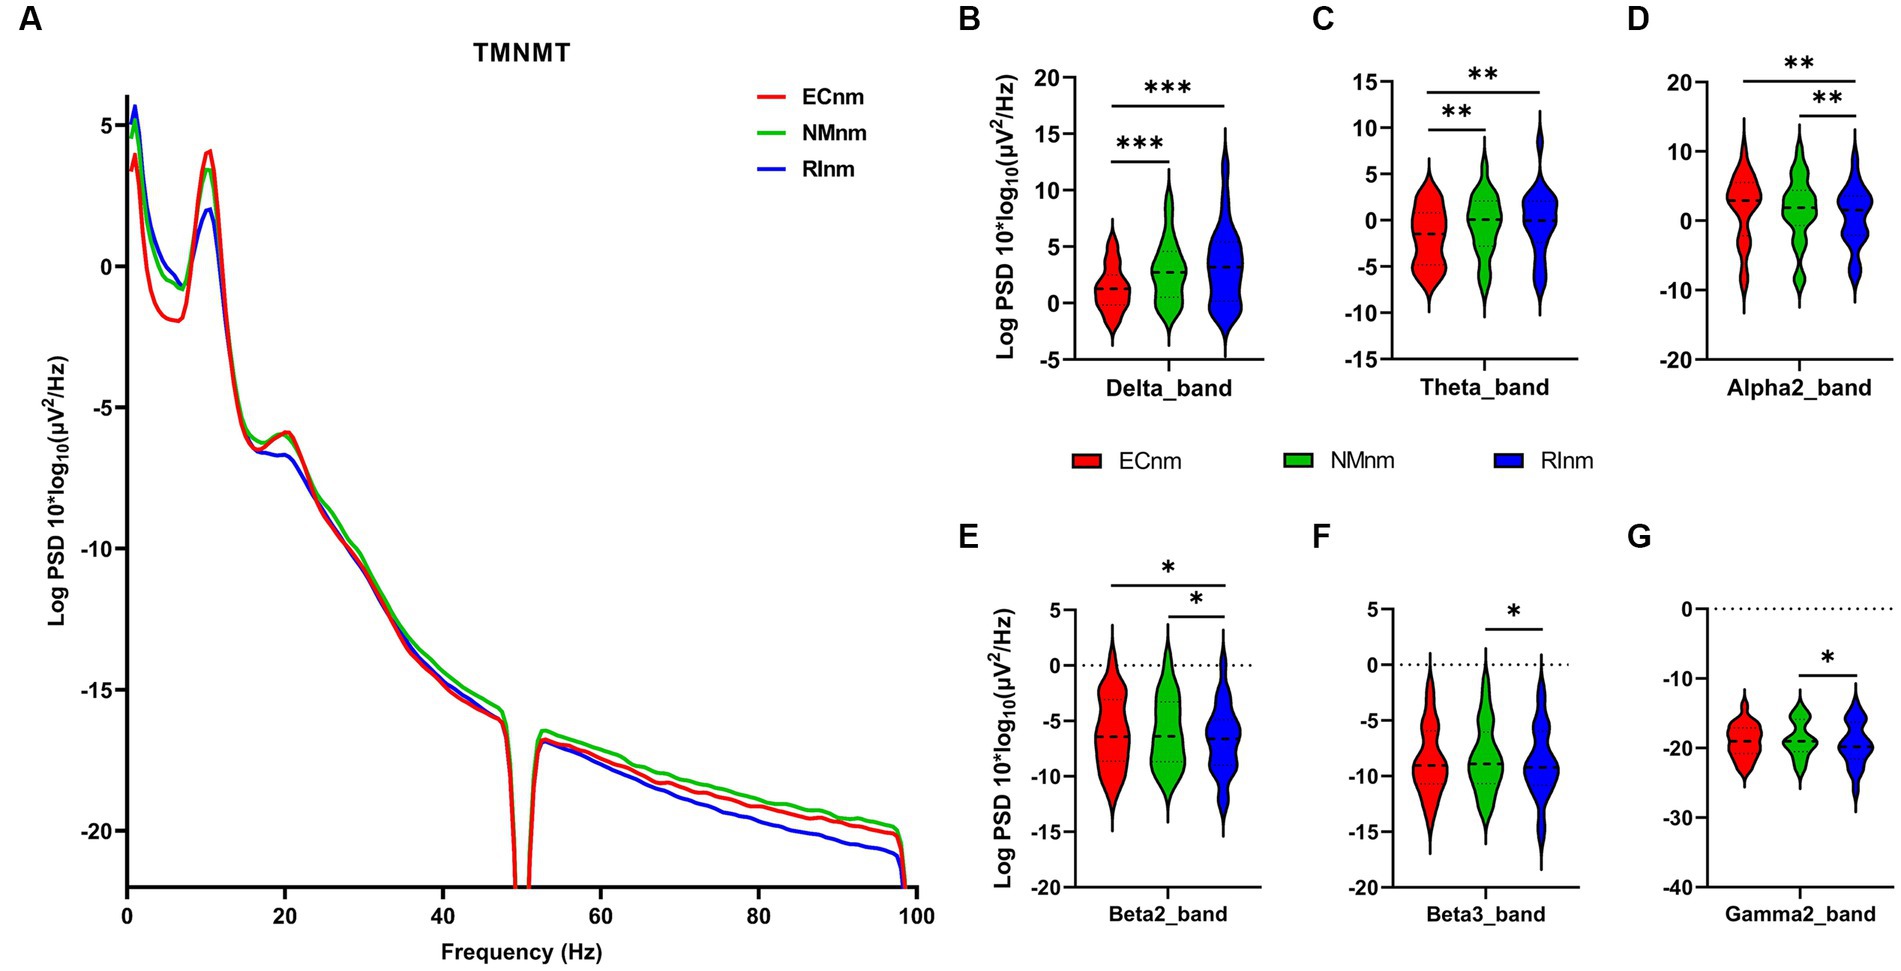
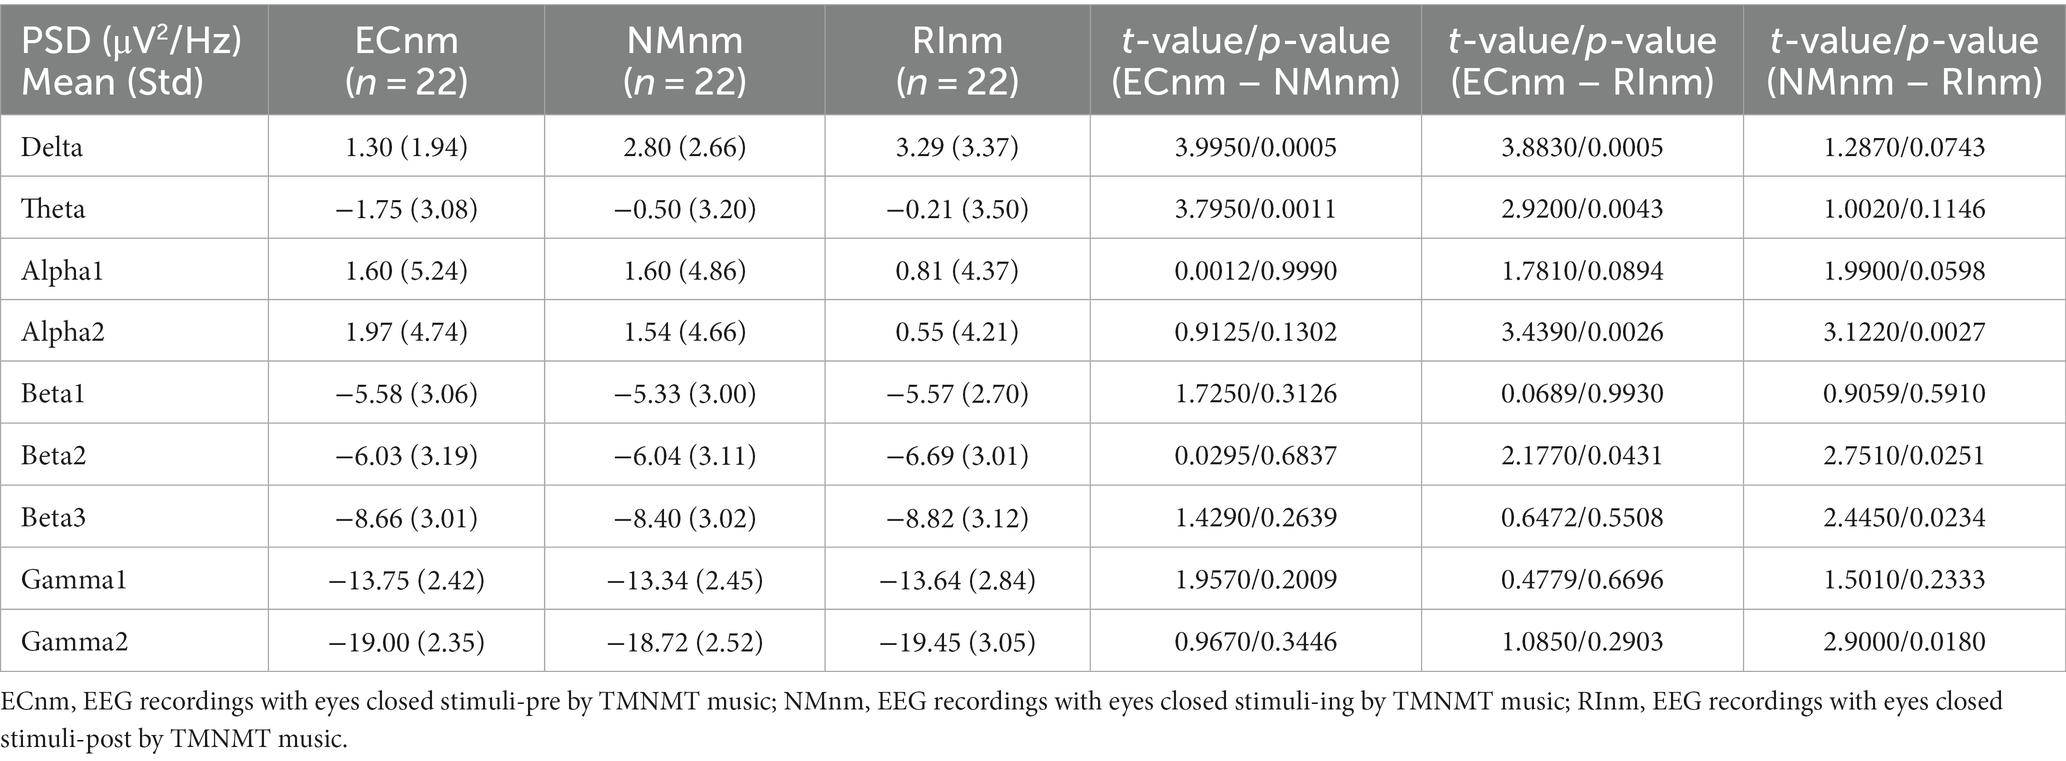
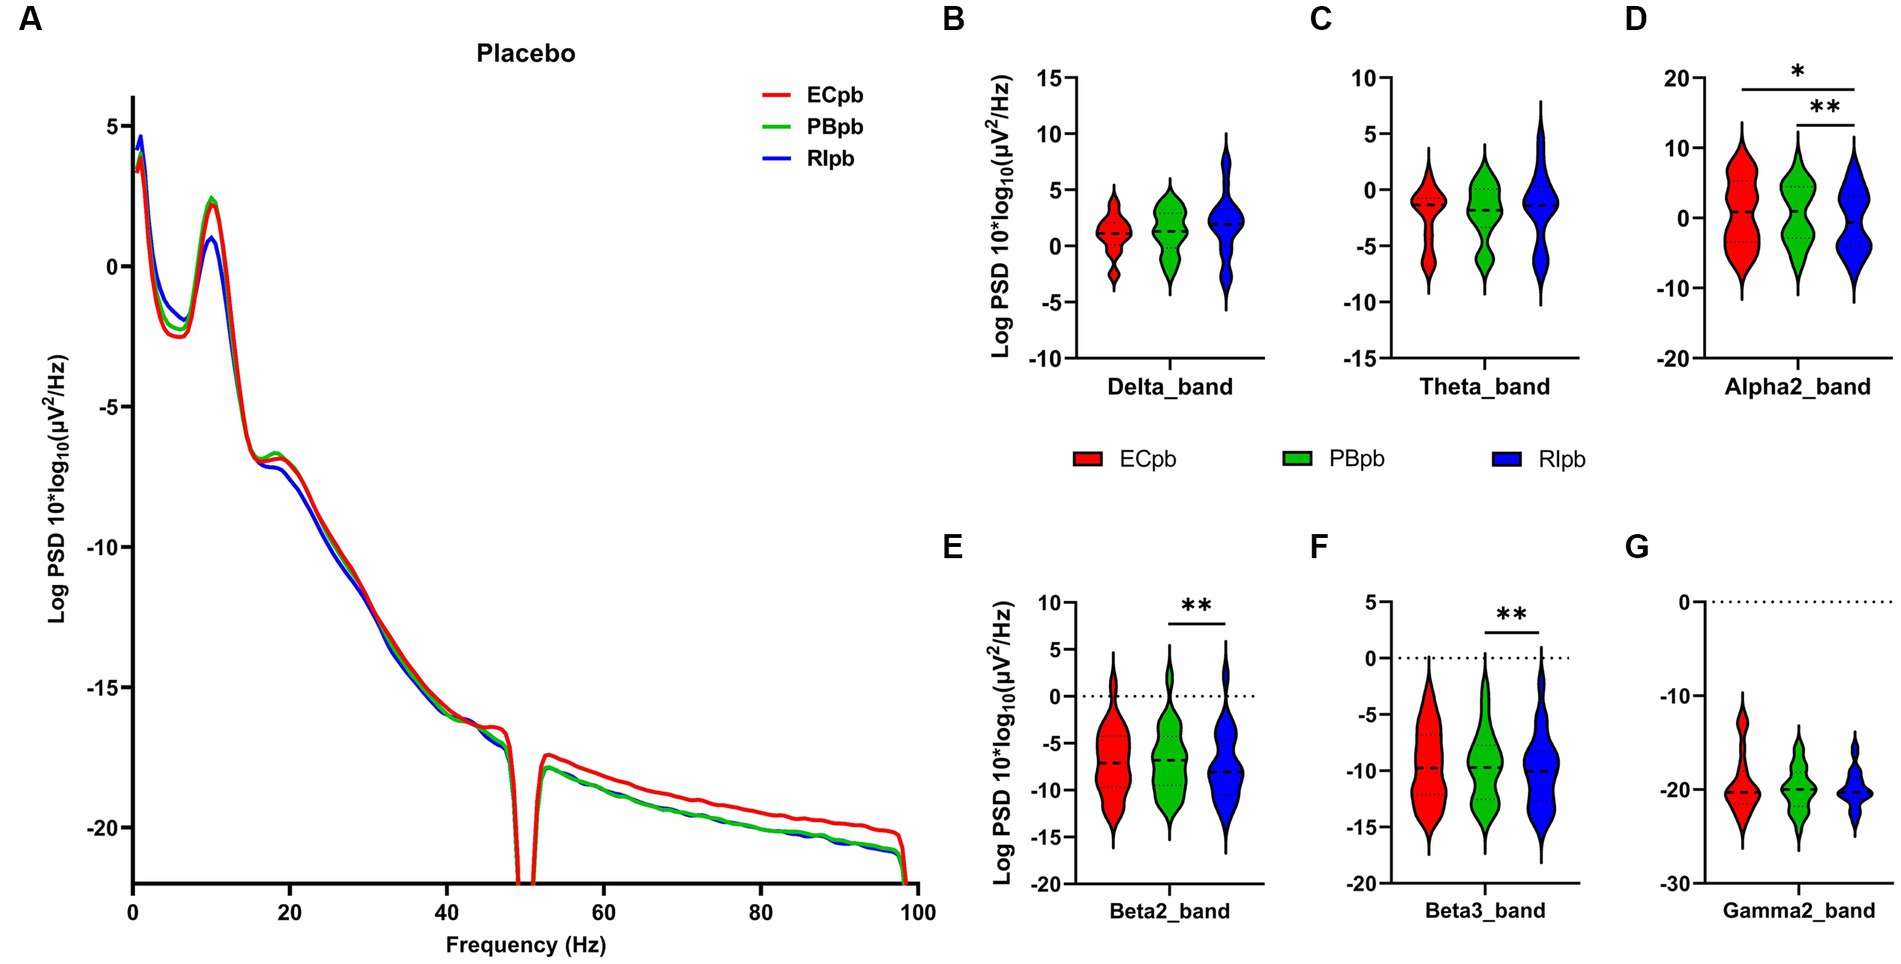
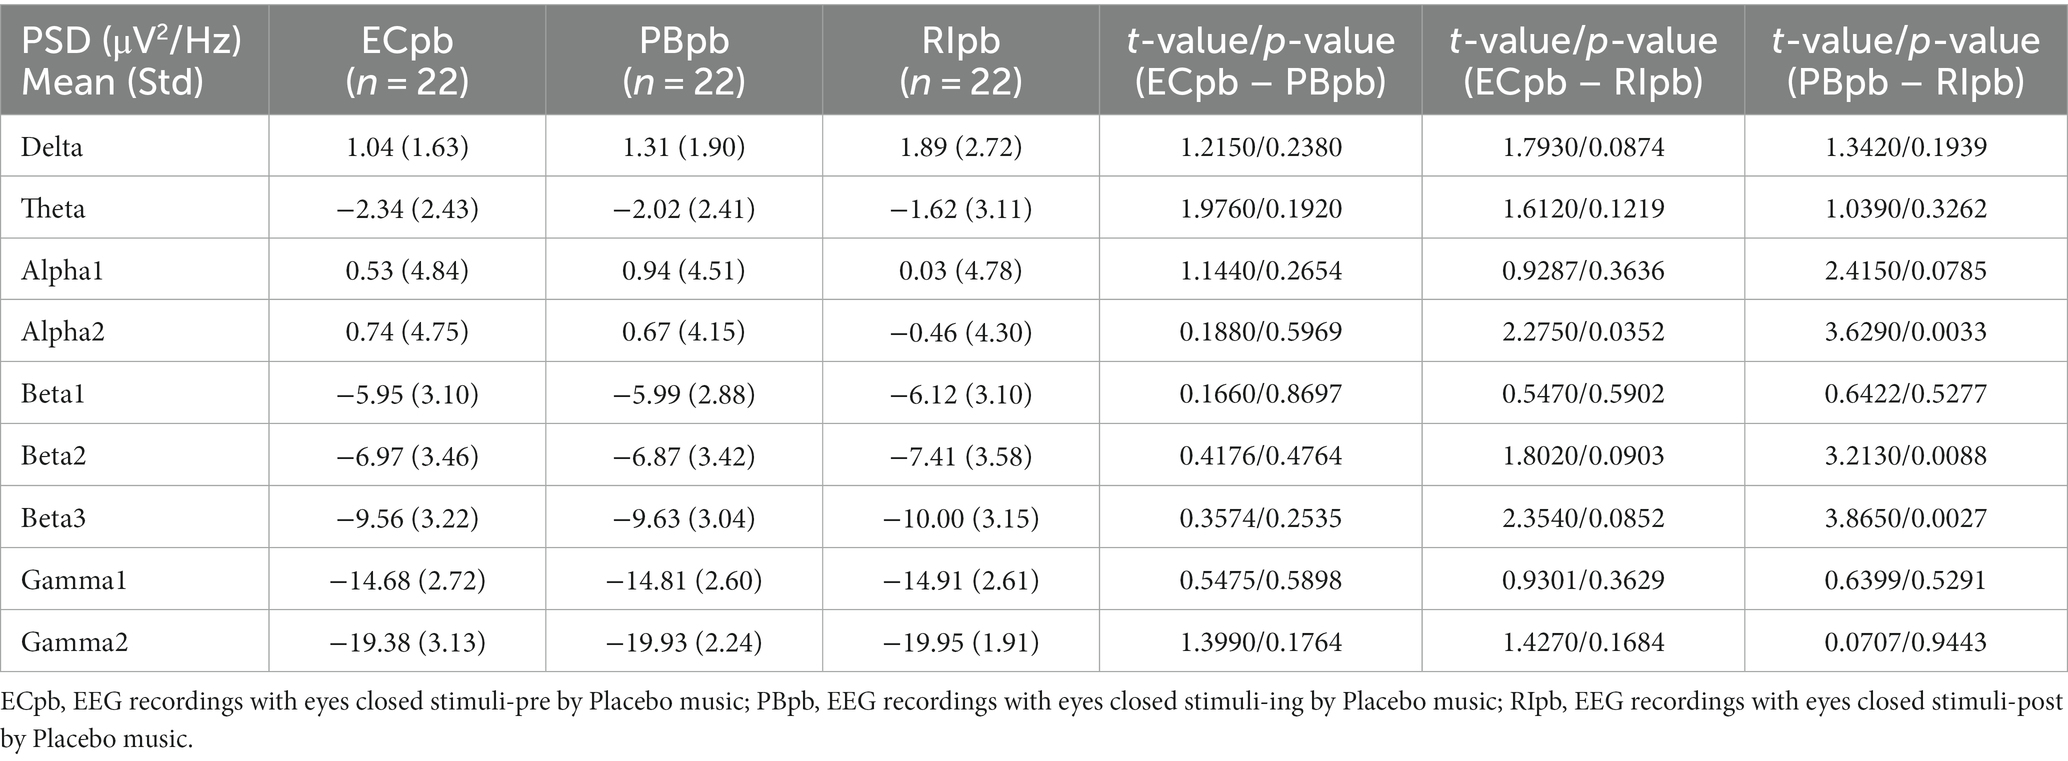
3.3 Whole-brain spectral analysisThe comparison of spectral analysis of the two groups of participants stimuli-pre, stimuli-ing and stimuli-post of different modulated music by repeated measures ANOVA showed different significant differences. The frequency band (delta, theta, alpha1, alpha2, beta1, beta2, beta3, gamma1, gamma2) was regarded as a within-subject factor and group (ECnm, NMnm, RInm, ECpb, PBpb, RIpb) as a between-subject factor. From an analysis of the waveforms, Figure 4A showed the power spectral density (PSD) of whole-brain full bands in TMNMT group, the results of PSD showed that the main effect of frequency band factor (F = 300.7; p < 0.0001) was significant, while the Frequency band ∗ Group interaction effect (F = 0.5583; p = 0.9146) and the main effect of group factor were not significant (F = 0.7915; p = 0.4537). Post-hoc comparisons showed the PSD of delta band (ECnm vs. NMnm, p = 0.0005; ECnm vs. RInm, p = 0.0005; Figure 4B) and theta band (ECnm vs. NMnm, p = 0.0011; ECnm vs. RInm, p = 0.0043; Figure 4C) were significantly increased; alpha2 band (ECnm vs. RInm, p = 0.0026; NMnm vs. RInm, p = 0.0027; Figure 4D), beta2 band (ECnm vs. RInm, p = 0.0431; NMnm vs. RInm, p = 0.0251; Figure 4E), beta3 band (NMnm vs. RInm, p = 0.0234; Figure 4F) and gamma2 band (NMnm vs. RInm, p = 0.0180; Figure 4G) were significantly decreased (Table 2 and Figure 4). Figure 5A showed the PSD of whole-brain full bands in Placebo group, the results of PSD showed that the main effect of frequency band factor (F = 315.2; p < 0.0001) was significant, while the Frequency band ∗ Group interaction effect (F = 0.2623; p = 0.9984) and the main effect of group factor were not significant (F = 0.3160; p = 0.7292). Post-hoc comparisons showed the PSD of alpha2 band (ECpb vs. RIpb, p = 0.0352; PBpb vs. RIpb, p = 0.0033; Figure 5D), beta2 band (PBpb vs. RIpb, p = 0.0088; Figure 5E) and beta3 band (PBpb vs. RIpb, p = 0.0027; Figure 5F) were significantly decreased in Placebo group (Table 3 and Figure 5).
Figure 4. Waveforms of spectral analysis in TMNMT group. (A) The power spectral density (PSD) waveform of full frequency bands in ECnm, NMnm, RInm subgroups of TMNMT group. (B–G) The PSD of delta (B), theta (C), alpha2 (D), beta2 (E), beta3 (F), gamma2 (G) bands in ECnm, NMnm, RInm subgroups of TMNMT group. ECnm, EEG recordings with eyes closed stimuli-pre by TMNMT music; NMnm, EEG recordings with eyes closed stimuli-ing by TMNMT music; RInm, EEG recordings with eyes closed stimuli-post by TMNMT music. *p < 0.05, **p < 0.01, ***p < 0.001.
Table 2. The power spectral density (PSD) of whole-brain full bands in TMNMT group (ECnm, NMnm, RInm).
Figure 5. Waveforms of spectral analysis in Placebo group. (A) The power spectral density (PSD) waveform of full frequency bands in ECpb, PBpb, RIpb subgroups of Placebo group. (B–G) The PSD of delta (B), theta (C), alpha2 (D), beta2 (E), beta3 (F), gamma2 (G) bands in ECpb, PBpb, RIpb subgroups of Placebo group. ECpb, EEG recordings with eyes closed stimuli-pre by Placebo music; PBpb, EEG recordings with eyes closed stimuli-ing by Placebo music; RIpb, EEG recordings with eyes closed stimuli-post by Placebo music. *p < 0.05, **p < 0.01.
Table 3. The power spectral density (PSD) of whole-brain full bands in Placebo group (ECpb, PBpb, RIpb).
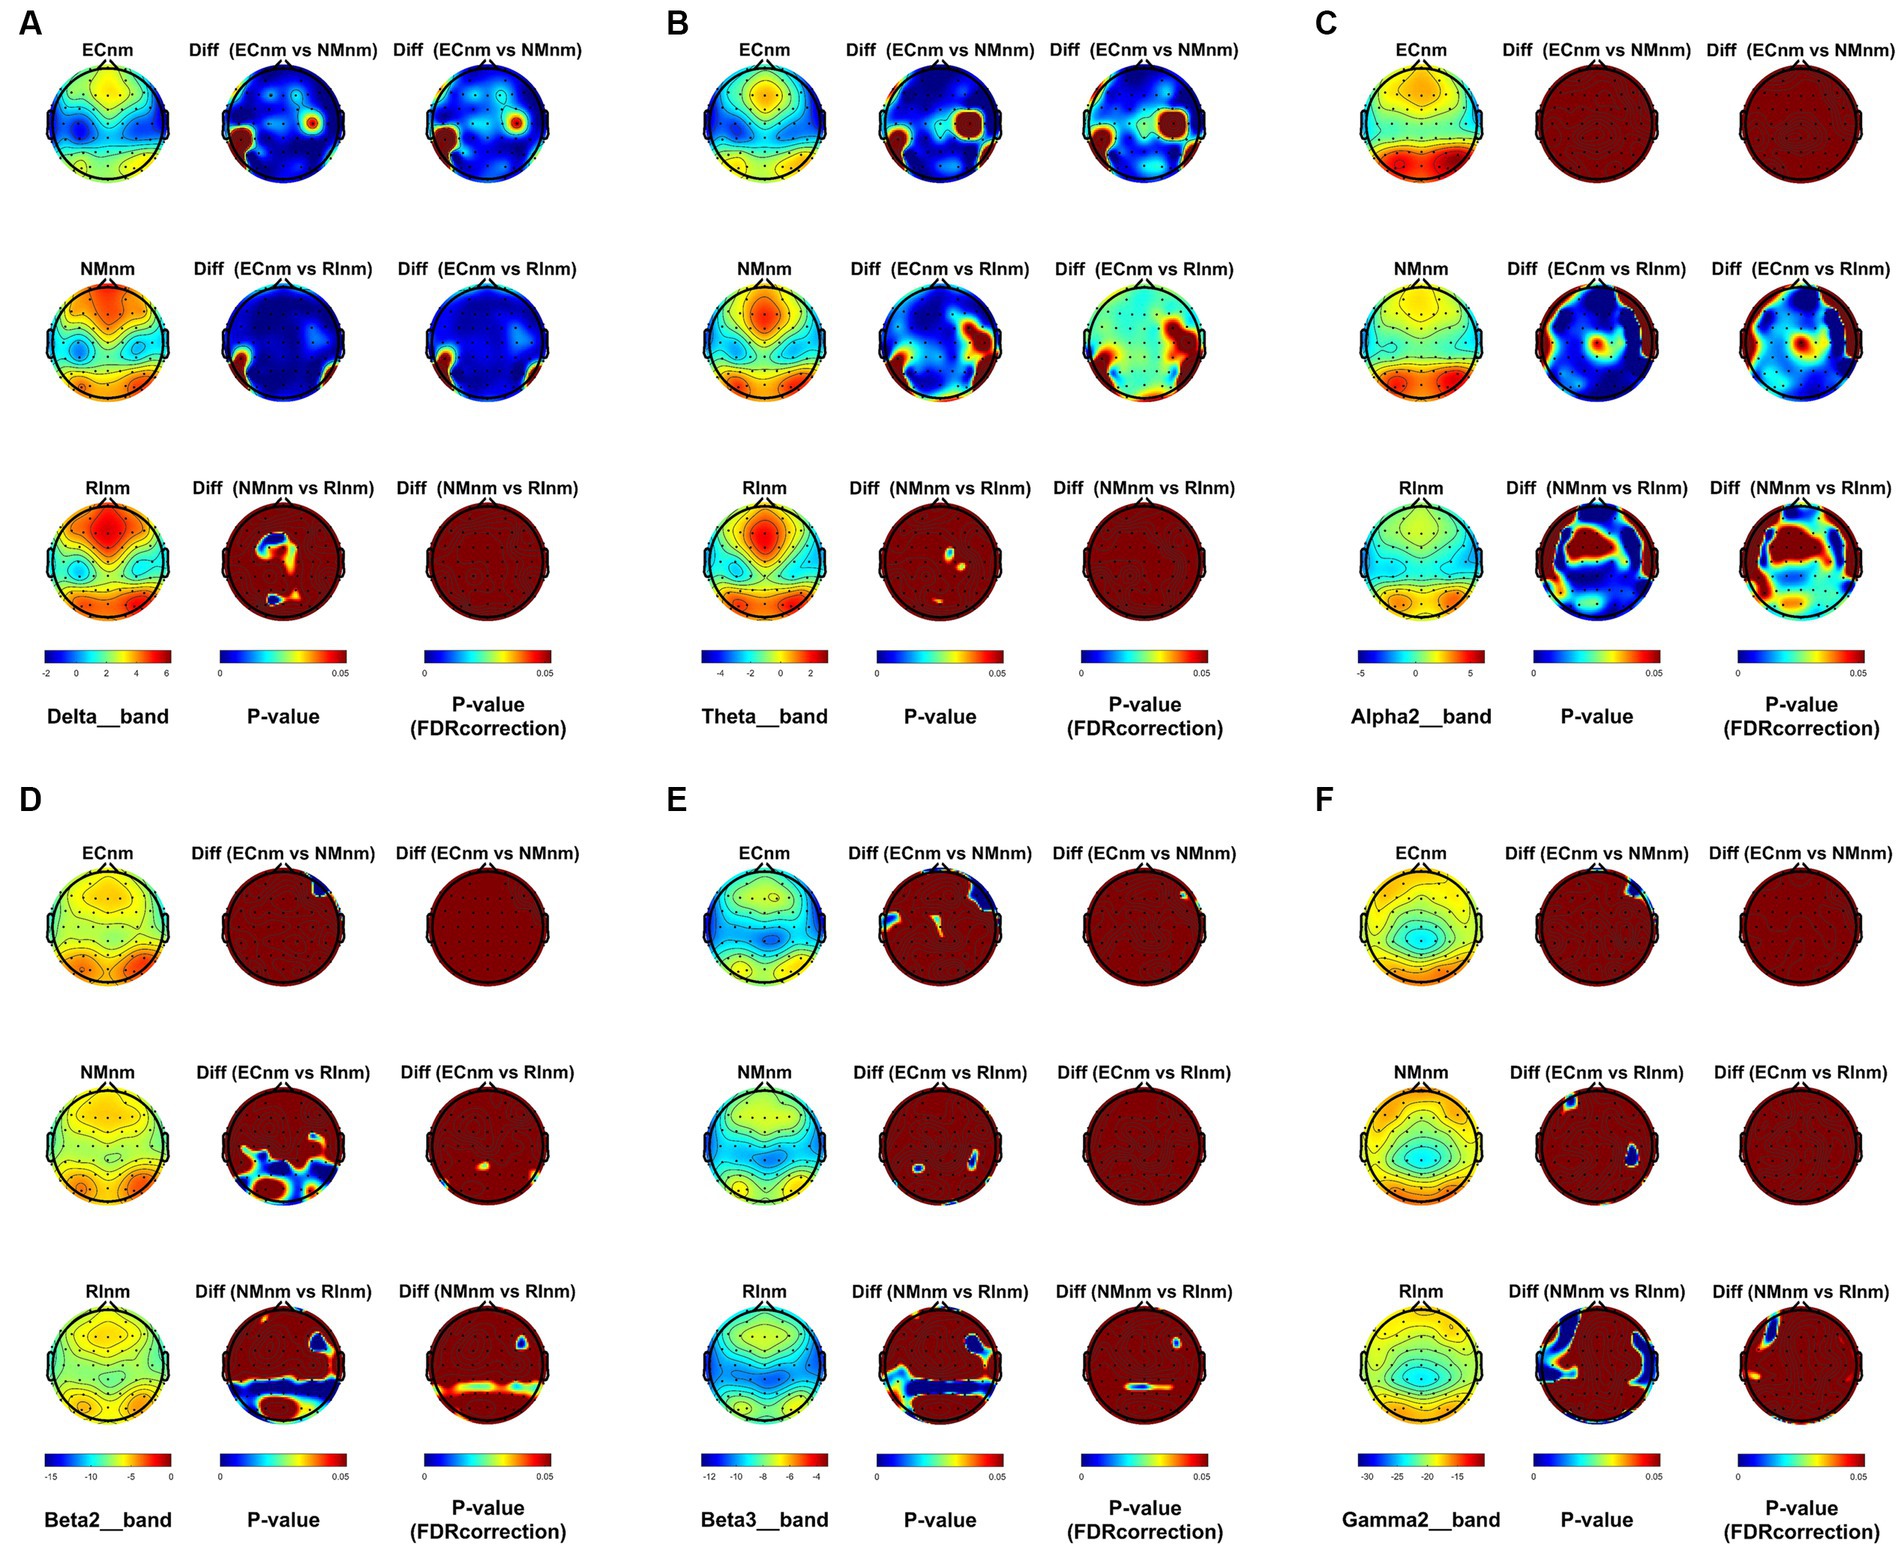
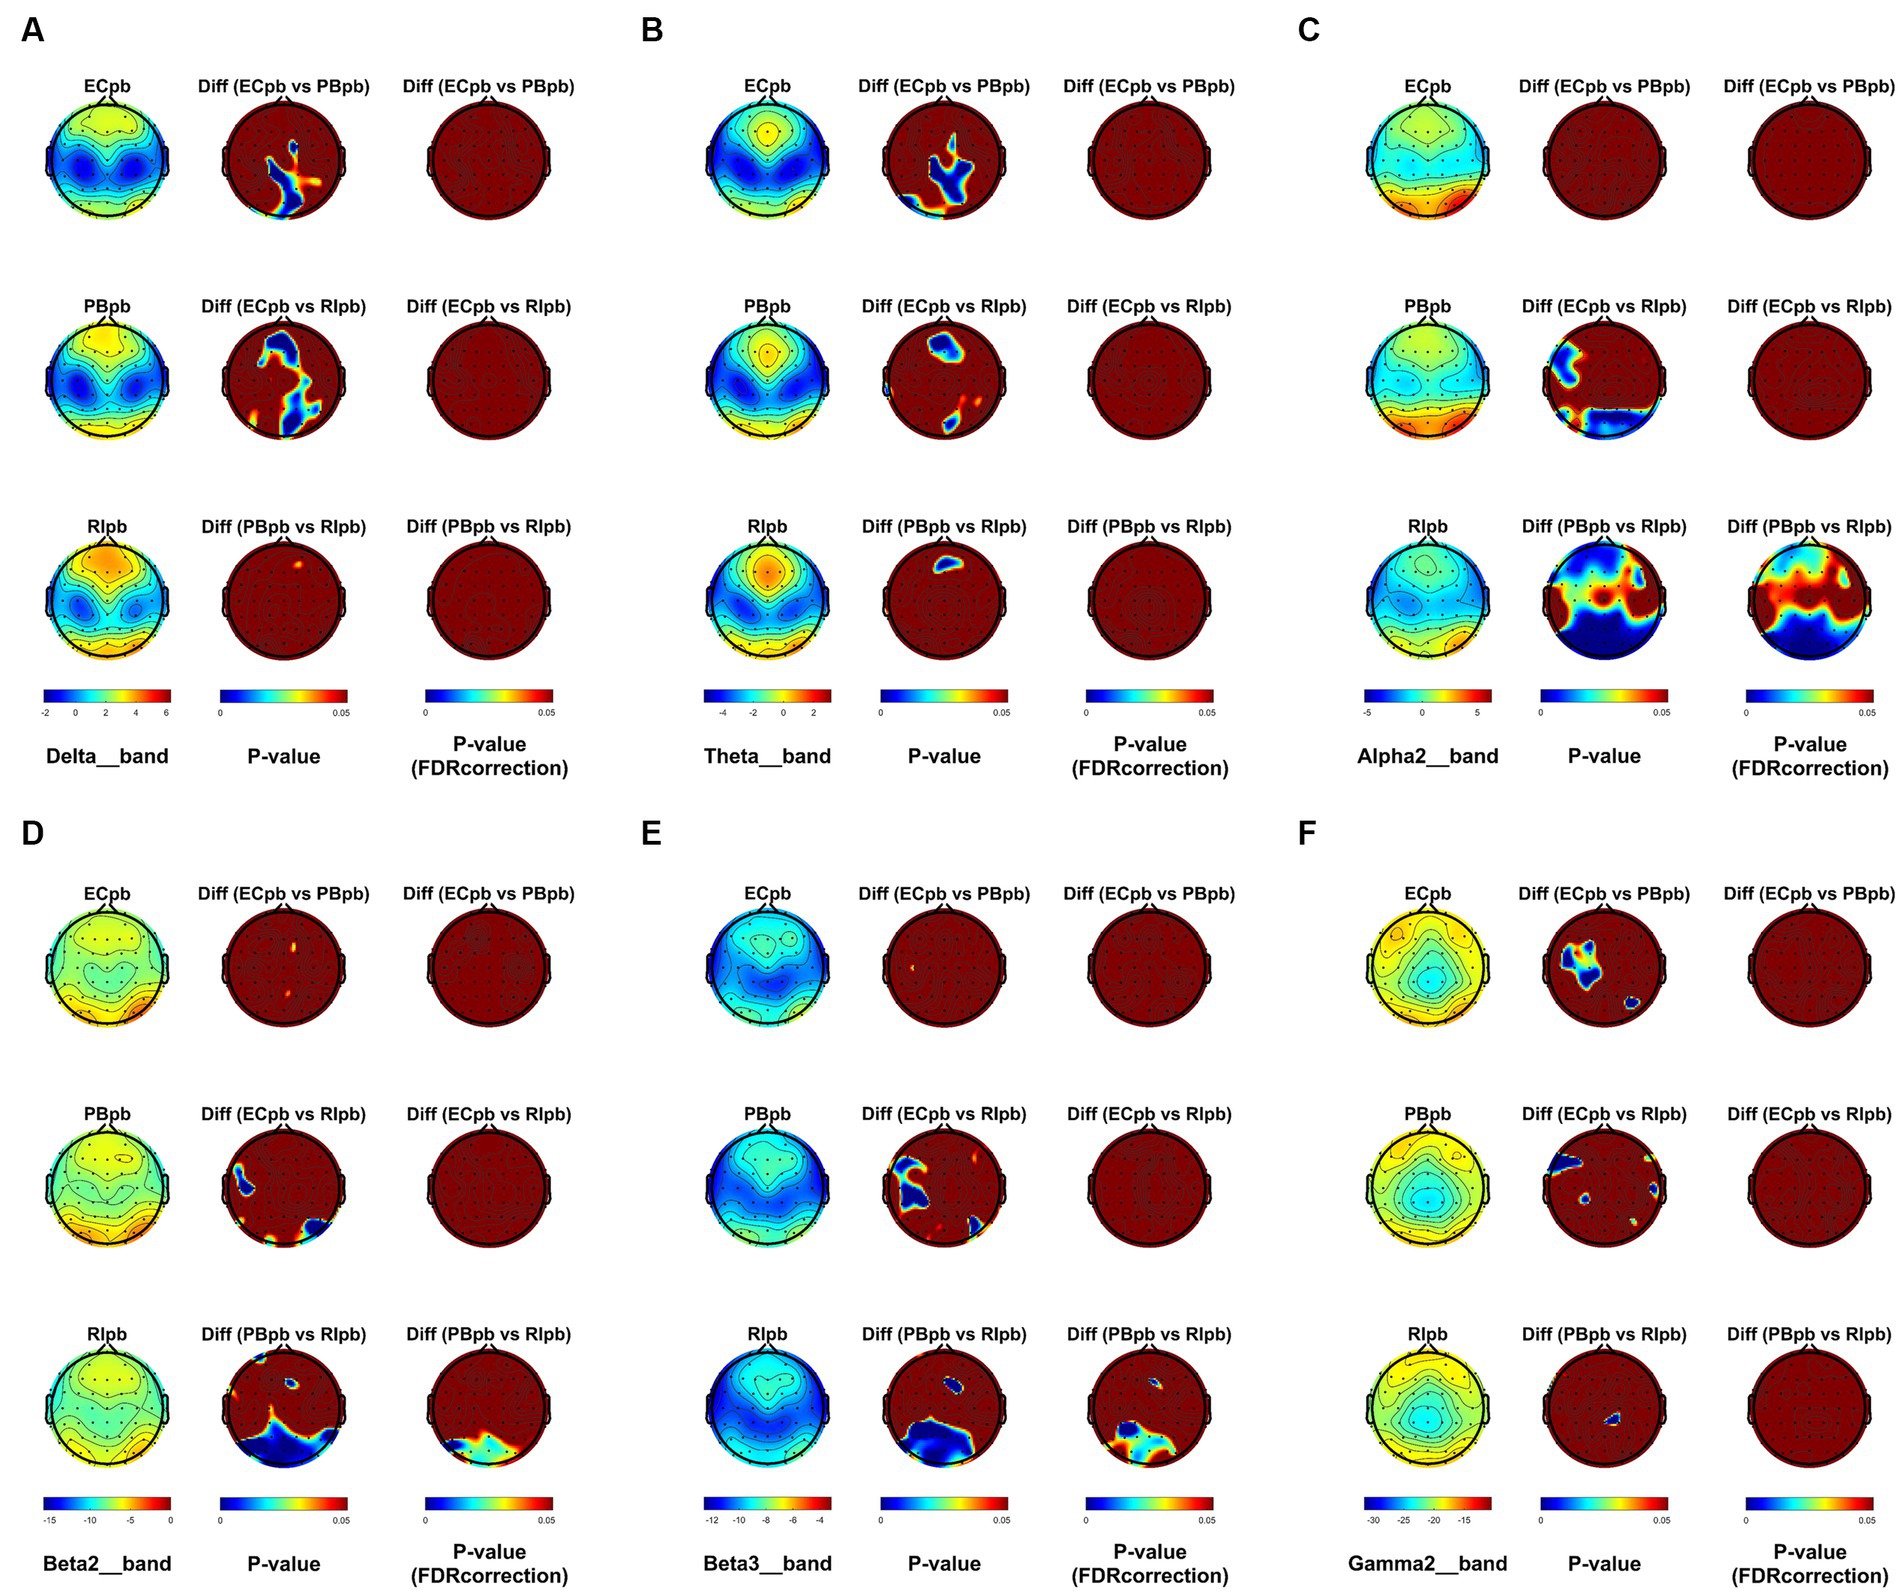
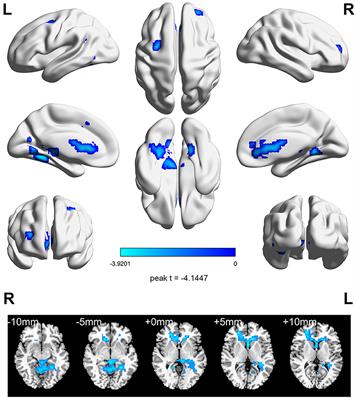
From the scalp topographies, through paired t-test analysis, the PSD of delta band and theta band of TMNMT group increased significantly, both ECnm vs. NMnm and ECnm vs. RInm had significant differences, and these effects survived correction for multiple comparisons of a false discovery rate (FDR) (Figures 6A,B); the PSD of alpha2 band, both ECnm vs. RInm and NMnm vs. RInm decreased significantly, and these effects remained after correction for multiple comparisons (Figure 6C); the PSD of beta2 band of ECnm vs. RInm decreased significantly, but this effect was nonexistent after correction for multiple comparisons of FDR and the PSD of beta2 band of NMnm vs. RInm decreased significantly, and this effect survived correction for multiple comparisons in part regions (Figure 6D); the PSD of beta3 band (NMnm vs. RInm) and gamma2 band (NMnm vs. RInm) decreased significantly, but these effects were nonexistent after correction for multiple comparisons of FDR (Figures 6E,F). In Placebo group, the PSD of delta band and theta band of ECpb vs. PBpb and ECpb vs. RIpb increased significantly in part regions, but these effects were nonexistent after correction for multiple comparisons of FDR (Figures 7A,B); the PSD of alpha2 band of ECpb vs. RIpb decreased significantly, but this effect was nonexistent after correction for multiple comparisons of FDR and the PSD of alpha2 band of PBpb vs. RIpb decreased significantly, and this effect was survival correction for multiple comparisons (Figure 7C); the PSD of beta2 band and beta3 band of PBpb vs. RIpb decreased significantly, and these effects survived correction for multiple comparisons in part regions (Figures 7D,E); the PSD of gamma2 band of ECpb vs. PBpb decreased significantly but this effect was nonexistent after correction for multiple comparisons of FDR (Figure 7F).
Figure 6. Scalp topographies of spectral analysis in TMNMT group. (A–F) Comparison of ECnm, NMnm, RInm of delta (A), theta (B), alpha2 (C), beta2 (D), beta3 (E), and gamma2 (F) bands. The first column showed the PSD across the whole brain within each subgroup, the second and third column showed the uncorrected p values and corrected p values for multiple comparisons of a false discovery rate (FDR) across the whole brain within each two subgroups, respectively. ECnm, EEG recordings with eyes closed stimuli-pre by TMNMT music; NMnm, EEG recordings with eyes closed stimuli-ing by TMNMT music; RInm, EEG recordings with eyes closed stimuli-post by TMNMT music.
Figure 7. Scalp topographies of spectral analysis in Placebo group. (A–F) Comparison of ECpb, PBpb, RIpb of delta (A), theta (B), alpha2 (C), beta2 (D), beta3 (E), and gamma2 (F) bands. The first column showed the PSD across the whole brain within each subgroup, the second and third column showed the uncorrected p values and corrected p values for multiple comparisons of a false discovery rate (FDR) across the whole brain within each two subgroups, respectively. ECpb, EEG recordings with eyes closed stimuli-pre by Placebo music; PBpb, EEG recordings with eyes closed stimuli-ing by Placebo music; RIpb, EEG recordings with eyes closed stimuli-post by Placebo music.
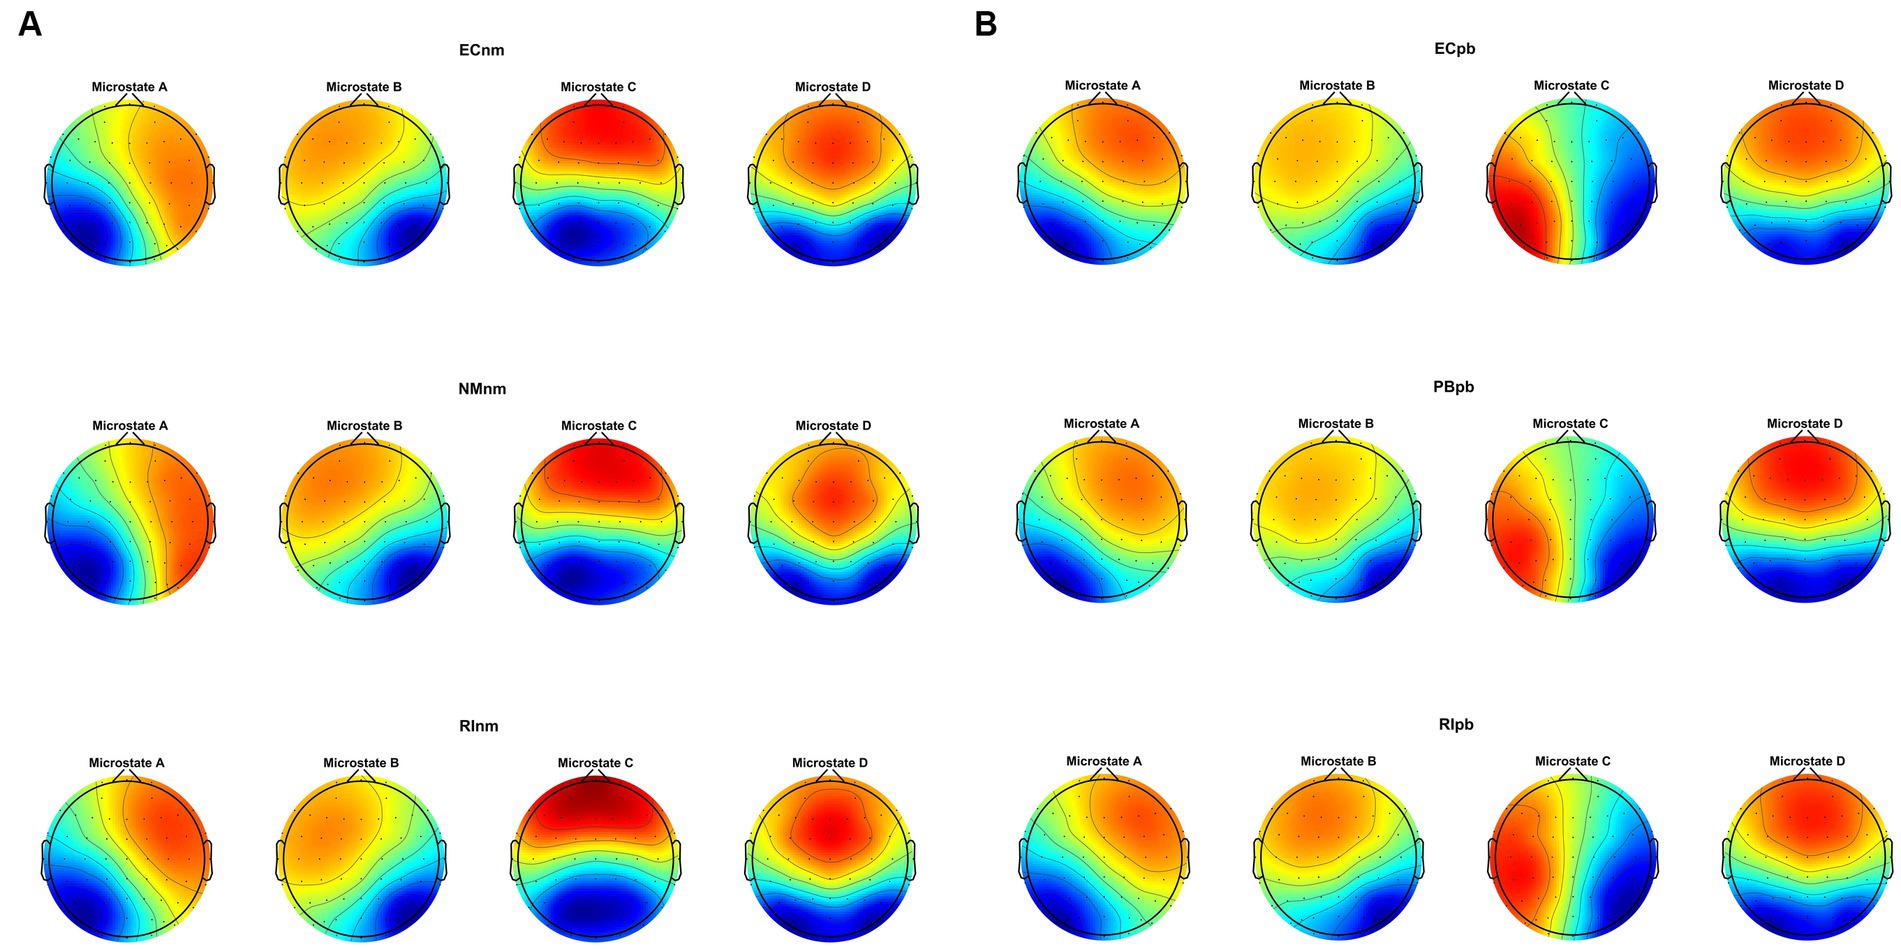
3.4 Microstate analysis 3.4.1 Microstate topographiesMicrostate analysis revealed that global clustering in TMNMT group (ECnm, NMnm, RInm subgroups) and Placebo group (ECpb, PBpb, RIpb subgroups) generated four microstates, that labeled Microstate A to D. In all groups, the four topographies of microstate classes A, B, C, and D were in accordance with those in previous reports (Lehmann et al., 1998; Custo et al., 2017; Michel and Koenig, 2018; Musaeus et al., 2019; Tait et al., 2020). Scalp topographies exhibited a left posterior-right anterior orientation (Microstate A), a right posterior -left anterior orientation (Microstate B), an anterior–posterior orientation (Microstate C), and a fronto-central maximum (Microstate D), respectively (Figure 8A). Moreover, the topography of microstate class C of ECpb, PBpb and RIpb subgroups was similar to that reported by Qin et al. (2022) and Bréchet et al. (2019), that exhibited in the left middle frontal gyrus, the dorsal part of anterior cingulate and cuneus extending to the posterior cingulate cortex, and thalamus (Custo et al., 2017) (Figure 8B).
Figure 8. The spatial configuration of the four microstate topographies, separately for (A) TMNMT group and (B) Placebo group. Each row showed the three subgroups of TMNMT group and Placebo group. Each column showed the four topographic configurations (microstate A, B, C, D) for each subgroup. ECnm, EEG recordings with eyes closed stimuli-pre by TMNMT music; NMnm, EEG recordings with eyes closed stimuli-ing by TMNMT music; RInm, EEG recordings with eyes closed stimuli-post by TMNMT music; ECpb, EEG recordings with eyes closed stimuli-pre by Placebo music; PBpb, EEG recordings with eyes closed stimuli-ing by Placebo music; RIpb, EEG recordings with eyes closed stimuli-post by Placebo music.
3.4.2 Microstate metricsRepeated measures ANOVA was conducted to compare the duration, occurrence, coverage and transition possibility of the four microstates between TMNMT group and Placebo group. Microstate classes A, B, C and D were regarded as a within-subject factor and group as a between-subject factor.
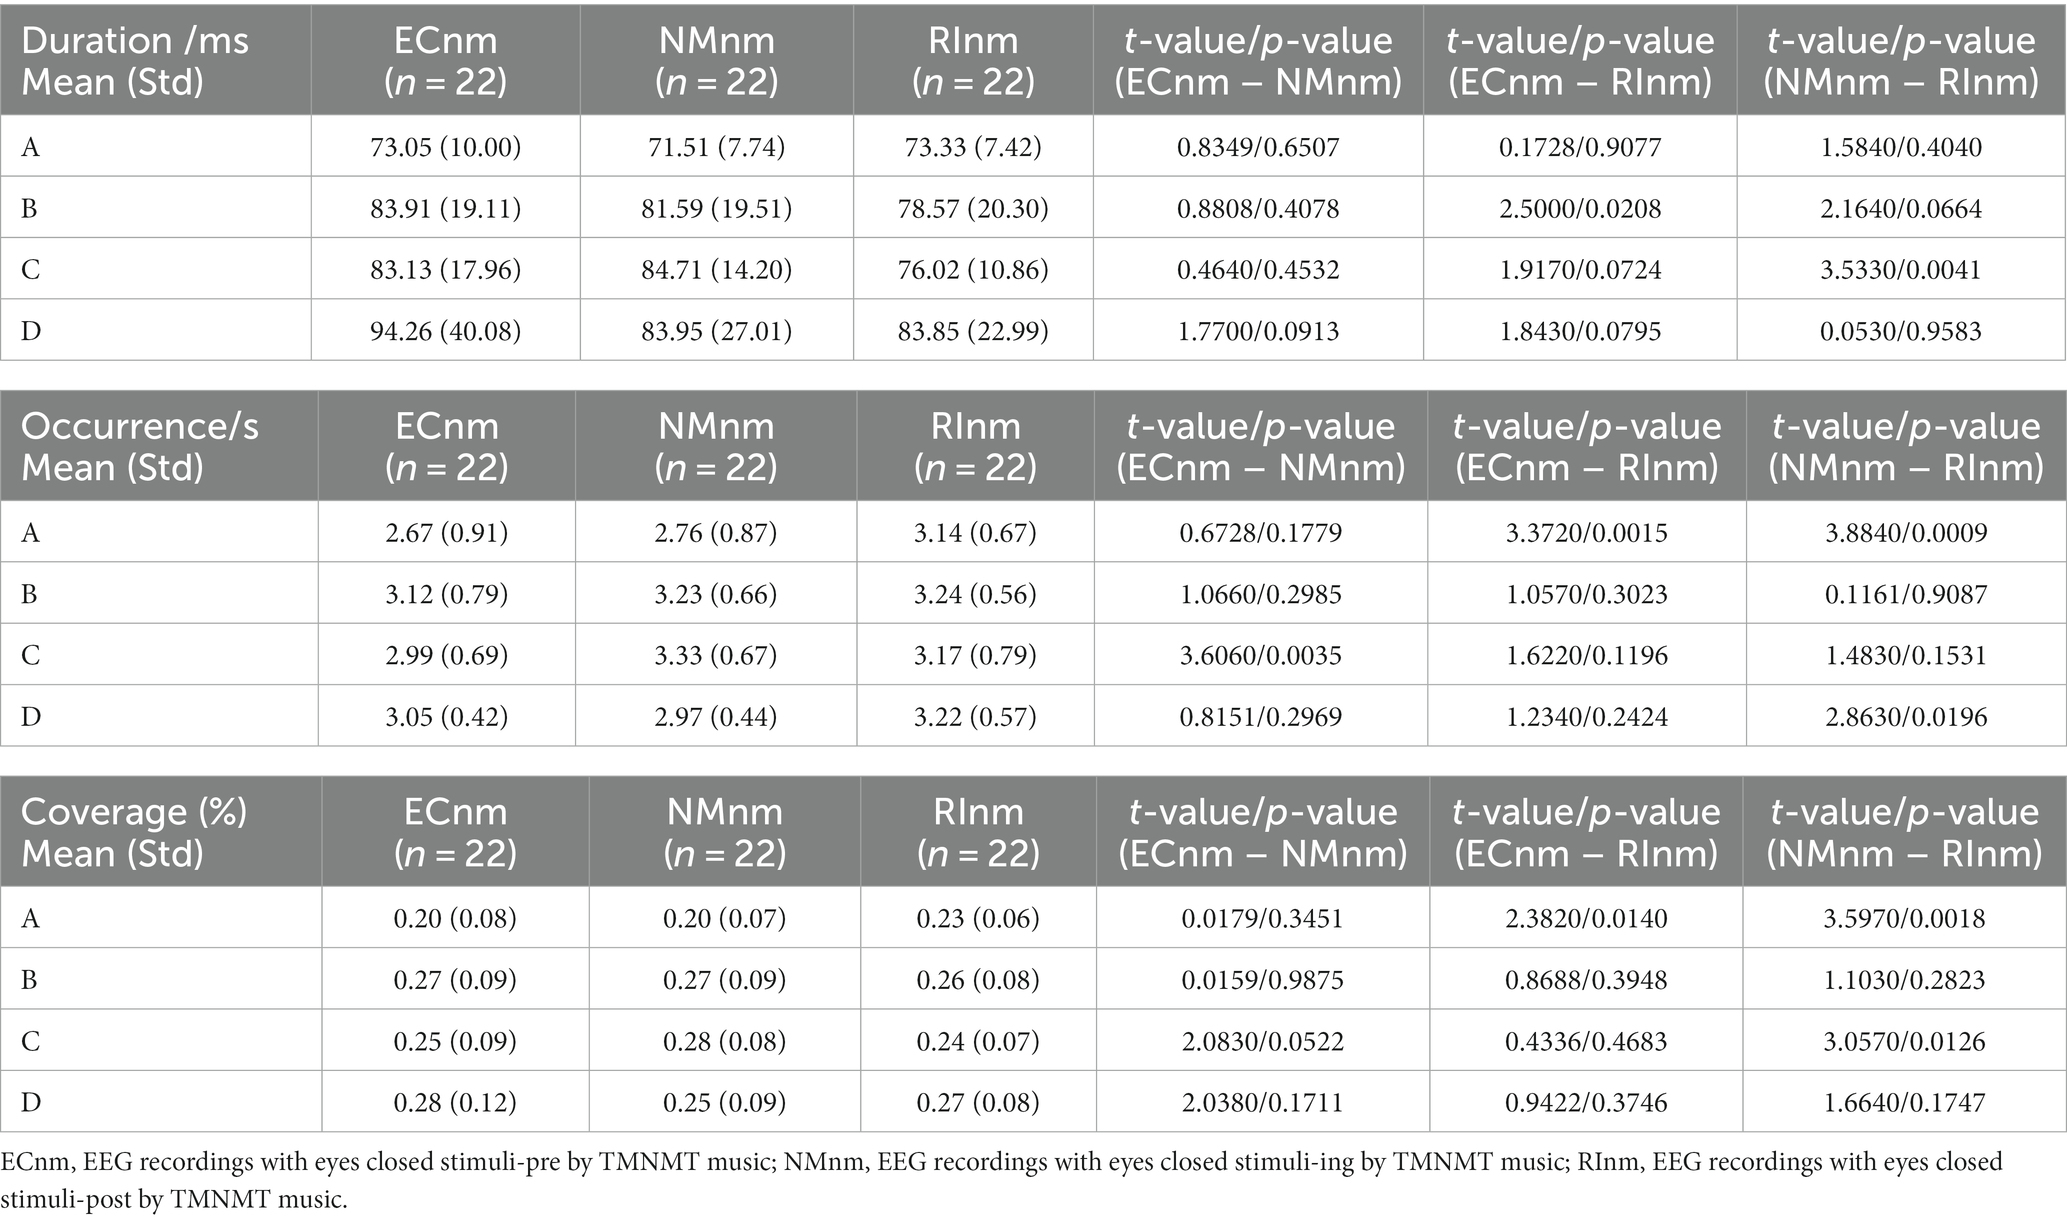
In TMNMT group, the results of microstate duration showed that the Microstate ∗ Group interaction effect (F = 2.192; p = 0.0461) and the main effect of group factor (F = 6.311; p = 0.00072) were significant, while the main effect of microstate factor was not significant (F = 2.298; p = 0.0834). Post-hoc comparisons showed microstate B of RInm subgroup had a shorter duration compared to ECnm subgroup (p = 0.0208), microstate C of RInm subgroup had a shorter duration compared to NMnm subgroup (p = 0.0041) (Table 4 and Figure 9A).
Table 4. The duration, occurrence, coverage of microstate (A–D) in TMNMT group (ECnm, NMnm, RInm).
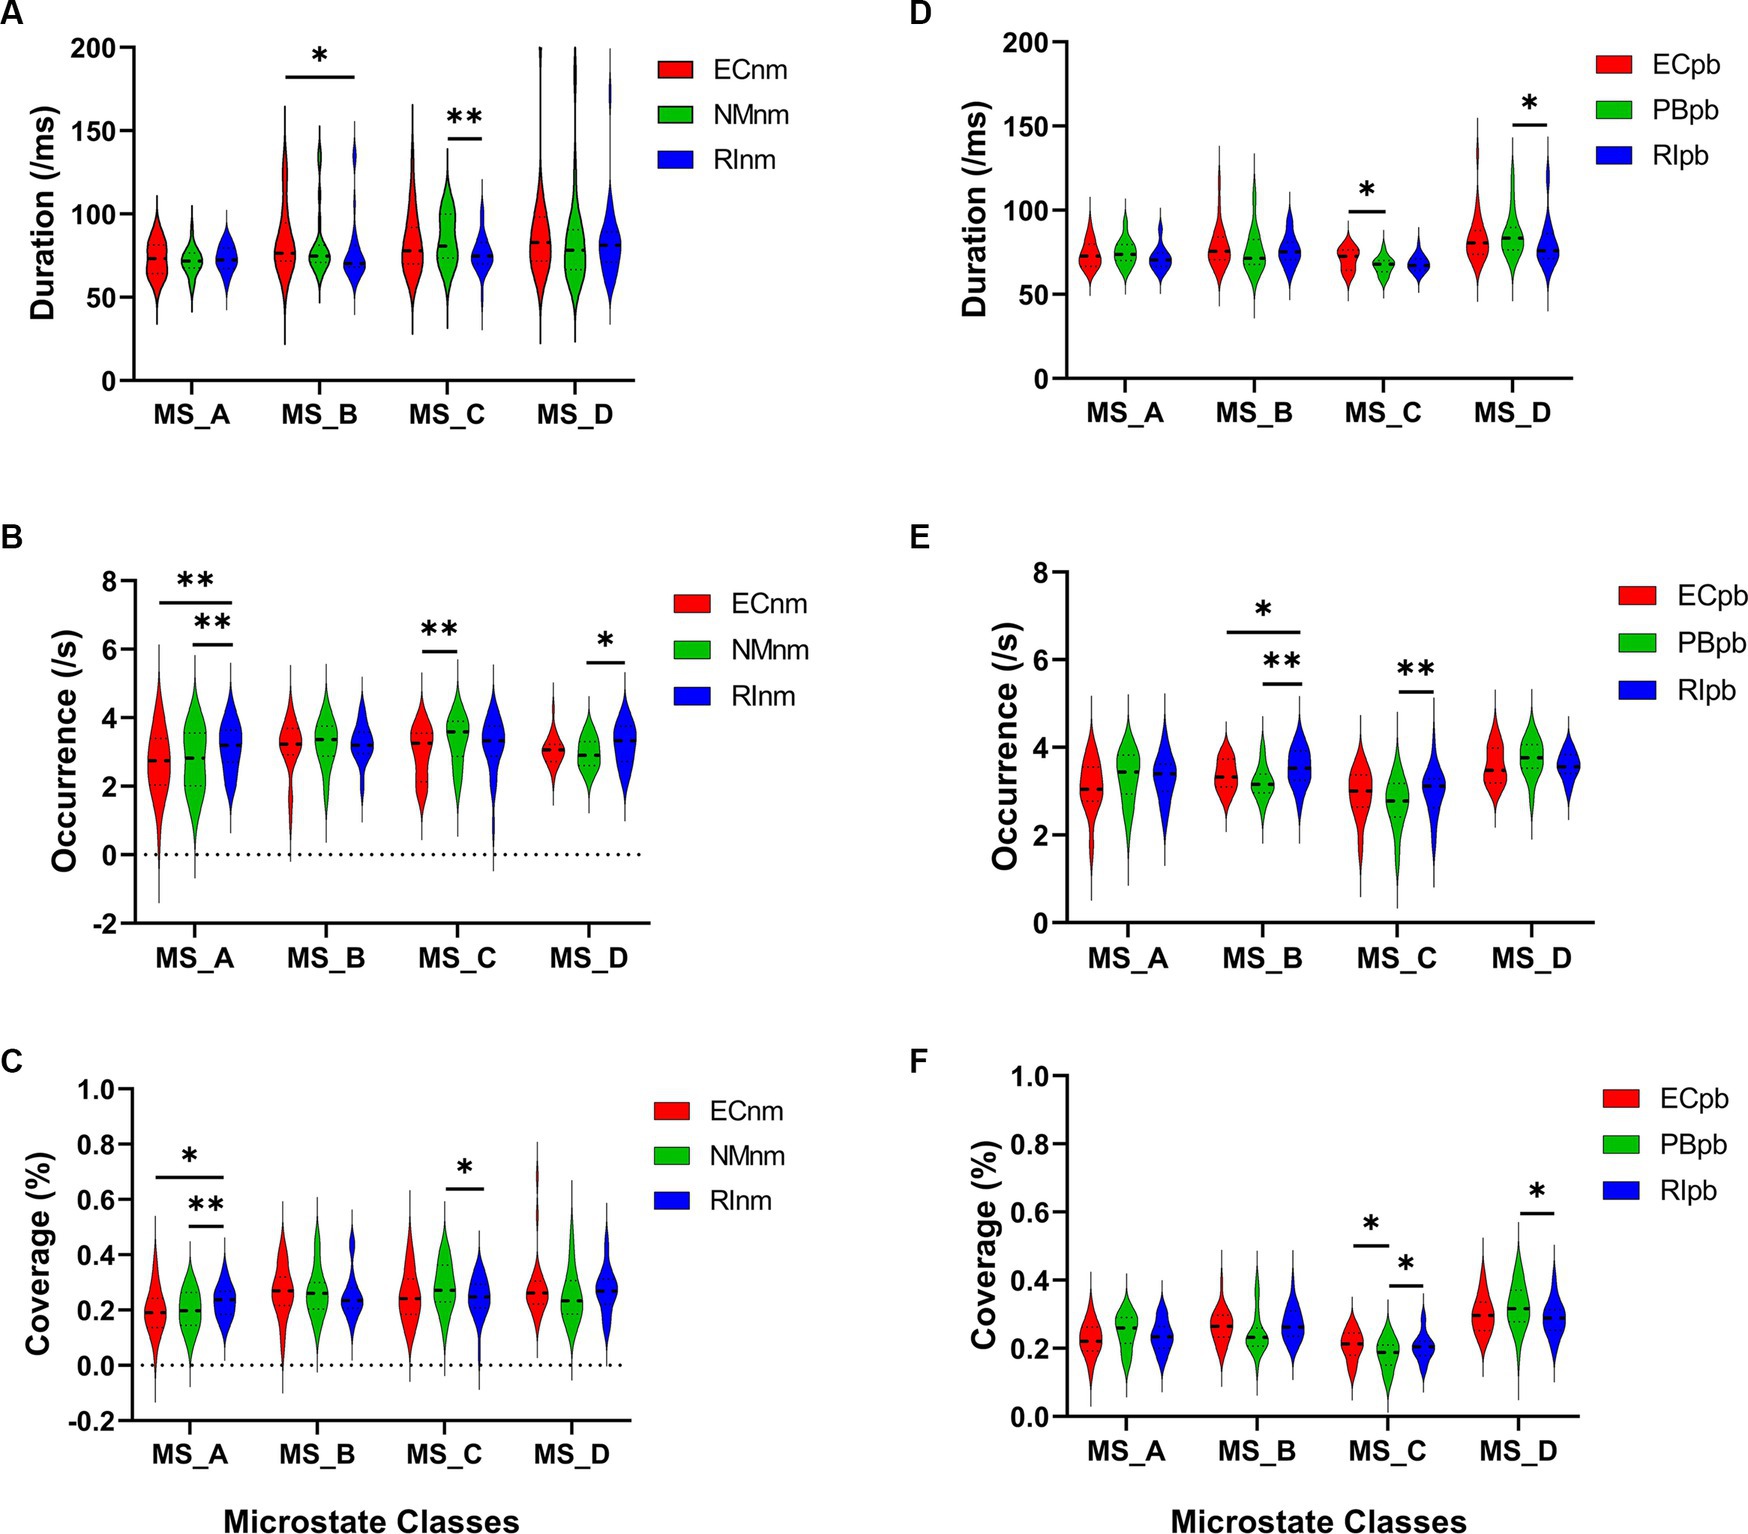
Figure 9. Microstate analysis of temporal metrics results: duration, occurrence, and coverage. Violin plots show each microstate class in the three subgroups of TMNMT and Placebo groups. (A) Microstate B of RInm had a shorter duration compared to ECnm, microstate C of RInm had a shorter duration compared to NMnm. (B) Microstate A of RInm had a higher occurrence compared to ECnm and NMnm, microstate C of NMnm had a higher occurrence compared to ECnm, and microstate D of RInm had a higher occurrence compared to NMnm. (C) microstate A of RInm had a higher coverage compared to ECnm and NMnm, microstate C of RInm had a lower coverage compared to NMnm. (D) Microstate C of PBpb had a shorter duration compared to ECpb, and microstate D of RIpb had a shorter duration compared to PBpb. (E) Microstate B of RIpb had a higher occurrence compared to ECpb and PBpb, microstate C of RIpb had a higher occurrence compared to PBpb. (F) Microstate C of PBpb had a lower coverage compared to ECpb and RIpb had a higher coverage compared to PBpb, microstate D of RIpb had a lower coverage compared to PBpb. ECnm, EEG recordings with eyes closed stimuli-pre by TMNMT music; NMnm, EEG recordings with eyes closed stimuli-ing by TMNMT music; RInm, EEG recordings with eyes closed stimuli-post by TMNMT music; ECpb, EEG recordings with eyes closed stimuli-pre by Placebo music; PBpb, EEG recordings with eyes closed stimuli-ing by Placebo music; RIpb, EEG recordings with eyes closed stimuli-post by Placebo music. *p < 0.05, **p < 0.01.
The results of microstate occurrence showed that the Microstate ∗ Group interaction effect (F = 3.171; p = 0.0057) and the main effect of group factor (F = 8.912; p = 0.0003) were significant, while the main effect of microstate factor was not significant (F = 1.28; p = 0.2866). Post-hoc comparisons showed microstate A of RInm subgroup had a higher occurrence compared to ECnm subgroup (p = 0.0015) and NMnm subgroup (p = 0.0009), microstate C of NMnm subgroup had a higher occurrence compared to ECnm subgroup (p = 0.0035), microstate D of RInm subgroup had a higher occurrence compared to NMnm subgroup (p = 0.0196) (Table 4 and Figure 9B).
For the coverage of microstate, the Microstate ∗ Group interaction effect (F = 4.219; p = 0.0006) and the main effect of microstate factor (F = 2.744; p = 0.0481) were significant, while the main effect of group factor was not significant (F = 0; p = 1). Post-hoc comparisons showed microstate A of RInm subgroup had a higher coverage compared to ECnm subgroup (p = 0.014) and NMnm subgroup (p = 0.0018), microstate C of RInm subgroup had a lower coverage compared to NMnm subgroup (p = 0.0126) (Table 4 and Figure 9C).
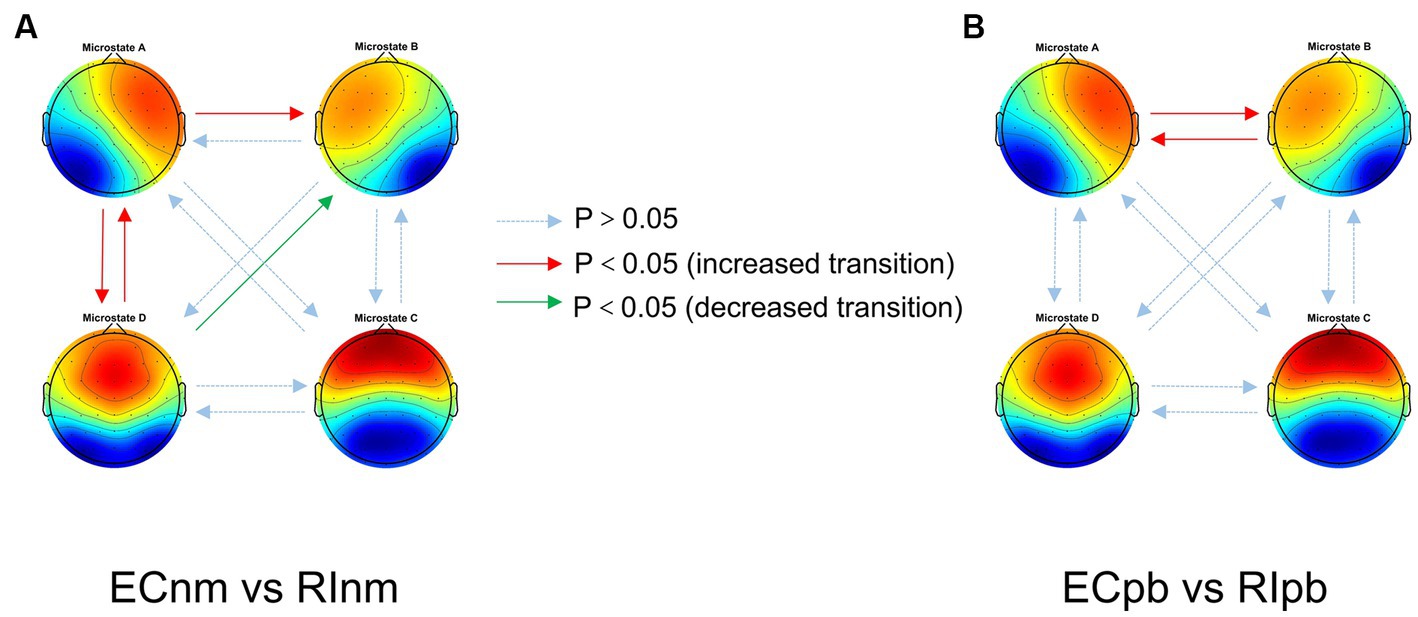
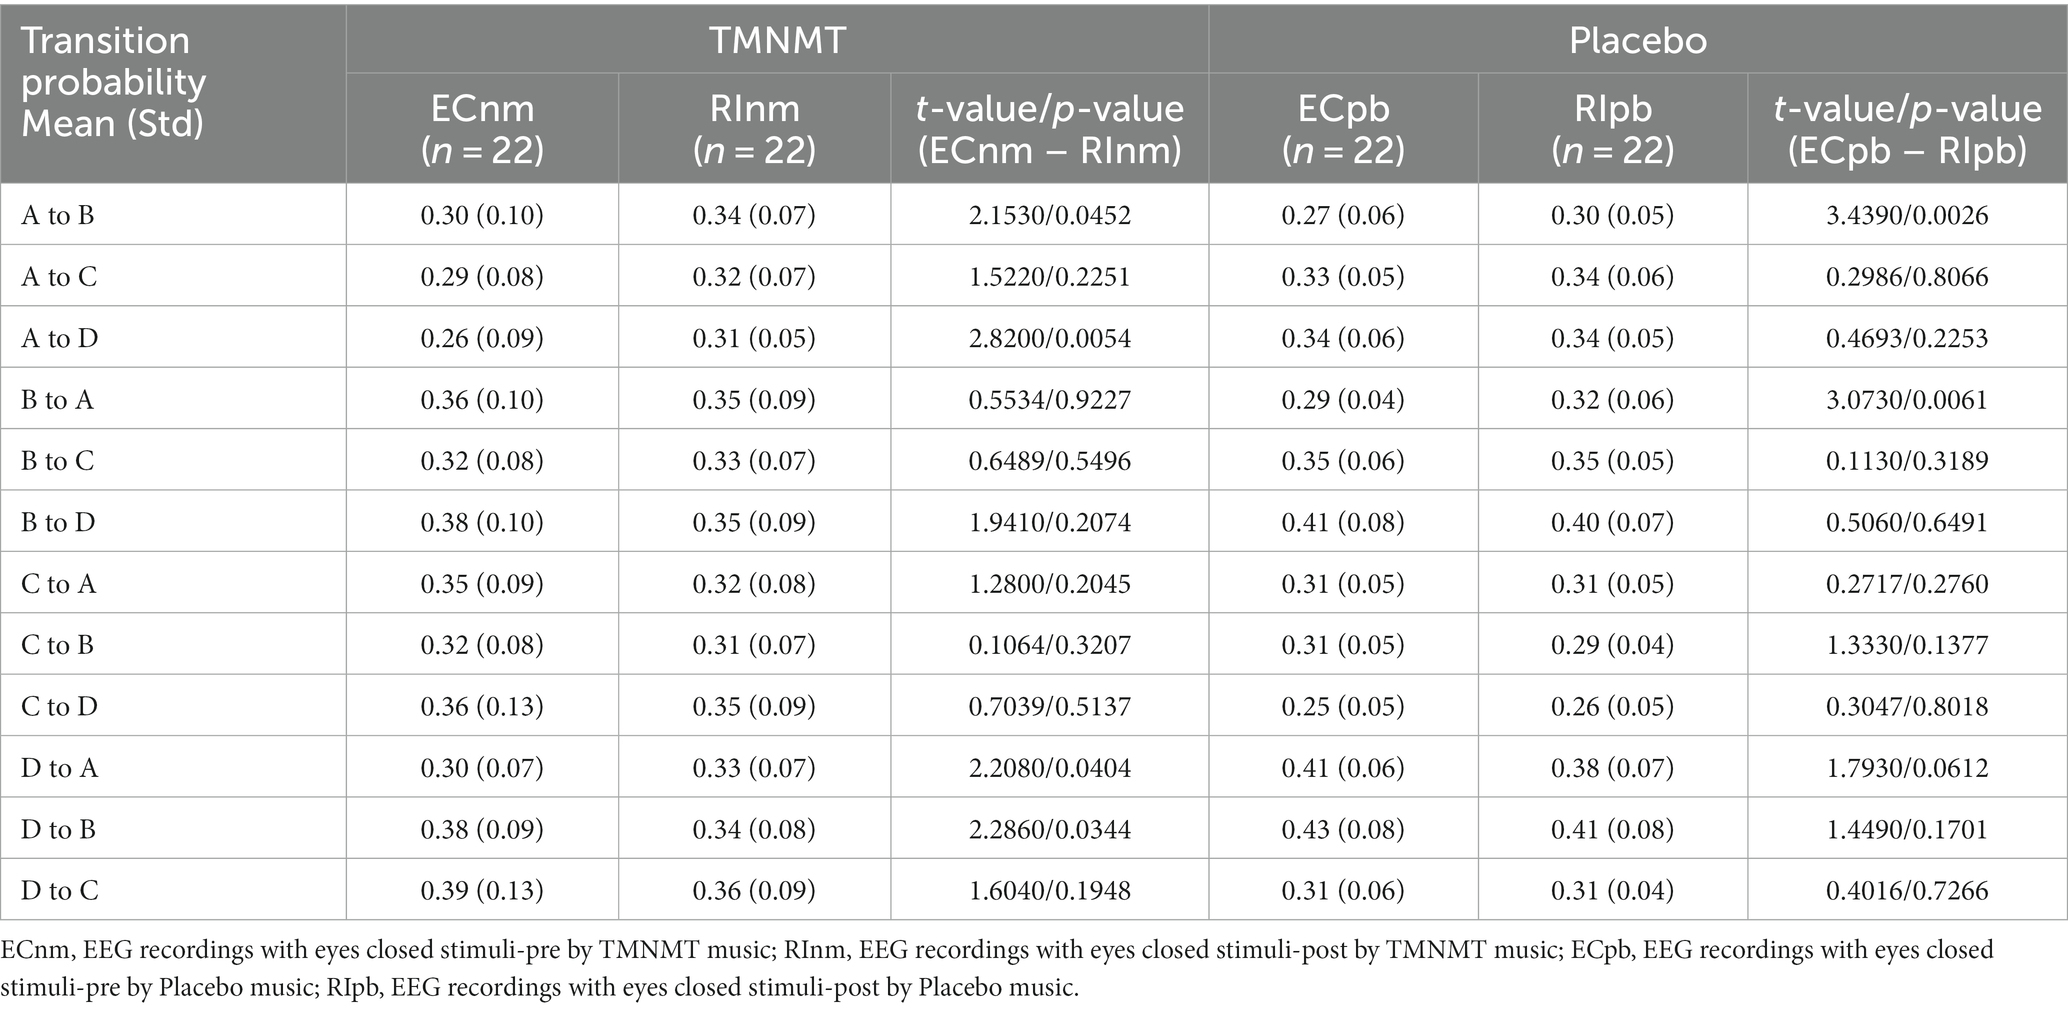
In terms of transition probabilities, we compared ECnm subgroup with RInm subgroup. The Microstate ∗ Group interaction effect (F = 4.31; p < 0.0001) and the main effect of microstate factor (F = 3.216; p = 0.0004) were significant, while the main effect of group factor was not significant (F = 0; p = 1). Post-hoc comparisons showed there were a lower possibility of transition from “D to B” in RInm subgroup compared to ECnm subgroup (p = 0.0344), a higher possibility of transition from “A to B” (p = 0.0452), “A to D” (p = 0.0054) and “D to A” (p = 0.0404) in RInm subgroup compared to ECnm subgroup (Table 6 and Figure 10A).
Figure 10. Schematic view of microstate syntax analysis results. A significant difference in transition probabilities for each pair of microstate class between ECnm subgroup and RInm subgroup (A), ECpb subgroup and RIpb subgroup (B). ECnm, EEG recordings with eyes closed stimuli-pre by TMNMT music; RInm, EEG recordings with eyes closed stimuli-post by TMNMT music; ECpb, EEG recordings with eyes closed stimuli-pre by Placebo music; RIpb, EEG recordings with eyes closed stimuli-post by Placebo music.
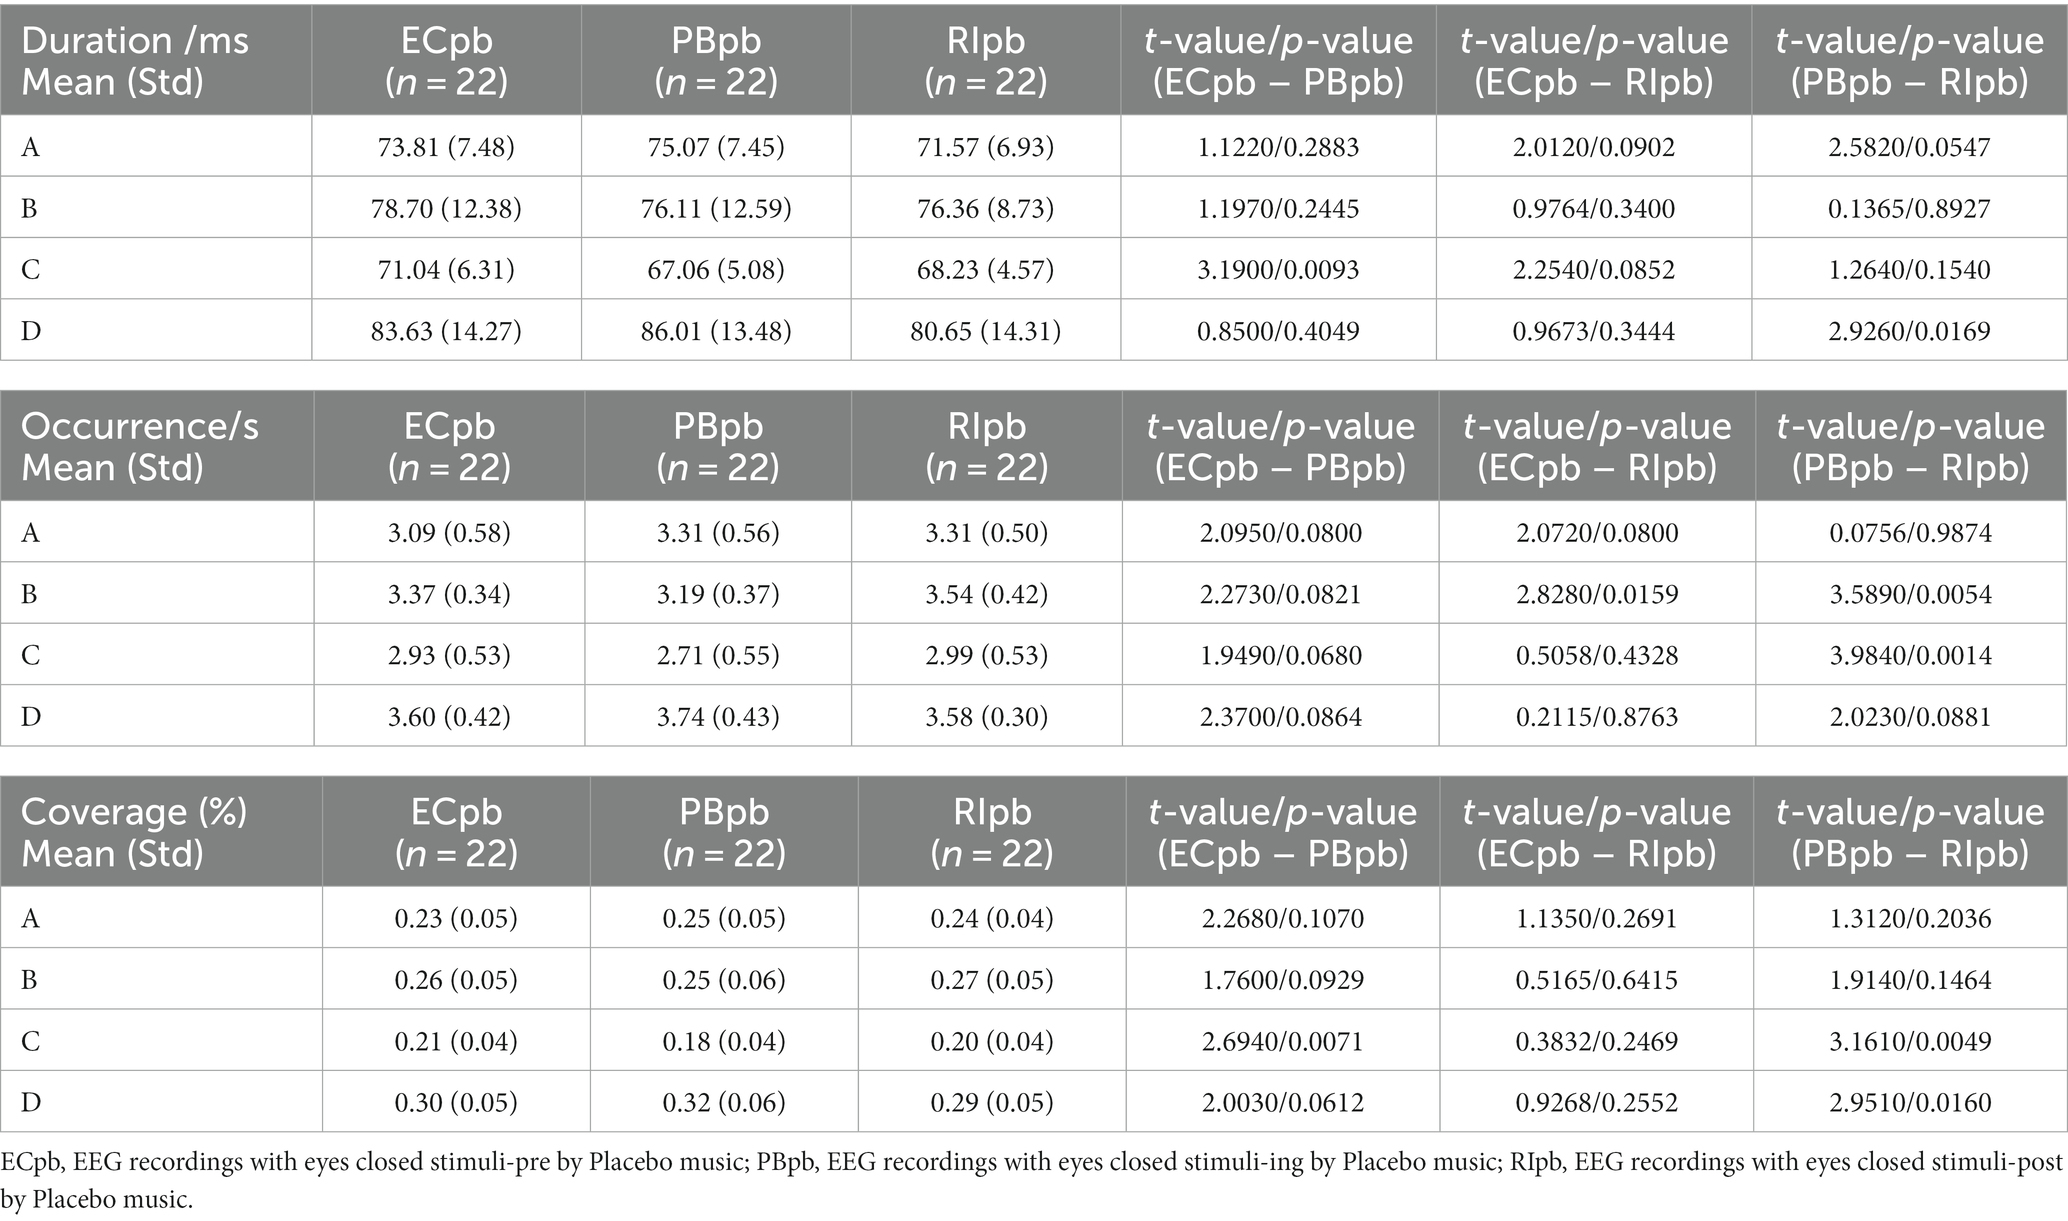
In Placebo group, the results of microstate duration showed that the Microstate ∗ Group interaction effect was not significant (F = 1.765; p = 0.1090), and the main effect of microstate factor (F = 10.40; p < 0.0001) and group factor (F = 4.003; p = 0.0245) were significant. Post-hoc comparisons showed microstate C of PBpb subgroup had a shorter duration compared to ECpb subgroup (p = 0.0093), microstate D of RIpb subgroup had a shorter duration compared to PBpb subgroup (p = 0.0169) (Table 5 and Figure 9D).
Table 5. The duration, occurrence, coverage of microstate (A–D) in Placebo group (ECpb, PBpb, RIpb).
The results of microstate occurrence showed that the Microstate ∗ Group interaction effect (F = 4.853; p = 0.0001), the main effect of microstate factor (F = 13.03, p < 0.0001) and the main effect of group factor (F = 4.055; p = 0.0199) were significant. Post-hoc comparisons showed microstate B of RIpb subgroup had a higher occurrence compared to ECpb subgroup (p = 0.0159) and PBpb subgroup (p = 0.0054), microstate C of RIpb subgroup had a higher occurrence compared to PBpb subgroup (p = 0.0014) (Table 5 and Figure 9E).
For the coverage of microstate, the Microstate ∗ Group interaction effect (F = 4.811; p = 0.0001) and the main effect of microstate factor (F = 24.27; p < 0.0001) were significant, while the main effect of group factor was not significant (F = 0; p = 1). Post-hoc comparisons showed microstate C of PBpb subgroup had a lower coverage compared to ECpb subgroup (p = 0.0071) and RIpb subgroup had a higher coverage compared to PBpb subgroup (p = 0.0049), microstate D of RIpb subgroup had a lower coverage compared to PBpb subgroup (p = 0.0160) (Table 5 and Figure 9F).
In terms of transition probabilities, we compared ECpb subgroup with RIpb subgroup. The Microstate ∗ Group interaction effect (F = 4.812; p < 0.0001) and the main effect of microstate factor (F = 24.31; p < 0.0001) were significant, while the main effect of group factor was not significant (F = 0; p = 1). Post-hoc comparisons showed there were a higher possibility of transition from “A to B” (p = 0.0026) and “B to A” (p = 0.0061) in RIpb subgroup compared to ECpb subgroup (Table 6 and Figure 10B).
Table 6. Transition probabilities from one microstate class to all other classes in TMNMT and Placebo groups.
All of the above value of ps effect had been corrected for multiple comparisons of FDR.
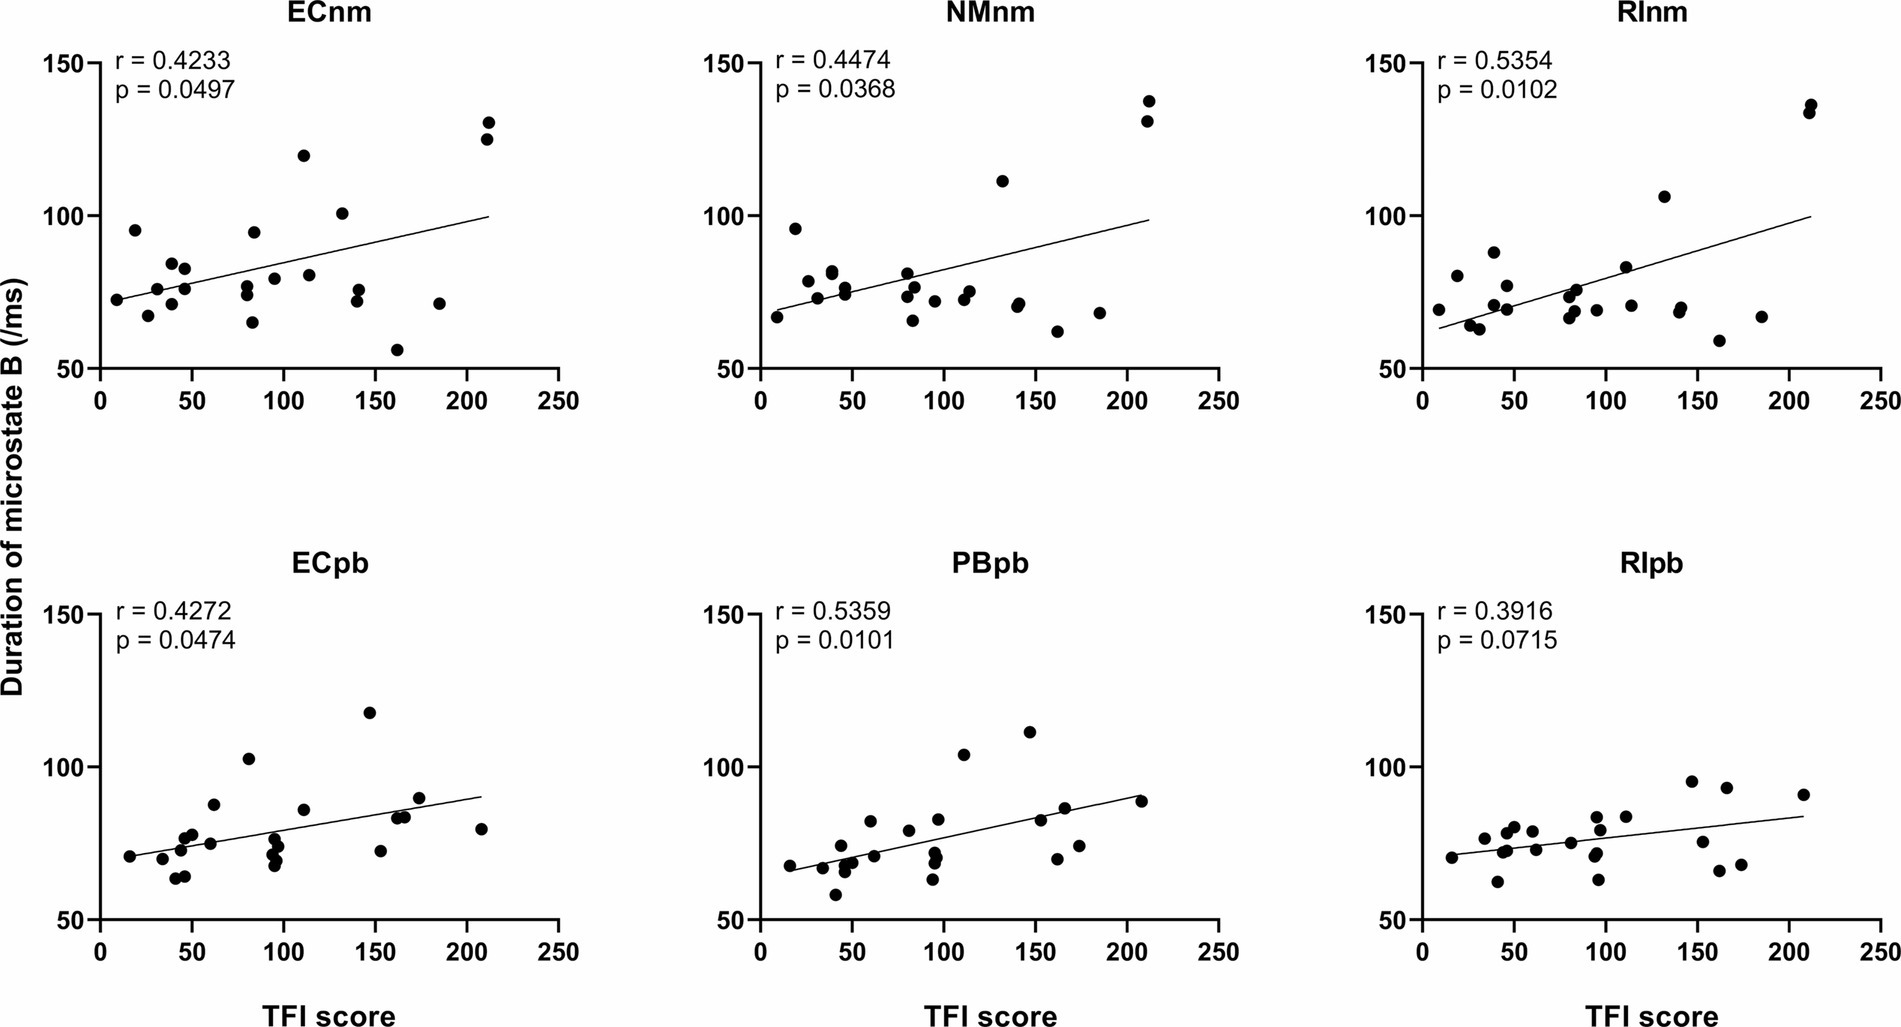
3.4.3 Correlation between microstate metrics and TFI scoreWe performed the Pearson correlation between microstate metrics and TFI score. The results revealed a significant positive correlation between the duration of microstate B and TFI score in ECnm subgroup (r = 0.4233, p = 0.0497), NMnm subgroup (r = 0.4474, p = 0.0368), RInm subgroup (r = 0.5354, p = 0.0102), ECpb subgroup (r = 0.4272, p = 0.0474), PBpb subgroup (r = 0.5359, p = 0.0101), and there was a positive correlation between the duration of microstate B and TFI score in RIpb subgroup, although it was not significant (r = 0.3916, p = 0.0715) (Figure 11). All of the above value of ps effect had been corrected for multiple comparisons of FDR.
Figure 11. Correlation between the duration of microstate B and each subgroup. ECnm, EEG recordings with eyes closed stimuli-pre by TMNMT music; NMnm, EEG recordings with eyes closed stimuli-ing by TMNMT music; RInm, EEG recordings with eyes closed stimuli-post by TMNMT music; ECpb, EEG recordings with eyes closed stimuli-pre by Placebo music; PBpb, EEG recordings with eyes closed stimuli-ing by Placebo music; RIpb, EEG recordings with eyes closed stimuli-post by Placebo music.
4 DiscussionTo our knowledge, the current study is the first to investigate the residual inhibition (RI) effect of the tailor-made notched music training (TMNMT), and analyze the power spectral density (PSD) and microstate classes using a resting-state EEG. We also included a placebo group as a control to ensure the credibility of the findings. To ensure the authenticity of the experiment and enhance the reliability of the study’s conclusions, we implemented rigorous criteria during the recruiting tinnitus subjects. Beyond meeting basic conditions, we specifically focused on the severity of tinnitus, preferring to enroll individuals experiencing severe tinnitus. For instance, in this study, the average THI and TFI scores for both groups exceeded 38 and 90, respectively (refer to Table 1). These thresholds, with a THI score of 38 and a TFI score of 50 generally considered as cutoff values indicative of tinnitus-related high distress, were chosen to obtain genuine and accurate data, thereby reinforcing the robustness of our study. These comprehensive approaches provided valuable insights into the effectiveness of TMNMT and enhances the novelty and significance of our research.
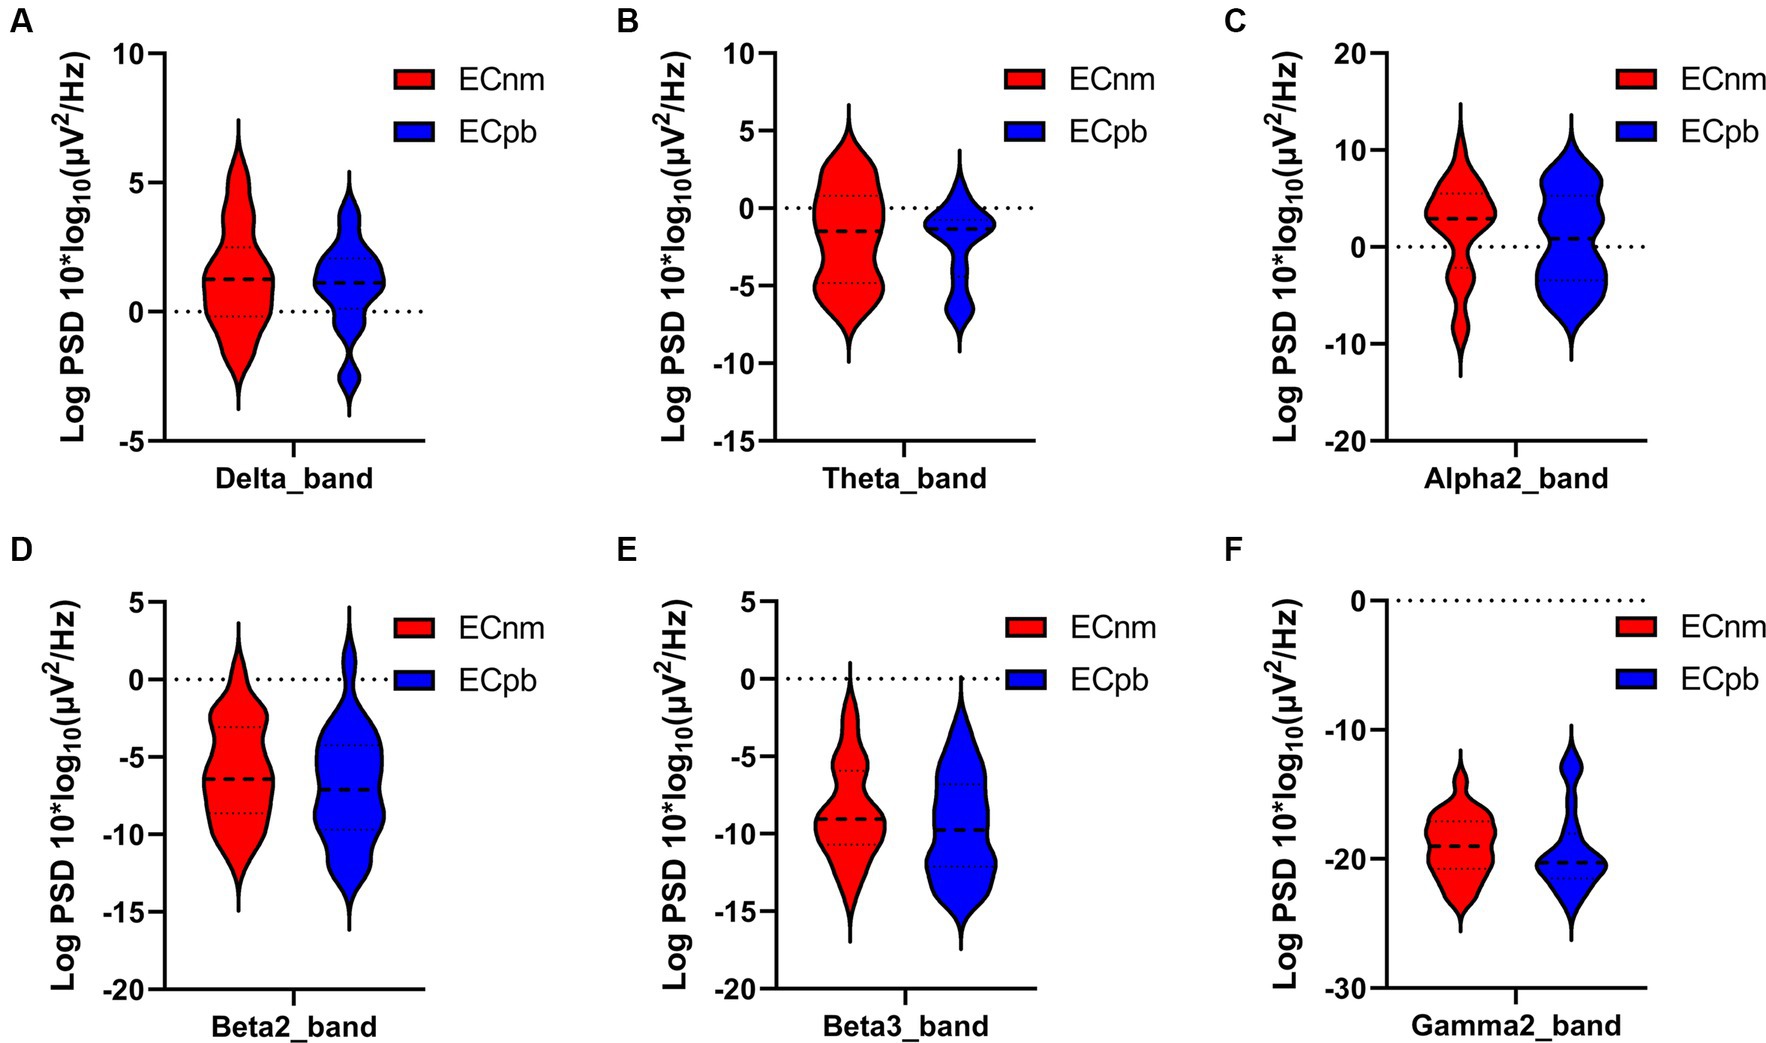
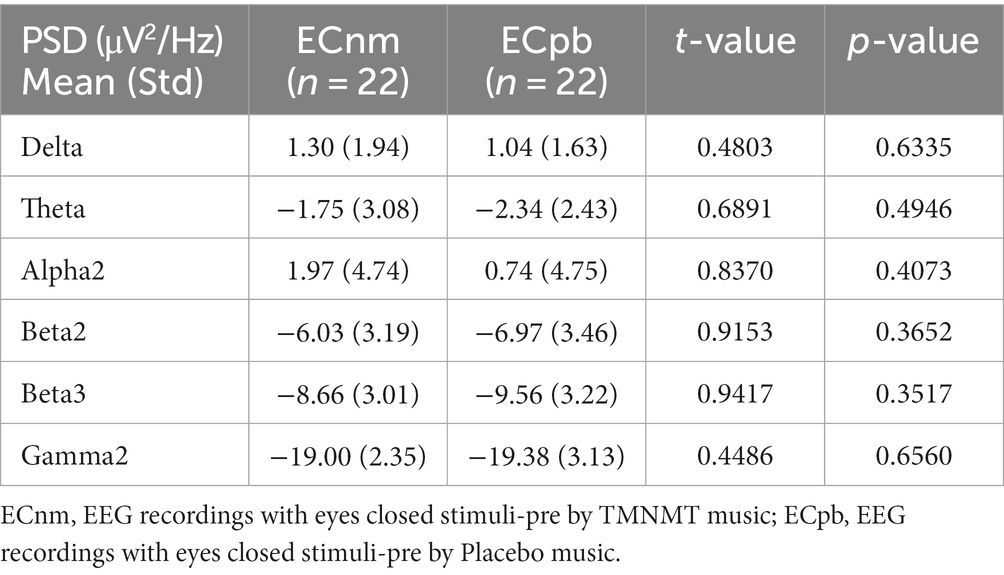
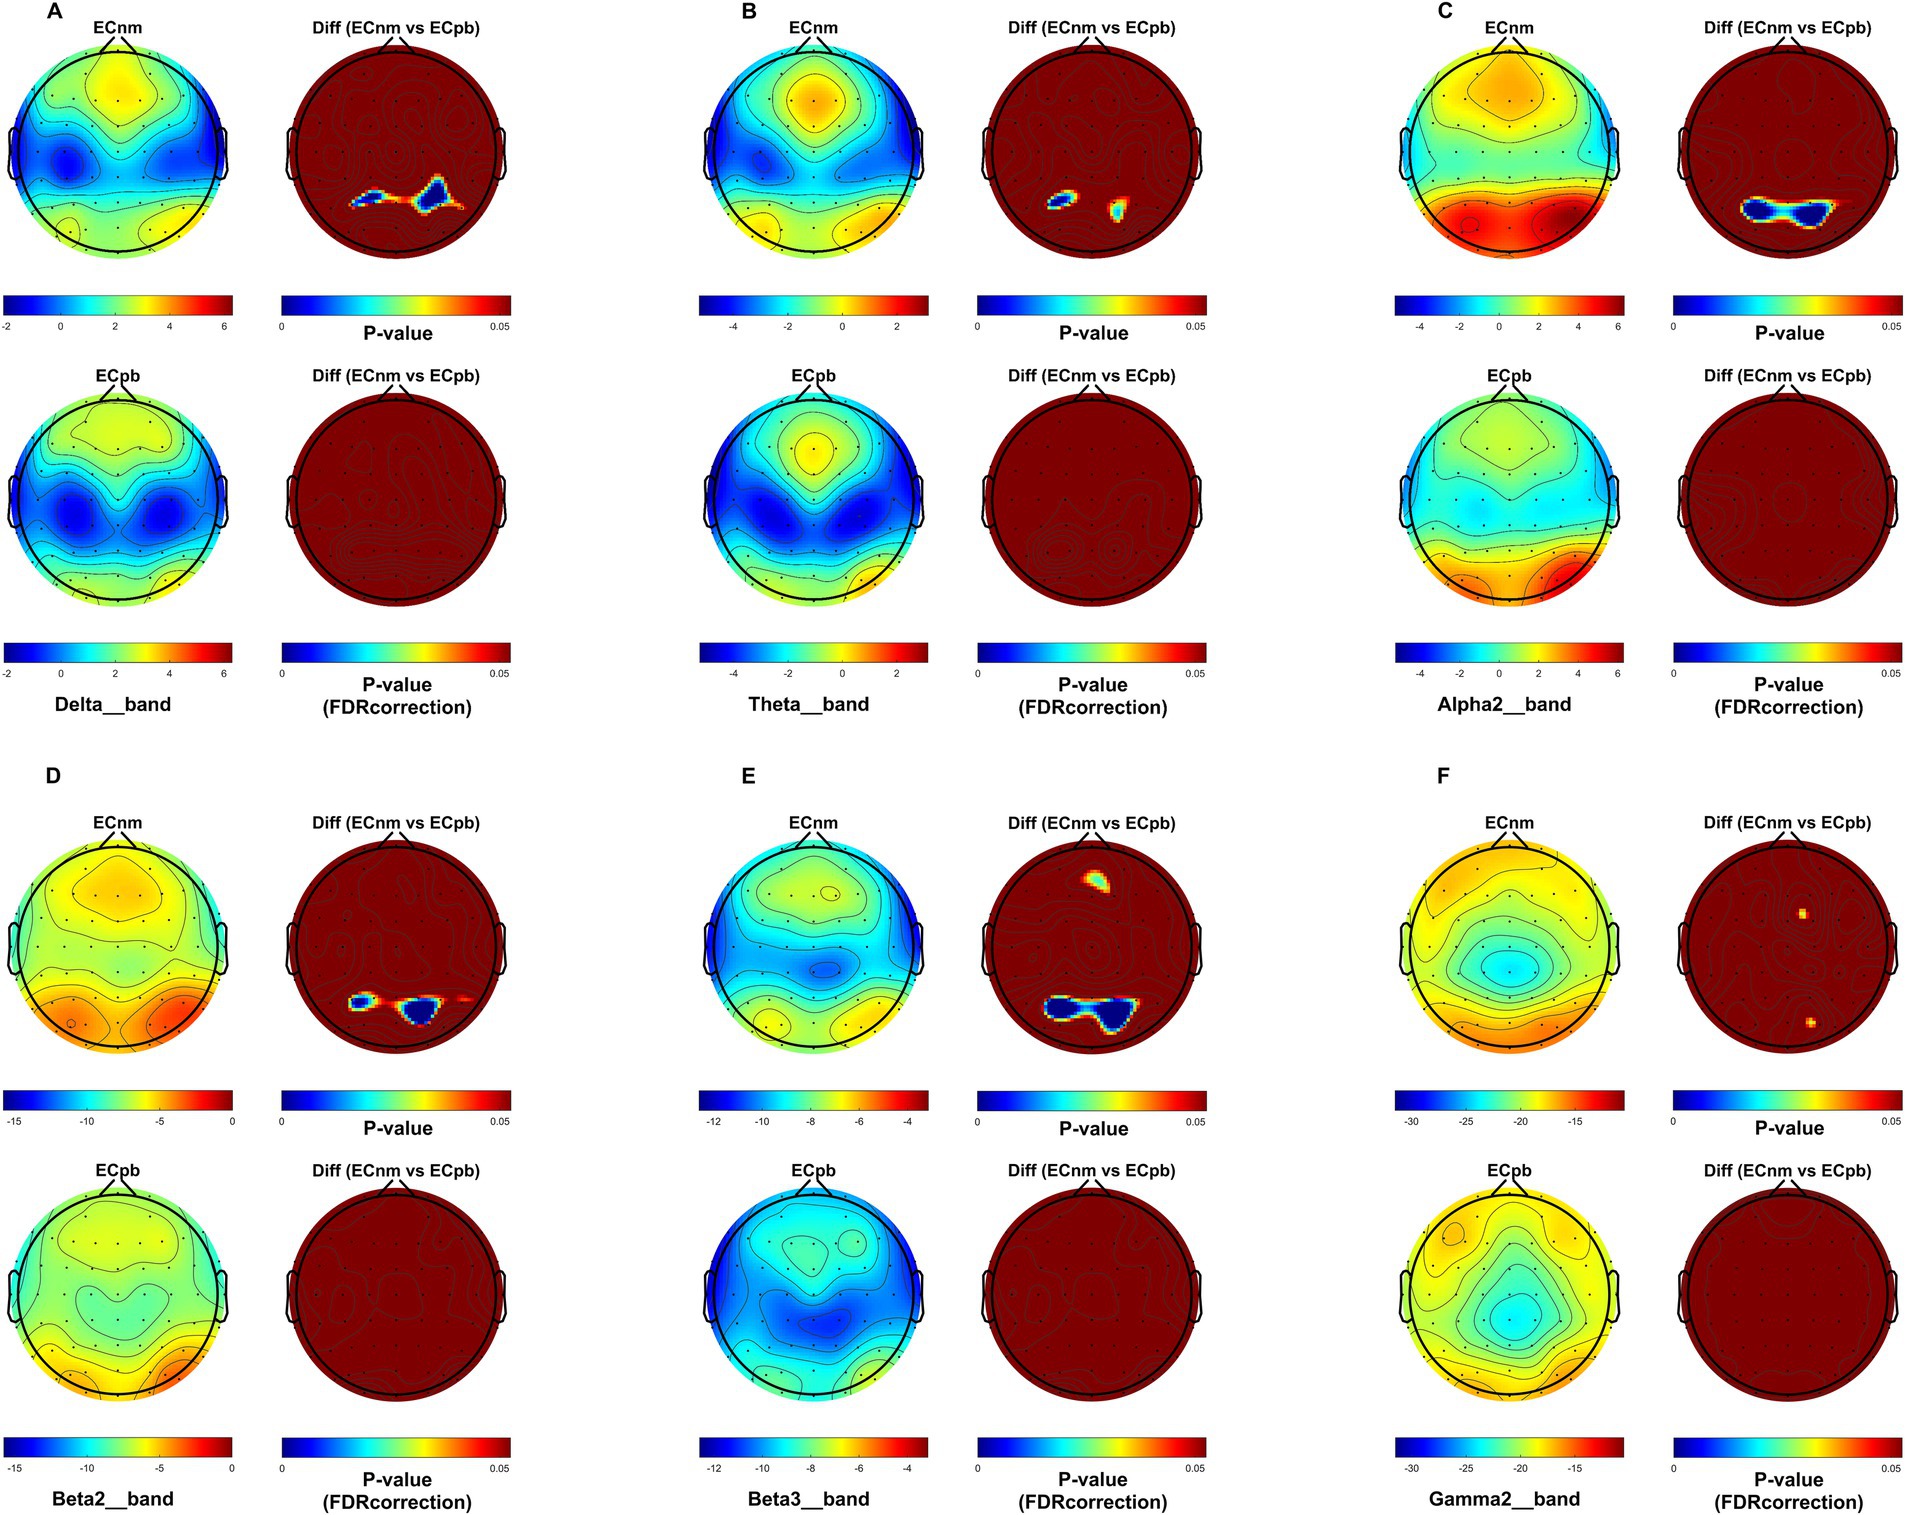
4.1 Whole-brain spectral analysisTo mitigate potential interference from other factors affecting the results, such as baseline differences or confounding variables, we conducted a comparison of the power spectral density (PSD) between the ECnm and ECpb subgroups. Figure 12 showed the power spectral density (PSD) of delta (p = 0.6335), theta (p = 0.4946), alpha2 (p = 0.4073), beta2 (p = 0.3652), beta3 (p = 0.3517) and gamma2 bands (p = 0.6560) between the ECnm and ECpb subgroups. The results revealed there were no significant differences in the above frequency bands (Table 7 and Figure 12). From the scalp topographies, the PSD of delta, theta, alpha2, beta2, beta3 and gamma2 bands were not found significant differences between the ECnm and ECpb subgroups (Figure 13).
Figure 12. Waveforms of spectral analysis in ECnm vs. ECpb subgroups. (A–F) The PSD of delta (A), theta (B), alpha2 (C), beta2 (D), beta3 (E), gamma2 (F) bands in ECnm vs. ECpb subgroups. ECnm, EEG recordings with eyes closed stimuli-pre by TMNMT music; ECpb, EEG recordings with eyes closed stimuli-pre by Placebo music.
Table 7. The power spectral density (PSD) of whole-brain certain frequency bands in ECnm vs. ECpb subgroups.
Figure 13. Scalp topographies of spectral analysis in ECnm vs. ECpb subgroups. (A–F) Comparison of ECnm, ECpb of delta (A), theta (B), alpha2 (C), beta2 (D), beta3 (E), and gamma2 (F) bands. The first column showed the PSD across the whole brain within each subgroup, the first and second rows of the second column showed the uncorrected p values and corrected p values for multiple comparisons of a false discovery rate (FDR) across the whole brain within each two subgroups, respectively. ECnm, EEG recordings with eyes closed stimuli-pre by TMNMT music; ECpb, EEG recordings with eyes closed stimuli-pre by Placebo music.
The results of this study showed that compared to stimuli-pre (ECnm), the PSD of delta band was significantly increased after TMNMT stimuli for 5 min (RInm), with a widespread distribution across the scalp, and no significant changes in Placebo group. Slow waves are a characteristic feature observed in cortical regions that lack connectivity with thalamocortical afferents (Steriade, 2006). slow waves at the cortical level can be enhanced by low-threshold spike bursts, generated in thalamic nuclei when hyperpolarized during deafferentation or overinhibition (Weisz et al., 2007). Delta activity is a characteristic oscillatory activity generated by deafferented/deprived neuronal networks (Llinás et al., 2005). RI may indicate the transient reestablishment of balance between excitatory and inhibitory neuronal assemblies through reafferentation (Eggermont and Tass, 2015). Increase of the oscillatory power in the delta, theta, as well as decrease in alpha power were associated with the presence of tinnitus and its intensity (Llinás et al., 1999, 2005; Weisz et al., 2005, 2007; Van der Loo et al., 2009; De Ridder et al., 2011; Adjamian et al., 2012; Tass et al., 2012; Adamchic et al., 2014; De Ridder et al., 2014, 2015b; Elgoyhen et al., 2015). An increase of oscillatory EEG power is typically interpreted as an increase in neuronal synchronization in terms of coincident firing within neuronal populations (Nunez, 1981 Bickford et al., 1979; Hämäläinen et al., 1993; Niedermeyer and da Silva, 2005). It was further found that an increase in delta activity was often accompanied by a decrease in other frequency spectrum, among the alpha band (Uchida et al., 1991; Benoit et al., 2000) as also detected in our study. Therefore, it is reasonable to speculate that the change of delta activity in tinnitus may be a multilateral balance state related to various spectral powers such as alpha wave, rather than a single event (Weisz et al., 2005). Thus, the enhancement of delta activity in tinnitus in our study compared to Placebo control group may represent a potential model that TMNMT was involved in the processing of tinnitus associated with auditory deafferentation, which would activate systems associated with tinnitus generation/cognition operating within the frequency range of delta activity (Weisz et al., 2005).
In the current study, we also found the PSD of theta band was significantly increased after TMNMT stimuli for 5 min (RInm), with a widespread distribution across the scalp, and no significant changes in Placebo group. Importantly, it has been proposed that low-frequencies modulate activity over large spatial regions in long temporal windows, whereas high frequencies modulate activity over small spatial regions and short temporal windows (Von Stein and Sarnthein, 2000). In other words, low frequencies (delta, theta, alpha) can be considered as carrier waves (Freeman and Rogers, 2002), and higher frequencies (beta, gamma) as information waves, and the higher frequencies are nested or carried by the lower frequencies. The theta wave acts as a long-range carrier wave (Freeman, 2005), hypothetically connecting to a theta oscillation-based memory network. The theta wave then acts as a compensatory mechanism to retrieve missing information from memory when it cannot be obtained from the external environment, as is the case for tinnitus patients with hearing loss (De Ridder et al., 2015b). Tinnitus, pain, movement, and mood-related information, via high-frequency oscillating activities such as beta and gamma, can be nested on this theta wave by means of cross-frequency coupling (De Ridd
留言 (0)