
記住我

CKD is a global health problem, affecting an estimated 9% of the world's population (approximately 700 million people) in 2017.1 The most common causes of CKD are diabetes and hypertension, which can lead to kidney failure, cardiovascular disease, and mortality. CKD was the 12th leading cause of death globally in 2017,1 highlighting the need for sustainable and affordable health care approaches for this condition.
Patients with CKD can be readily identified at early stages of disease by reduced eGFR or albuminuria. Current international guidelines recommend referral to specialist kidney care services for patients with an eGFR <30 ml/min per 1.73 m2 or heavy albuminuria.2 However, most interventions to prevent progression of CKD have the strongest evidence for efficacy when initiated at higher eGFR,3–5 and primary care physicians frequently refer patients to nephrologists at early stages of CKD.6 As there are more patients with early stages of CKD than can be cared for by nephrologists,7 other models of providing evidence-based care for people with early CKD are needed.
Nurse practitioners are registered nurses with advanced practice training that allows them to practice autonomously. They can independently make clinical diagnoses, order and interpret laboratory and imaging tests, prescribe medications, and make referrals to other medical specialists and programs. The addition of nurse practitioner support to physician care has been previously shown to improve kidney outcomes in patients with moderate-to-severe CKD.8 However, it remains unclear whether care for early stages of CKD provided primarily by nurse practitioners can improve the quality of CKD care and outcomes. This is relevant to health systems as nurse practitioner care may help maximize use of limited specialist resources, allowing nephrologists to dedicate more time to patients with more complex or advanced diseases who require their expertise, with nurse practitioners providing care to patients with early CKD beyond that provided by primary care providers alone.
The purpose of this study was to compare the processes of care and outcomes of patients with early-stage CKD cared for by nurse practitioners to similar patients cared for by either primary care physicians alone or by nephrologists.
Methods SettingThis study was conducted in southern Alberta, Canada, where universal access to health care, including primary care, is funded by Alberta Health. Nephrology services in the region were provided by Alberta Kidney Care South, which used a central access system for referrals, which were triaged by a nephrologist to nurse practitioners or nephrologists. Eligibility for referral to nurse practitioners were (1) patients with diabetes and eGFR >30 ml/min per 1.73 m2 and/or urine albumin-creatine ratio (UACR) ≥30 mg/g (to convert to mg/mmol, multiply by 0.113) and (2) patients without diabetes and eGFR 30–60 ml/min per 1.73 m2 and UACR <300 mg/g because of suspected ischemic nephropathy. Because of limited capacity in the nurse practitioner clinic, once appointment times with nurse practitioners were filled, eligible patients were referred to one of the 37 nephrologists practicing in the region during the years of the study. The focus of care in the nurse practitioner CKD clinic was patient education, CKD laboratory monitoring, and evaluation and management of risk factors for CKD progression and cardiovascular events, including BP management, glycemic control, use of angiotensin-converting enzyme inhibitor (ACEi) or angiotensin receptor blockers (ARB) in patients with albuminuria, and treatment of dyslipidemia/cardiovascular risk reduction with statins. Three nurse practitioners worked in the clinic over the duration of the study after completing certified training in Alberta that allowed them to order laboratory tests and prescribe medications independently. Each completed a minimum of 3 months practical training in CKD clinics under the supervision of nephrologists, after which they were able to see patients independently following guidance from care protocols and with the availability to review patients with nephrologists when needed. The mean patient-to-nurse practitioner ratio in the program ranged from 35 to 91, and the mean number of patients to family physicians in the region ranged from 685 to 1064 during the years of the study.
Study Design and Data SourcesTwo propensity score–matched cohorts were created to compare outcomes of patients with CKD cared for by nurse practitioners with those of matched patients with similar characteristics cared for by (1) a primary care physician alone or (2) a nephrologist. Patients were followed from the date of their first visit in the nurse practitioner clinic, date of first visit with a nephrologist, and date of first encounter with a primary care physician after meeting nurse practitioner clinic eligibility criteria. Administrative health care and prescription medication data from Alberta Health laboratory, data from the Alberta Kidney Disease Network repository,9 and data on maintenance dialysis and kidney transplantation from Alberta Kidney Care10 were available for all residents of the province of Alberta and were used to create the study cohorts and measure exposures and outcomes.
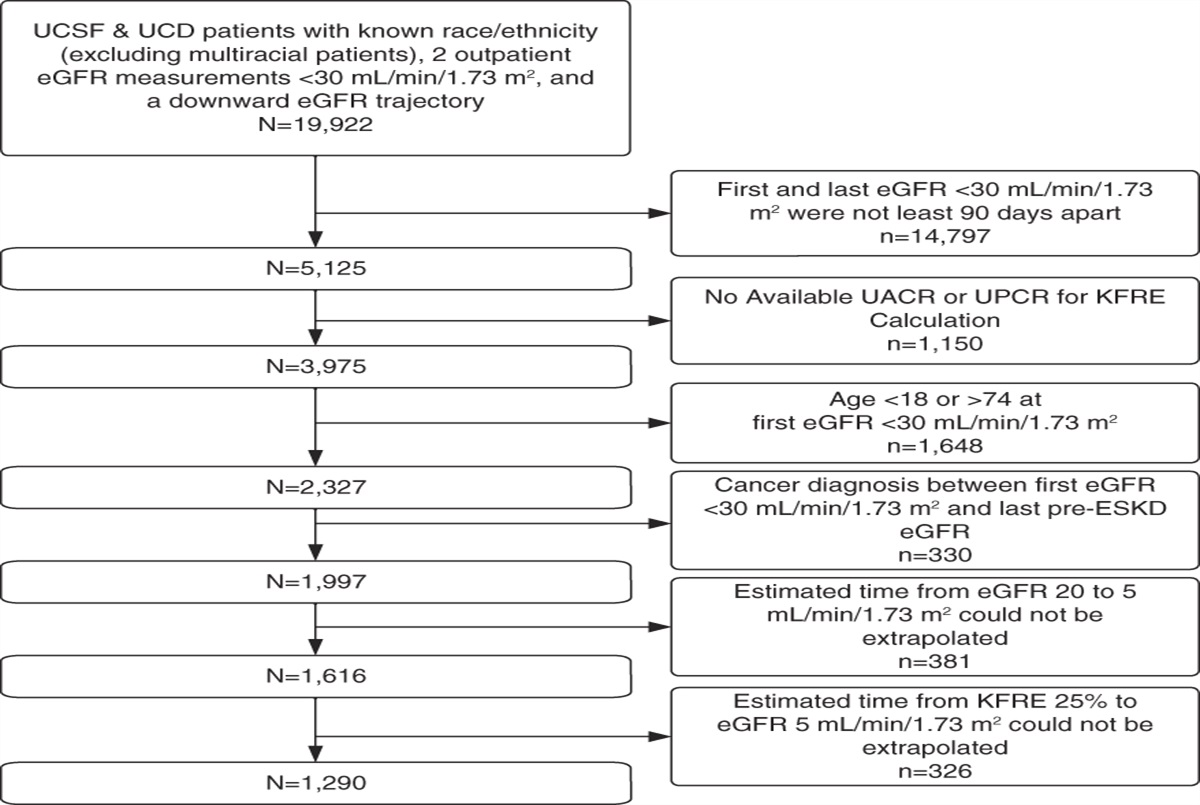
Cohort FormationEligible patients were age 18 years or older, residents of Southern Alberta, with early CKD who met referral criteria for the nurse practitioner CKD clinics between April 1, 2009, and November 1, 2017. Patients with kidney failure were identified by receipt of maintenance dialysis, prior kidney transplant, or eGFR <15 ml/min per 1.73 m2 before the cohort entry date and were excluded. CKD was identified by the presence of at least two measures of eGFR between 30 and 60 ml/min per 1.73 m2 that were >90 days apart2 or at least one measure of moderate or severe albuminuria (UACR >30 mg/g or protein-to-creatinine ratio ≥150 mg/g). eGFR was estimated from serum creatinine data using the 2009 Chronic Kidney Disease Epidemiology Collaboration equation without inclusion of the coefficient for race.11 Eligible patients with diabetes were identified by the presence of hospital diagnosis codes or physician claims according to a validated algorithm,12 a prescription dispensed for an antidiabetic medication, or hemoglobin A1C (HbA1C) ≥6.5%.13 Eligible patients without diabetes required the presence of at least one of the following conditions consistent with presumed ischemic nephropathy: hypertension identified from hospital diagnosis codes or physician claims according to a validated algorithm,14 a hospitalization or physician claim for a cardiovascular condition, age 65 years or older, or LDL cholesterol ≥ 2.0 mmol/L (77 mg/dl). The details of variables used to define the study cohorts can be found in Supplemental Tables 1–3.
Measurement of ExposuresThree mutually exclusive treatment groups were defined during the study period: (1) patients who attended the nurse practitioner CKD clinic, (2) patients who received care from a primary care physician only, and (3) patients who received care from a nephrologist. Cohort entry was defined as the date of the first visit to the nurse practitioner CKD clinic for patients in the nurse practitioner care group. The primary care group was identified by an outpatient practitioner claim by a primary care provider for CKD, with no outpatient claims by a nephrologist in the 5 years before cohort entry. The cohort entry date for this group was defined as the date of the first of these primary care physician claims after meeting nurse practitioner clinic eligibility criteria. The nephrology care group was identified by an outpatient claim by a nephrologist for CKD during the cohort entry period, with the cohort entry date defined by the date of the first of these claims for CKD after meeting the eligibility criteria.
Measurement of CovariatesBaseline demographic characteristics were identified from the Alberta Health registry database, while comorbidities were identified using hospitalization and physician claims12,14–17 with a 5-year look back period from the cohort entry date (Supplemental Table 3). Health care utilization was characterized by the number of emergency department (ED) visits and hospitalizations in the year before cohort entry. Primary care attachment was measured using the usual provider continuity index.18,19 Medications were identified by pharmacy prescriptions dispensed in the 5 years before cohort entry (Supplemental Tables 2 and 3). Laboratory test results were based on the last result before cohort entry with a maximum 5-year look back period.
Measurement of OutcomesProcess of care outcomes included one or more prescriptions for an ACEi or ARB, statin, or nonsteroidal anti-inflammatory drug (NSAID), and one or more outpatient eGFR measurement and albuminuria measurement within the year after cohort entry. Clinical outcomes included HbA1C concentration at 1 year (for those in the diabetic CKD subgroup) and clinical and health care utilization outcomes with follow-up from cohort entry date until death, out-migration from Alberta, 1 year after the last health care provider claim, or 5 years from cohort entry. Clinical outcomes included all-cause mortality and progression to kidney failure (defined by maintenance dialysis initiation, kidney transplant, or sustained eGFR <15 ml/min per 1.73 m2).20 Health resource utilization outcomes were rates of all-cause hospitalization, hospitalizations for cardiovascular events (myocardial infarction, stroke, or heart failure), and ED visits or hospitalizations for CKD-related ambulatory care sensitive conditions (i.e., heart failure, hyperkalemia, volume overload, or malignant hypertension).21 Information on identification of each outcome is available in Supplemental Table 4.
Propensity Score MatchingTwo propensity score–matched cohorts were created: The first included patients who received nurse practitioner care matched to patients who received primary care alone, while the second matched patients who received nurse practitioner care to patients who received nephrologist care. Propensity scores, which estimated the odds of receiving care in the nurse practitioner CKD clinic in each cohort, were derived using nonparsimonious multivariable logistic regression models. All baseline covariates reported in Table 1 were included as independent variables in the propensity score models. Unmeasured categories were used for laboratory test variables for patient without these measurements.
Table 1 - Baseline characteristics of adult patients in southern Alberta, Canada, with early-stage CKD receiving nurse practitioner or primary care alone, before and after propensity score matching Characteristic All Patients, No. (%) Matched Cohorta, No. (%) Nurse Practitioner Care (n=969) Primary Care (n=67,938) Standardized Difference Nurse Practitioner Care (n=961) Primary Care (n=961) Standardized Difference Demographic characteristics Age, yr <65, No. (%) 320 (33) 22,132 (33) — 315 (33) 289 (30) — ≥ 65, No. (%) 649 (67) 45,806 (67) — 646 (67) 672 (70) — Mean (SD) 70 (13) 70.1 (15) −0.026 69.8 (13) 70.6 (14) −0.060 Median (25th–75th percentile) 71 (62–80) 73 (61–81) — 71 (62–80) 74 (62–81) — Sex, No. (%) 0.169 0.017 Male 524 (54) 31,007 (46) 517 (54) 509 (53) Female 445 (46) 36,931 (54) 444 (46) 452 (47) Residence, No. (%) Metro 900 (93) 40,151 (59) 0.861 892 (93) 889 (92) 0.012 Rural 66 (7) 14,929 (22) −0.442 66 (7) 68 (7) −0.008 Urban 3 (0.3) 12,858 (19) −0.666 3 (0.3) 4 (0.4) −0.017 Clinical characteristics Diabetes mellitus, No. (%) 560 (58) 24,749 (36) 0.438 552 (57) 529 (55) 0.048 Hypertension, No. (%) 778 (80) 44,096 (65) 0.350 770 (80) 767 (80) 0.008 Prior CV hospitalization/claim, No. (%) Myocardial infarction 55 (6) 4316 (6) −0.028 55 (6) 52 (5) 0.014 Stroke 51 (5) 3242 (5) 0.022 50 (5) 37 (4) 0.065 Peripheral vascular disease 46 (5) 2268 (3) 0.072 46 (5) 46 (5) 0.000 Heart failure 128 (13) 6650 (10) 0.107 126 (13) 114 (12) 0.038 Hyperlipidemia 276 (28) 11,512 (17) 0.278 270 (28) 270 (28) 0.000 Angina 169 (17) 10,535 (16) 0.052 169 (17) 160 (17) 0.025 PCI 46 (5) 2280 (3) 0.071 46 (5) 50 (5) −0.019 CABG 19 (2) 866 (1) 0.054 19 (2) 19 (2) 0.000 Comorbidities, No. (%) Atrial fibrillation 51 (5) 4312 (6) −0.046 51 (5) 42 (4) 0.044 Cancer 30 (3) 3220 (5) −0.085 30 (3) 33 (3) −0.018 Dementia 33 (3) 3409 (5) −0.080 33 (3) 34 (3) −0.006 Depression 85 (9) 5767 (8) 0.010 85 (9) 100 (10) −0.053 Prior medication use, No. (%) ACEi/ARB 825 (85) 45,119 (66) 0.448 817 (85) 812 (84) 0.014 Antidiabeticb 521 (54) 22,789 (34) 0.416 514 (54) 483 (50) 0.065 Statin 696 (72) 31,883 (47) 0.524 688 (72) 661 (69) 0.061 eGFR category (ml/min per 1.73 m2)c, No. (%) ≥90 94 (10) 13,198 (19) −0.278 94 (10) 86 (9) 0.029 60–89 145 (15) 20,382 (30) −0.366 145 (15) 127 (13) 0.054 45–59 308 (32) 23,872 (35) −0.071 308 (32) 320 (33) −0.027 30–44 350 (36) 8085 (12) 0.591 343 (36) 361 (38) −0.039 15–29 72 (7) 1361 (2) 0.258 71 (7) 67 (7) 0.016 Unmeasured 0 (0) 1040 (2) −0.176 0 (0) 0 (0) 0.000 eGFR over prior 90 d — — No. of patients 934 32,149 926 481 Mean (SD) 51 (22) 68 (27) 51 (22) 52 (22) Median (25th–75th percentile) 45 (37–57) 61 (50–86) 45 (37–58) 45 (38–58) Albuminuriac, No. (%) Normal/mild 422 (44) 18,832 (28) 0.335 422 (44) 451 (47) −0.061 Moderate 333 (34) 20,541 (30) 0.088 333 (35) 327 (34) 0.013 Severe 205 (21) 2734 (4) 0.534 197 (20) 173 (18) 0.063 Unmeasured 9 (0.9) 25,831 (38) −1.060 9 (0.9) 10 (1) −0.010 HbA1Cc Mean (SD) 6.8 (1.4) 6.8 (1.6) 0.007 6.8 (1.4) 6.8 (1.5) 0.007 Median (25th–75th percentile) 6.3 (5.8–7.3) 6.2 (5.8–7.2) — 6.3 (5.8–7.3) 6.3 (5.8–7.1) — Normal (<6.0%), No. (%) 315 (32) 17,643 (26) 0.144 314 (33) 322 (33) −0.018 Prediabetic (6.0 to < 6.5%), No. (%) 209 (22) 10,965 (16) 0.139 208 (22) 232 (24) −0.060 Diabetic (≥6.5%), No. (%) 434 (45) 21,052 (31) 0.287 428 (45) 398 (41) 0.063 Unmeasured, No. (%) 11 (1) 18,278 (27) −0.799 11 (1) 9 (0.9) 0.020 LDL-Cc, No. (%) <77 mg/dl 453 (47) 17,637 (26) 0.443 446 (46) 442 (46) 0.008 ≥77 mg/dl 505 (52) 43,888 (65) −0.255 504 (52) 510 (53) −0.012 Unmeasured 11 (1) 6413 (9) −0.378 11 (1) 9 (0.9) 0.020 Health care utilization Prior ED visits, No. (%) −0.029 −0.002 0 667 (67) 45,835 (68) 662 (69) 661 (69) ≥1 302 (31) 22,103 (32) 299 (31) 300 (31) Prior hospitalizations, No. (%) −0.003 0.025 0 804 (83) 56,285 (83) 797 (83) 806 (84) ≥1 165 (17) 11,653 (17) 164 (17) 155 (16) Primary care attachment, No. (%) Low (0%–50%) 78 (8) 5621 (8) −0.008 77 (8) 88 (9) −0.041 Medium (50%–75%) 283 (29) 15,469 (23) 0.147 279 (29) 258 (27) 0.049 High (75%–100%) 571 (59) 39,948 (59) 0.003 568 (59) 574 (60) −0.013 No attachment 37 (4) 6900 (10) −0.251 37 (4) 41 (4) −0.021CV, cardiovascular; PCI, percutaneous coronary intervention; CABG, coronary artery bypass graft; ACEi, angiotensin-converting enzyme inhibitor; ARB, angiotensin receptor blocker; HbA1C, hemoglobin A1C; LDL-C, LDL cholesterol; ED, emergency department; DPP-4, dipeptidyl peptidase-4; GLP-1, glucagon-like peptide-1; SGLT2, sodium-glucose cotransporter-2.
aThe mean standardized difference in covariates between the two groups decreased from 4% (range: −106% to 86%) before to 0.6% (−6% to 6%) after matching.
bPrior antidiabetic medications consisted of metformin, sulfonylureas, thiazolidinediones, DPP-4, GLP-1, SGLT2, α-glucosidase, meglitinides, and insulin.
cThe laboratory value on or closest to the index date (before the cohort entry date) was used to determine the level. Normal/mild albuminuria was indicated by an albumin:creatinine ratio (urine albumin-creatine ratio) of 30 mg/g or less or by a protein:creatinine ratio of 150 mg/g or less; moderate, urine albumin-creatine ratio of 30–300 mg/g or protein:creatinine ratio of 150–500 mg/g; severe, urine albumin-creatine ratio of more than 300 mg/g or protein:creatinine ratio of more than 500 mg/g. To convert urine albumin-creatine ratio and protein:creatinine ratio to mg/mmol, multiply by 0.113. To convert LDL cholesterol from mg/dl to mmol/L, divide by 0.0259. Note: All characteristics were derived using a 5-year lookback period from the index date, except demographics (identified at cohort entry date) and health care utilization characteristics (identified over 1 year before cohort entry date).
To create the matched cohorts, patients were matched on the basis of their propensity scores while simultaneously forcing an exact match within strata on the basis of diabetic CKD versus nondiabetic CKD status. One-to-one nearest neighbor matching without replacement was used, with a caliper width of 0.2 of the SD of the logit of the propensity score. The balance in covariates before and after matching was compared using standardized differences,22,23 with values ≥0.10 used as a threshold to determine imbalance.24 Matching was performed using the PSMATCH procedure in SAS 9.4.25
Statistical AnalysesOutcomes were compared in the matched cohorts using generalized estimating equations. For binary outcomes, including process of care measures, absolute risk differences and relative risks with 95% confidence intervals (CIs) were estimated using binomial regression models with identity and log links, respectively. HbA1C level was analyzed as a continuous outcome using the measurement closest to 1 year of follow-up for patients, with a follow-up measurement available in the diabetic CKD subgroup using generalized linear models. Hospitalization and ED visit rates were modeled using count outcomes since multiple events per person were possible. Rate differences (RDs) and relative rates with 95% CIs were estimated using negative binomial regression models to account for overdispersion. All-cause mortality and kidney failure were handled as binary outcomes, and incidence RDs and relative rates with 95% CIs were estimated using Poisson regression models. All models used robust (sandwich) variance estimators to account for correlation between the matched pairs.26
All analyses were performed on the full propensity score–matched cohorts, as well as stratified by diabetic CKD versus nondiabetic CKD status. Interaction terms between diabetic status and the treatment exposure groups were included in each regression model to test for effect modification by diabetic versus nondiabetic CKD. A sensitivity analysis was performed where the outcome models in the matched cohorts were adjusted for the number of follow-up visits in a year with a nurse practitioner, primary care physician, or nephrologist in each patient to assess whether greater intensity of follow-up accounted for difference in outcomes. All statistical analyses were conducted using SAS version 9.4 (SAS Institute Inc.).27
The Conjoint Health Research Ethics Board of the University of Calgary approved the study and granted waiver of patient consent.
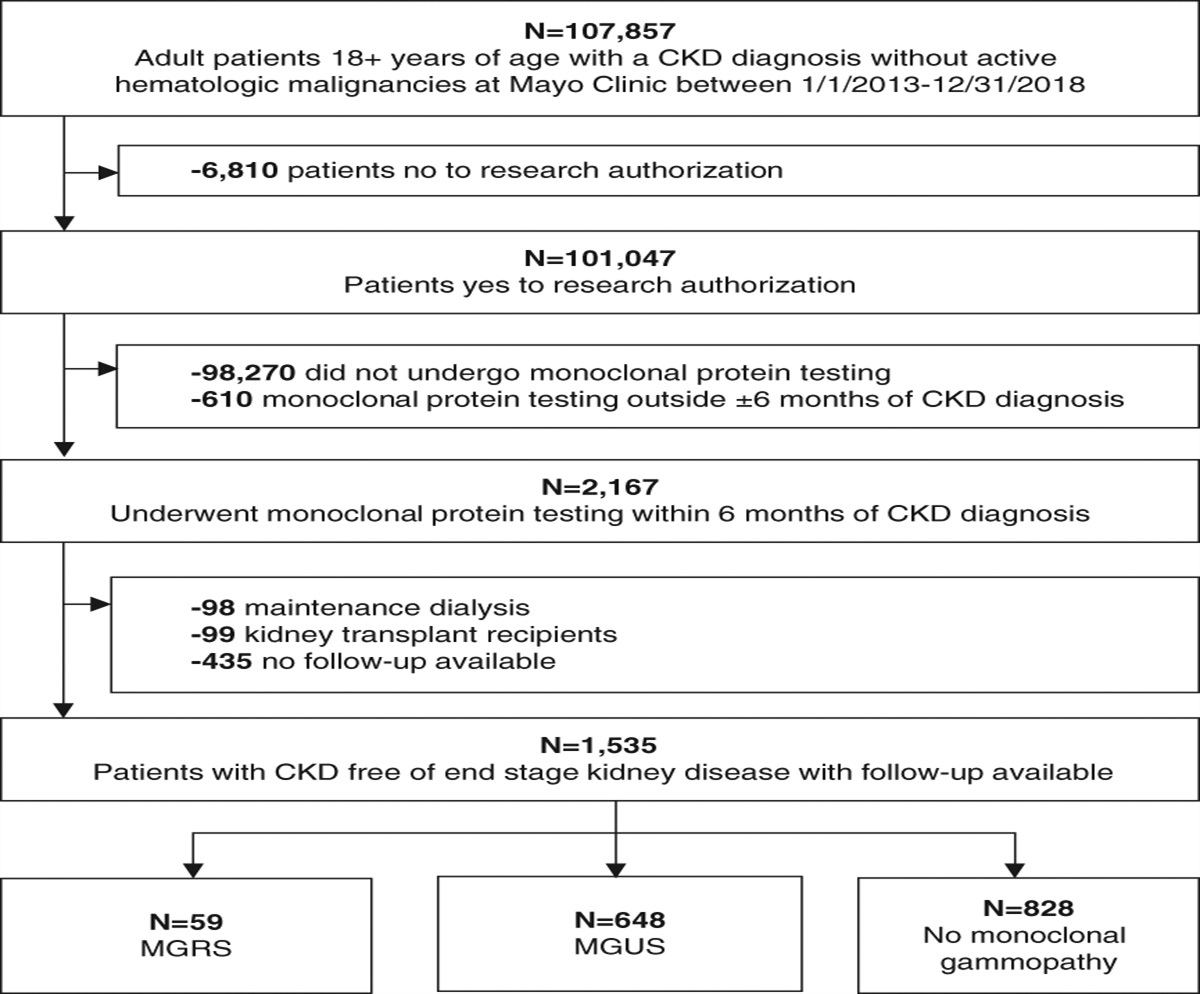
Results Cohort Formation and Baseline CharacteristicsBetween April 1, 2009, and November 1, 2017, the study inclusion criteria were met by 969 patients in the nurse practitioner clinic group, 67,938 patients in the primary care group, and 13,079 patients in the nephrologist care group (Figure 1
留言 (0)