
Remember me


The advantage of a multiparametric approach to breast cancer imaging derives from the complementary contributions of various parameters from different imaging techniques. The strength of different imaging sequences or modalities is that they capture different features of breast cancer. Breast magnetic resonance imaging (MRI) is the most sensitive imaging modality for detecting and diagnosing breast cancer. The key sequence used for breast MRI is dynamic contrast-enhanced (DCE) MRI, which visualizes cancer with high sensitivity because of the vascularity and permeability of lesions. The American College of Radiology Breast Imaging-Reporting and Data System (BI-RADS) proposes that breast MRI is interpreted based on morphologic and kinetic information.1 Information concerning the microvascular network, or microcirculation, can be extracted from kinetic curves of signal change on DCE-MRI. This information can be classified according to the curve pattern or measured semiquantitatively or quantitatively.2 Recently, ultrafast (UF) DCE-MRI has become clinically feasible, leading to the proposal of new kinetic parameters that may serve as biomarkers for tumor diagnosis and biology.3–11
Another key sequence for breast MRI is diffusion-weighted imaging (DWI). Diffusion-weighted imaging enables identification of cancer as an area of hindered or restricted water diffusion.12 Advanced DWI techniques, including intravoxel incoherent motion (IVIM), diffusion kurtosis imaging (DKI), and time-dependent diffusion MRI, are associated with tissue microperfusion and microstructure13-16 and provide new ways of evaluating tissues at the microscale. T2-weighted imaging (T2WI) reflects the percentage of water in tissue and thus reflects peritumoral edema, which is linked to tumor aggressiveness.17
Nuclear medicine techniques, in particular 18F-fluorodeoxyglucose (FDG) positron emission tomography (PET), are alternative tools for evaluating breast cancer from a metabolic perspective. Until recently, the relatively low spatial resolution of PET imaging was a problem when examining primary breast lesions; however, the emergence of new imaging modalities, including breast-specific positron imaging systems and PET/MRI hybrid machines, has expanded the use of nuclear medicine in breast cancer. For example, breast-specific positron imaging systems (or dedicated breast PET), which have much higher spatial resolution than standard whole-body systems, can delineate breast cancer as well as MRI.18 Because the treatment and management of breast cancer increasingly depends on the cancer subtype, receptor-specific imaging, which is enabled by new tracers, is becoming more important.19
Multiparametric imaging involves combining any of the image-derived information mentioned previoulsy.20 Attempts are being made to identify the optimal combination of multiple parameters, with the use of radiomics and deep learning as auxiliary tools. With the abundant information provided by multiparametric imaging, researchers are trying to identify more complex characteristics of breast cancer, including proliferation, vascularity, subtype, and even the immune environment, all of which are essential aspects of personalized breast cancer treatment. In this article, we review individual parameters in the context of breast cancer imaging, providing a technical and theoretical background for these parameters. The value of multiparametric approaches in the clinical context of breast cancer is also discussed, with an emphasis on MRI and nuclear medicine.
DEFINITION OF MULTIPARAMETRIC IMAGINGWithin the field of breast cancer, multiparametric imaging describes the use of multiple imaging parameters or modalities to improve diagnosis, presurgical evaluation, and treatment monitoring. In MRI, multiparametric imaging often involves combining information from different types of imaging sequences such as T2WI, T1-weighted imaging, DCE-MRI, and DWI. The combination used depends on the anatomical sites being investigated and the purposes of the imaging. The concept of multiparametric imaging has become popular in most of the diagnostic MRI. For example, the word “multiparametric MRI” has been used in the field of prostate cancer.21 Another example is cardiac MRI. Myocardial tissue characterization by T1 and T2 mapping is used for evaluating cardiomyopathies or cardiac sarcoidosis.22,23
The purpose of multiparametric imaging is to improve diagnostic accuracy by assessing lesions from different aspects. For example, DCE-MRI reflects blood flow in the lesion and leakage of contrast agent into the tissue, whereas DWI reflects the lesion's cell density. When these 2 sequences are combined, they can pick up breast cancers with sparse cellular components or poorly enhanced cancers with high cellularity.
Multiple parameters can be combined quantitatively to construct a model, or alternatively, information from different imaging modalities and sequences can be fused or superimposed for visual assessment. Techniques such as nonrigid image registration are useful in the case of displaced or distorted images.24
SUBTYPE, ANGIOGENESIS, METABOLISM, AND TUMOR MICROENVIRONMENT RELEVANT TO MULTIPARAMETRIC IMAGINGThe target of multiparametric imaging in breast cancer needs to be summarized. Along with the diagnosis of malignancy, the tumor subtype, angiogenesis, metabolism, and tumor microenvironments (TMEs) are important concepts. Intrinsic subtypes that were originally determined by gene expression profiling25 are associated with the biological features of breast cancer. Intrinsic subtypes based on estrogen receptors (ERs), progesterone receptors, human epidermal growth factor 2 (HER2), and Ki-67 index are now widely determined in clinical settings.26 Although such immunohistochemical subtypes are determined by histopathological sampling, efforts have been made to predict different subtypes on imaging, often using a multiparametric approach.10,27–30
Angiogenesis and metabolism are the 2 hallmarks of cancer that can be evaluated by contrast-enhanced MRI and 18F-FDG PET.31 Proliferation can be assessed by DWI,20 and the increase in metabolism that precedes proliferation can be used as an early marker of tumor growth.
The TME plays a vital role in tumor formation and progression. Among several key cell types in the TME, tumor-infiltrating lymphocytes (TILs) have attracted attention as predictors of the response to cancer immunotherapy, such as that involving pembrolizumab and atezolizumab. Cancer-associated fibroblasts (CAFs) reduce apoptosis and improve the proliferation, migration, and viability of cancer cells.32 Cancer-associated fibroblasts are associated with unfavorable prognoses in patients with node-negative hormone receptor-positive/HER2-negative breast cancer.33 Erratic vascular networks of tumor-associated vessels provide inefficient perfusion,34 causing hypoxia.
MECHANISMS OF CANCER IMAGING Dynamic Contrast-Enhanced Magnetic Resonance ImagingDynamic contrast-enhanced MRI is an imaging tool that assesses vascularity through the intravenous injection of a bolus of gadolinium-based contrast agent. Information on enhancement at a minimum of 3 time points is needed to draw a time-intensity curve and perform qualitative analysis.1 The temporal resolution of DCE is normally in the order of 1–2 minutes, to obtain images with appropriate spatial resolution (maximum pixel size of 1 mm).35 Fast enhancement in the initial phase and washout in the delayed phase is the kinetic pattern most characteristic of malignancy. However, there are some overlaps in pattern among different lesions types, such as benign lesions demonstrating a washout pattern (intraductal papilloma) and malignant lesions with a slow enhancement pattern (ductal carcinoma in situ, invasive lobular carcinoma, and mucinous carcinoma).
The term “vascularity” encompasses both vascular and perfusion factors. In the case of breast cancers, tumor-related vessels that have been stimulated to proliferate by angiogenic factors may appear thick or irregular in shape. When contrast agent reaches the capillaries of the tumor, it starts to leak out into the surrounding tissue. The leakiness of the tissue and vascular wall results in accumulation of the contrast agent in the tumor.
An early model of the movement of contrast agent, the Tofts model, was proposed in 1999.36 This model assumes that the contrast agent is exchangeable between the blood plasma and interstitial fluid compartments of the tissue, and that it follows first-order kinetics. The Tofts model uses the concentrations of the contrast agent in the tissue over time to estimate various parameters and provides key parameters for characterizing tissue perfusion and permeability, the most commonly used of which is the transfer constant Ktrans, which represents the rate of transfer of the contrast agent from the blood plasma into the extravascular extracellular space (EES). In other words, it is the rate of influx of a contrast agent into the ESS. Ktrans is the product of tissue blood flow and the permeability surface area37; that is, it depends on perfusion and permeability. Some studies indicated the clinical significance of Ktrans, finding it to be associated with microvessel density and tumor size, whereas other studies reported mixed results.38 Kep denotes the rate of reflux of contrast agent from the EES to plasma. Another key parameter is Ve, defined as the fractional volume of EES relative to the tissue and interstitial volumes, and it is the space in which contrast agent accumulates after crossing the endothelial barrier.2 Notably, estimation of parameters with the Tofts model requires detailed time-intensity information over a 5-minute acquisition, which is rarely feasible in a clinical setting.
Ultrafast DCE-MRIUltrafast DCE-MRI of the breast, which was proposed in 2014 by Mann et al,39 is a new means of evaluating the vascularity of breast cancer. The UF-DCE-MRI focuses on the very early phase after administration of a contrast agent, using a temporal resolution of several seconds that is enabled by fast acquisition techniques, including view-sharing and compressed sensing (CS).5 View-sharing shares phase-encoded views from one image to the next in the reconstruction of a time series. Central k-space associated with contrast is frequently sampled for faster updates. View-sharing techniques include time-resolved angiography with interleaved stochastic trajectories,40 K-space–weighted imaging contrast,41 and differential subsampling with Cartesian ordering.42 In CS techniques, images with a sparse representation can be recovered from randomly undersampled k-space data. The use of a nonlinear recovery scheme is required.43 View-sharing is more commonly used than CS, although view-sharing may experience blurring.
The diagnostic value of kinetic parameters derived from UF-DCE-MRI has been actively investigated.4,5,9–11,44–49 Kinetic parameters obtained from UF-DCE-MRI include maximum slope (MS), representing the steepness of the upslope of the time-intensity curve, and time to enhancement (TTE) and bolus arrival time (BAT), which indicate when the breast lesion starts to enhance (Fig. 1). The MS of breast cancer is larger than that of benign lesions, whereas TTE and BAT of breast cancer are shorter. These kinetic parameters were shown to have comparable diagnostic capabilities in the differentiation of benign and malignant breast lesions, with high interreader agreement, indicating their potential to replace kinetic parameters obtained from conventional DCE-MRI with those derived from sequences with a much shorter scan time (less than 100 seconds after contrast injection).5 Both MS and TTE demonstrated excellent interreader agreement4,10,50 with intraclass correlation coefficient of 0.94–0.99 and 0.85–0.88 for MS and TTE, respectively.
Parameters extracted from an empiric mathematical model have also been used,7 and these are explained in a recent review.5 A recently published study examining the value of UF-DCE-MRI in predicting treatment response concluded that the most useful parameter is “wash-in slope,” which is defined as the peak of enhancement (SImax) divided by the time to peak intensity.51,52 Such UF-DCE-MRI–derived kinetic parameters are considered to reflect the underlying pathophysiology of breast lesions. The early leakage of contrast agent from vessels to the interstitium can be associated with larger MS, whereas the increased vascular shunt in tumor-associated vessels may be associated with a shorter TTE or BAT.5 Maps of these new parameters can reveal intratumor heterogeneity, which may not be seen on conventional DCE-MRI (Fig. 2).
 FIGURE 1: Schema for kinetic parameters used in UF-DCE-MRI. There are mainly 4 kinds of kinetic parameters: slope, time, interval, and modeling. Refer to the text for detailed definitions and explanations of each parameter. Reprints with permission from Figure 6 of Kataoka et al5 (MRMS 2022, Creative Commons Attribution, Non Commercial, No Derivatives International License. Copyright 2022 Japanese Society for Magnetic Resonance in Medicine).
In addition to differentiating malignant from benign breast lesions, these new kinetic parameters are associated with receptor status, intrinsic subtype, and other prognostic markers of breast cancer. Invasive breast cancer shows a larger MS and a shorter TTE or BAT than in situ carcinoma5,48; the shorter TTE was shown to be associated with upgrading of in situ cancer to invasive cancer.52,53 Similarly, invasive breast cancer with poor histological prognostic factors (ie, histological grade 3, hormone receptor (HR) negativity, triple negative subtype, and Ki-67 positivity), except for human epidermal grow factor receptor 2 (HER2) status, shows significantly larger MS and shorter TTE.5,10,49
Another feature of UF-DCE-MRI is visualization of feeding arteries and drainage veins, which is a benefit of the high temporal resolution and reasonable spatial resolution. The increased flow rate of tumor-associated vessels is quantified as the arteriovenous interval,53 and a short arteriovenous interval can be an indicator of malignancy.4,53 In addition, quantification of the number of vessels has been investigated, and vessel count, vessel length, and the number of vessel-crossing points on the maximum intensity projection image have been used as markers for particular subtypes and proliferation.54,55
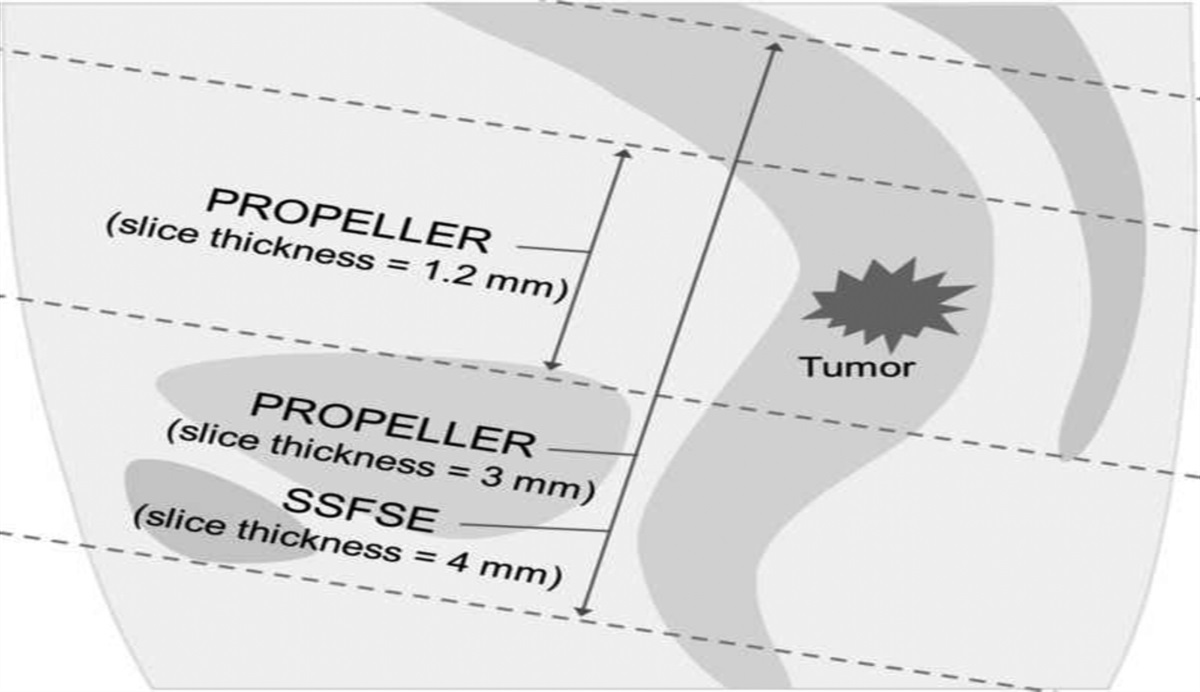
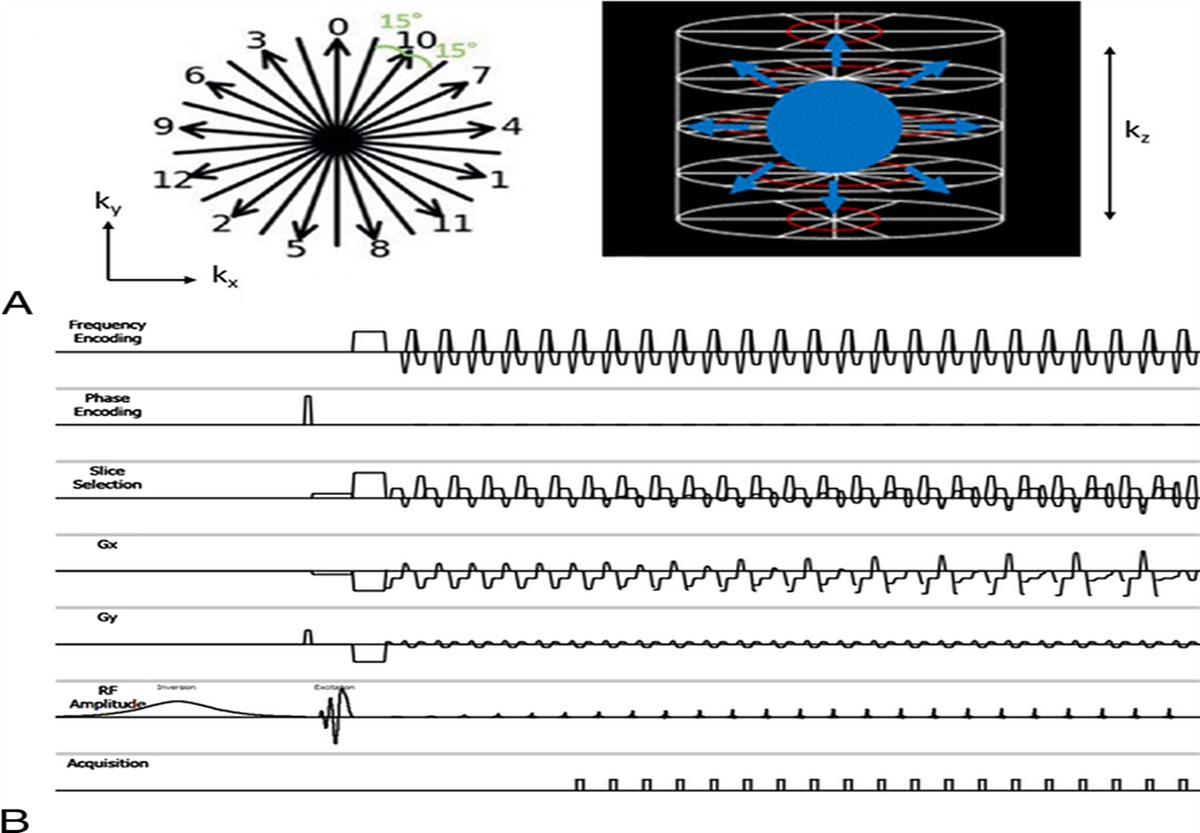
Diffusion-Weighted ImagingDiffusion-weighted imaging visualizes the diffusion of water molecules in biological tissues. Breast cancer is identified as an area of hindered or restricted water diffusion. DWI reflects tumor cell density and microstructure or microvasculature without using an exogenous contrast agent,12 and is increasingly being included in routine breast MRI protocols. Single-shot echo planar imaging is a widely used sequence for DWI, but it is prone to geometric distortion. To overcome this weakness, readout-segmented echo planar imaging has been suggested.56 By dividing k-space into segments along the readout direction, the echo time is reduced, resulting in less distortion.57–59 Reduced field of view DWI60 and simultaneous multislice DWI61 were also investigated to obtain DWI with improved image quality and less distortion.
The apparent diffusion coefficient (ADC) of a breast lesion is used as a quantitative parameter for diagnosis and prediction of subtype, proliferation, and therapeutic response.12 ADC is related to the cell density, with the value being lower in breast malignancies because of their increased cellularity. ADC values and information extracted from ADC mapping are frequently a component of multiparametric MRI, in combination with contrast-enhanced kinetic parameters, because they are considered complementary and are helpful in avoiding unnecessary biopsies.50,62
More advanced modeling methods and parameters have been proposed to fully exploit the information from DWI when evaluating breast cancer characteristics. Advanced DWI methods include IVIM, DKI from non-Gaussian DWI15,16,63 (Fig. 2), and diffusion tensor imaging (DTI).59 IVIM MRI uses signal from low b value images and reflects microcapillary perfusion, demonstrated as the flowing blood volume fraction (f or fIVIM), in addition to the true diffusion coefficient, D. Malignant breast tumors have lower D (<1.5 × 10⁻³ mm2/s) and higher f (approximately 10%) than nonmalignant tumors.13 In contrast, diffusion kurtosis quantifies the deviation from Gaussian diffusion observed at high b values.15,16 High K values (>0.7) are generally found in malignant breast lesions, which can be explained by the increased microstructural complexity in cancer tissue. Using carefully planned scanning and analysis, IVIM, ADC, and kurtosis can be obtained from a single series of DWI acquisitions with multiple b values. Each of these parameters provides different information, as demonstrated by the 3 parametric maps shown in Figure 3.
 FIGURE 2:
 Invasive carcinoma no special type (NST) in a 57-year-old woman. A, The early phase of dynamic contrast-enhanced image shows 25-mm oval shape mass with irregular margin and heterogeneous enhancement. B, The DCE image is fused with maximum slope (MS) maps. This may seem homogeneous on DCE-MRI, but the fusion image revealed the wide local variations in the value of MS, showing intratumoral heterogeneous tissue perfusion that may not be revealed by biopsy.
 FIGURE 3: Invasive ductal carcinoma in a 61-year-old woman. A, Anatomical contrast-enhanced image. B, The fIVIM map. C, The ADC0 map. D, The K map. The white rectangle in A shows the area covered by the parametric maps. The high fIVIM fraction area at the periphery of the tumor in B matches the enhancing lesion very well in A. The lesion center has low perfusion (suggesting necrosis). An area on the left part of the tumor exhibits a lowADC0 with high K value, suggesting high cellularity (viable malignant component), whereas the central part has a high ADC0 and low K, suggesting lower cellularity (possible necrosis). Reprints with permission from Figure 1 of Iima et al.15 fIVIM indicates flowing blood volume fraction in IVIM
 FIGURE 4:
 Invasive carcinoma NST in a 45-year-old woman. A, Right sagittal view of dedicated breast PET (dbPET) shows mass uptake with irregular shape. B, Sagittal reconstructed view of the early phase of breast MRI shows 12-mm mass with lobulated shape and spiculated margin suggestive of malignancy, which is more obvious than on dbPET. C, Fusion of dbPET and MRI confirms that the mass uptake corresponds to the mass on breast MRI. There are a few foci in the breast that are not associated with significant FDG uptake. A bar at the left side of C means color scale of SUV (0–4.00).
The applications of IVIM and non-Gaussian DWI in breast lesions encompass the differentiation between malignancy and benignity, correlation with prognostic factors, and prediction of treatment responses.13 A meta-analysis showed that D obtained from IVIM exhibited superior diagnostic performance to ADC in the differentiation of malignant from benign breast tumors.64
Diffusion tensor imaging captures tissue anisotropy and serves as a valuable highly sensitive and specific tool for differentiating between benign and malignant breast lesions.13,65 However, the use of fractional anisotropy to distinguish between them is controversial,66 and it is important to consider that noise can potentially affect the assessment of anisotropy.67
Recent technical developments (especially gradient hardware) have enabled researchers to obtain images with various diffusion times, ranging from short diffusion times using oscillating gradient spin echo to long diffusion times with techniques such as stimulated echo DTI.68 Changes in ADC values with different diffusion times have been reported in malignant breast lesions and have been associated with molecular biomarkers including the Ki-67 index.69 The diffusion time is usually not provided on the scanner console by vendors; however, advances in time-dependent diffusion MRI highlight the importance of being able to check diffusion times on all scanners.
Despite the progress in advanced DWI techniques and their merits, it is important to acknowledge that these imaging methods often require multiple b values or multidirectional image acquisitions, which can result in longer scan times than are required for routine DWI. These longer scan times may limit the widespread use of advanced DWI techniques in clinical practice, emphasizing the need to develop protocols that incorporate shorter scan times. Moreover, the variability in results arising from differences among analysis techniques, acquisition parameters, field strengths, and vendors poses substantial challenges within the realm of advanced DWI techniques, including in breast imaging. Standardizing and optimizing breast DWI protocols stand as pivotal strategies to tackle these discrepancies, with the aim of establishing parameter ranges that can be universally implemented across a wide variety of clinical scanners.70
T2-Weighted ImagingT2-weighted imaging, a conventional MRI sequence, reflects the water content of tissues. Clinically, T2WI is useful in the diagnosis of breast lesions showing high signal intensity, including cysts, fibroadenomas, phyllodes tumors, and mucinous carcinomas. In addition, focal breast edema, defined as water-like high signal intensity on T2-weighted MRI, is associated with aggressive histology and a poor prognosis.17,71 Focal edema can be divided into 3 different types: peritumoral edema, prepectoral edema, and subcutaneous edema. Peritumoral edema can be explained by the increased vascular permeability related to tumor-associated vessels and the release of cytokines. Peritumoral edema after neoadjuvant chemotherapy is associated with worse distant metastasis-free and overall survival in patients with luminal breast cancer.72 Prepectoral and subcutaneous edemas are associated with lymphovascular invasion.17 Breast edema has been classified using 4-tier breast edema scores: 1, no edema; 2, peritumoral edema; 3, prepectoral edema; and 4, subcutaneous edema.73 In contrast to cardiac MRI, quantitative T2 mapping has not been clinically implemented because of the long scanning time required. Synthetic MRI, allowing generation of T1 and T2 maps within a few minutes, may be a promising tool for obtaining T2-based information.74
MR SpectroscopyThe total choline (tCho) that can be evaluated by proton MR spectroscopy (1H-MRS) is elevated in neoplastic tissues. Elevated tCho is hypothesized to be an indicator of increased cellular proliferation.75 The tCho peak is used as a marker of malignancy, and its early reduction during chemotherapy precedes morphological changes because this parameter captures altered intracellular metabolism.75,76 A meta-analysis demonstrated pooled sensitivity and specificity of 73% and 88%, respectively, for 1H-MRS in diagnosing breast malignancy from benign lesions.77 However, the use of 1H-MRS has been limited to research because of the requirement for a specially designed sequence with a relatively long acquisition time, frequent low-quality spectra, and difficulties in standardization and quantification.78 Its use as a component of multiparametric MRI can improve diagnostic accuracy,79 help to downgrade suspicious lesions, and stratify the risk of lymph node metastases.80
Positron Emission Tomography ImagingAs a component of multiparametric imaging, PET imaging plays a unique role by providing functional or molecular imaging. The radiotracers used in PET imaging are incorporated into the cancer cells or bind to receptors on the cell surface or inside it, whereas contrast agents, which come through vessels and leak into the interstitium, never penetrate the cells. 18F-FDG PET is widely used as an indicator of glucose metabolism, and FDG uptake is therefore high in metabolically active cells such as proliferating cancer cells. However, increased uptake can also be caused by inflammation.
The development of breast-specific positron imaging systems has permitted improved spatial resolution (full width at half maximum of lower than 1.5 mm)80,81 and has changed the use of PET in breast cancer diagnosis, enabling detection of smaller breast lesions.82 The morphology of these lesions can also be evaluated to some extent, and a BI-RADS MRI-like lexicon enabling description of the background breast uptake and lesion uptake has been suggested.83 The extent of FDG-avid tumors can be traced on breast-specific positron imaging systems, and breast cancers showing rim uptake on breast-specific positron imaging systems are more aggressive than cancers without rim uptake.18
There are 2 types of breast-specific positron imaging systems. One is the “opposite type,” also called positron emission mammography (PEM). Similar to mammography, each breast is placed and compressed between 2 opposing parallel planar detectors. The other is the ring type, often referred to as dedicated breast PET (dbPET). In the prone position, each breast is placed into a hole-like detector for scanning, and full 3-dimensional images are acquired. The ability of PEM to detect additional ipsilateral lesions in patients with known breast cancer was investigated, and the authors concluded that PEM has lower sensitivity (85%) and higher specificity (74%) than MRI (98% and 48%, respectively), and that it is complementary to MRI for defining the extent of disease preoperatively.83–85 A fusion image of ring-type dbPET with MRI reveals the similarities and differences in information provided by these key imaging modalities (Fig. 4). Breast-specific positron imaging systems in combination with whole-body PET/CT can be used for opportunistic screening86 and for assessing response to treatment.87
Beyond 18F-FDG, several new radiotracers targeting more specific receptors have been developed, and these are gradually being introduced into clinical settings. FES, a derivative of estrogen, binds to cells with ER expression19 and has been Food and Drug Administration–approved. FES is used to both search for metastatic breast cancer and to identify the presence of ERs, with both being important for treatment planning. A feasibility study that included 6 patients with ER-positive breast cancer demonstrated the potential clinical utility of FES dbPET for characterizing primary ER-positive breast cancer, aiding in treatment selection, and assessing therapy response.88 Another radiotracer, 89Zr-trastuzumab, is targeted to overexpression of HER2 receptor.89 Such receptor-specific radiotracers are particularly useful for determining the indications for endocrine or anti-HER2 therapy. However, the use of each tracer requires a separate PET examination, which raises concerns about the time, cost, and added radiation exposure in clinical applications. However, future studies combining these new tracers with dedicated breast PET devices may uncover crucial insights into local tumor heterogeneity and responses to neoadjuvant therapy.
Table 1 lists the parameters derived from breast MRI and PET (Table 1).
TABLE 1 - Parameters Derived From MRI and PET Parameter (Unit) Definition Clinical Significance Qualitative/Semiquantitative/Quantitative Interreader Agreement (ICC Unless Stated Otherwise) Typical Value in Breast Cancer and Other Comments DCE-MRI (conventional) Washout Decrease of SI from peak enhancement in the delayed phases (>10% drop) Part of BI-RADS MRI Qualitative κ = 0.86–0.8890 Suggestive of malignancy DCE-MRI (Tofts model) Ktrans, /min The rate of contrast agent transfer from the blood plasma into the EES Reflects perfusion and permeability Quantitative 0.9691*Data range from systematic review is used.
MRI, magnetic resonance imaging; EES, extravascular extracellular space; DCE-MRI, dynamic contrast-enhanced MRI; UF-DCE-MRI, ultrafast dynamic contrast-enhanced MRI; IVIM, intravascular incoherent motion; DKI, diffusion kurtosis imaging; ICC, intraclass correlation coefficient; CCC, concordance correlation coefficient; BAT, bolus arrival time; MS, maximum slope; TTE, time to enhance; WIS, wash-in slope; ADC, apparent diffusion coefficient; AVI, time interval between arterial and venous visualization; D*, pseudodiffusion coefficient; f, fraction of flowing blood; K, kurtosis; MD, mean diffusivity; FA, fractional anisotropy; BI-RADS, Breast Imaging-Reporting and Data System.
Reliability and reproducibility of these parameters, along with typical value for breast cancer, are extracted from the literatures4,9,11,48,49,51,63–65,90–102 and added to the new columns at the right end of the Table 1. There are some parameters showing a large range of values among different studies. Ktrans and MS showed excellent interreader agreement throughout several studies.
Multiparametric Approaches to Breast Cancer: Recent AdvancesMultiparametric approaches were initially used for differentiating malignant from benign breast lesions. However, multiparametric data are now also used to tackle more complex tasks such as predicting subtypes and treatment response after neoadjuvant treatment. We have summarized selected recent research investigating the prediction of subtypes
Comments (0)