
Remember me


HIV invades the brain in acute infection and sets the stage for inflammatory responses that are believed to contribute to neurocognitive impairment and neuronal injury. Prior to advances in combination antiretroviral therapy (cART), approximately 25% of people with HIV (PWH) were diagnosed with HIV-associated dementia (HAD). In the cART era, the frequency of HAD declined to 5%, yet neurocognitive impairment is still reported in 25–50% of PWH [1–3]. The extent of HIV-associated neurocognitive impairment may or may not interfere with activities of daily living and may be revealed when an individual exhibits neurocognitive performance that is one standard deviation below the mean in a minimum of two cognitive domain functions [4]. Although the mechanism(s) that drive or contribute to neurocognitive impairment is not entirely clear in the cART era, asymptomatic HIV-associated neurocognitive disorder (HAND) increases the risk for neurocognitive decline [5] and persistent inflammation in the brain is still prevalent [4].
CD8+ T cells are found in the brains of PWH and in nonhuman primate models of HIV [6–8]. A highly activated and MHC-1-restricted population subset of CD8+ T cells express CD4+ dimly in comparison to CD4+ T cells and CD8+ similarly to CD4−CD8+ T cells and, as such, are denoted as CD4dimCD8bright T cells [9]. CD4dimCD8bright T cells constitute approximately 3–5% of total CD8+ T cells and 1–3% of all peripheral blood lymphocytes. They are also enriched in the periphery of HIV long-term nonprogessors [9]. They are a genuine, mature T-cell population, which has an αβ T-cell receptor and αβ CD8 molecule [12]. In murine models, CD4+ expression is induced on CD8+ T cells to generate this phenotype in a Wnt signaling-dependent manner [10]. Interestingly, CD8+ T cells injected into mouse brains give rise to the CD4dimCD8bright T-cell phenotype through the rich Wnt environment in the brain [11]. In these animals, CD4dimCD8bright T cells, not CD4−CD8+ T cells, also controlled HIV load in the brain [11]. Recently, CD4dimCD8bright T cells were shown to be neuroinvasive and harbor HIV, as demonstrated in humanized mice [12]. Together, these studies suggest a potential role for CD4dimCD8bright T cells in HIV control and anti-inflammatory responses. In this study, we assessed the association between CD4dimCD8bright T cells, inflammatory markers in the cerebrospinal fluid (CSF) and peripheral blood, and neurocognitive performance of PWH prior to and following 24 weeks of cART.
Materials and methods Ethical statementThe RV304/SEARCH013 study (NCT01397669) in Bangkok, Thailand enrolls PWH in chronic infection as well as people without HIV (PWOH). Informed consent was obtained from all participants prior to inclusion in the study. The study was approved by the Chulalongkorn University and Walter Reed Army Institute of Research institutional review boards.
This study involves the use of longitudinal peripheral blood and CSF specimen and neuropsychological testing data from participants in the RV304/SEARCH013 study collected at week 0 (pre-ART) and at 24 weeks after ART initiation. Demographic and clinical factors relevant to HIV neuropathogenesis including age, gender, handedness, years of education, race/ethnicity, history of substance (illicit drug, tobacco, alcohol) use, likely route of HIV exposure, nadir and current CD4+, HIV RNA levels in blood and CSF, major psychiatric conditions including depression, and history of head trauma or prior/current neurological disease were also collected.
HIV serology and HIV nucleic acid testingHIV serology was performed using standard algorithm for HIV testing. Plasma and CSF HIV viral load were assayed using nucleic acid amplification methods, using the Roche COBAS TaqMan HIV-1 V2.0 with lower limit of quantification of 20 copies/ml for plasma and 80 copies/ml for CSF.
Flow cytometryDue to the low cell number in CSF, total T cells were first polyclonally expanded for 2 weeks in 96 well V-bottom plates as previously described [13]. Briefly, cells were stimulated with 5 Biological Response Modifier Program (BRMP)/ml of natural human IL-2 (ZeptoMetrix Corporation, Buffalo, New York, USA), 10 ng/ml recombinant human IL-2 (rhIL-2; Miltenyi Biotech, Darmstadt, Germany), and 1 μg/μl phytohemagglutinin-L (Millipore-Sigma, Darmstadt, Germany) in T-cell media containing RPMI 1640 (Corning, Corning, New York, USA), 8% human serum (Access Biological LLC, Vista, California, USA), penicillin/streptomycin (Quality Biological, Gaithersburg, Maryland, USA), and ARVs (100 nmol/l Efavirenz, 180 nmol/l Zidovudine, and 200 nmol/l Raltegravir). Irradiated peripheral blood mononuclear cells (PBMCs) from three different donors and Epstein–Barr virus-immortalized B cells were used as feeder cells, and fresh T-cell media containing rhIL-2 and antiretroviral drugs were added twice weekly. Expanded CSF cells or freshly thawed PBMCs were stained with Live/Dead Aqua (Thermo Fisher Scientific, Waltham, Massachusetts, USA) for 10 min at room temperature and then incubated with antibodies targeting surface proteins for 20 min at 4 °C with AF700-labeled anti-CD3 (clone UCHT1), BV605-labeled anti-CD4 (Biolegend, clone OKT4, San Diego, California, USA), and BUV496-labeled anti-CD8 (BD Biosciences, clone RPA-T8). Cells were analyzed on a BD FACSAria (Becton Dickinson (BD) Biosciences, Franklin Lakes, New Jersey, USA), and data was analyzed with FlowJo (FlowJo, LLC, Ashland, Oregon, USA). Lymphocytes were gated on FSC-A and SSC-A, single cells gated on FSC-A and FSC-H, and live T cells gated on Aqua Live/Dead and CD3. CD4dimCD8bright T cells were gated based on CD4+ and CD8+ expression of CD4+CD8- and CD8−CD4+ T cells.
Soluble markers of immune activationLevels of inflammatory and immune activation markers in the CSF and plasma were determined using multiplex Luminex Milliplex MAP immunology panels (MilliporeSigma, Burlington, Massachusetts, USA) and singleplexenzyme-linked immunoassay (Genway Biotech, San Diego, California, USA). All assays were performed in accordance with manufacturers’ protocols. Plates were read on a Bio-Plex 3D reader (Bio-Rad, Hercules, California, USA).
Neuropsychological assessmentThe four-test battery measured fine motor speed and dexterity (nondominant hand Grooved Pegboard test; GPB; Lafayette Instrument Company, Lafayette, USA), psychomotor speed (Color Trails 1; CT1 and Trail Making A; Trails A; PAR, Inc., Lutz, USA) and executive functioning (Color Trails 2; CT2; PAR, Inc.). Raw scores were standardized to z scores using Thai normative data, which were averaged to create an overall neurocognitive performance z score (NPZ-4) score. Testing was completed by certified nurse-psychometrists. The procedure took 1 h. An NPZ-4 score less than −1 is indicative of neurocognitive impairment. The optional full neuropsychological assessment test battery is originally designed to minimize cultural bias and tested in Bangkok to be utilized in addition to the abridged neuropsychological test [14,15].
Statistical analysisStatistical analyses were performed in SAS version 9.4 (SAS Institute, Cary, North Carolina, USA). Briefly, paired differences between Week 0 and Week 24 for variables of interest were determined by Wilcoxon Signed-Rank Test (α = 0.05). Median paired differences and corresponding interquartile ranges of the differences were also reported. Spearman correlation coefficients were calculated for each soluble marker of interest with CD4dimCD8bright T cells or CD4−CD8+ T cells at week 0 and week 24. Given a small sample size, adjustments for multiple correlations were not performed. Instead, a Bootstrap analysis with 10 000 resamples was performed on each variable of interest with CD4dimCD8bright T cells or CD4−CD8+ T cells at week 0 and week 24. For each Bootstrap distribution, 2.5 and 97.5 percentiles were calculated and used as a 95% confidence interval (CI) for the Spearman bootstrap estimate [16]. Bootstrap intervals showing no overlap at rho = 0 (H0) was considered statistically significant (P < 0.05). Lastly, differences between week 0 and week 24 neurocognitive batteries were analyzed by Wilcoxon Rank-Sum test (for group medians and interquartile ranges). Participants who had reductions in composite neurocognitive scores were identified by subtracting week 0 and week 24 NPZ4 scores. Subsequent differences in soluble markers of inflammation at both week 0 and week 24 between those two population medians and interquartile ranges were analyzed by Wilcoxon Rank-Sum test. Graphs were made in Prism version 9.4.1 (GraphPad, San Diego, California, USA).
Data availabilityData is available upon request.
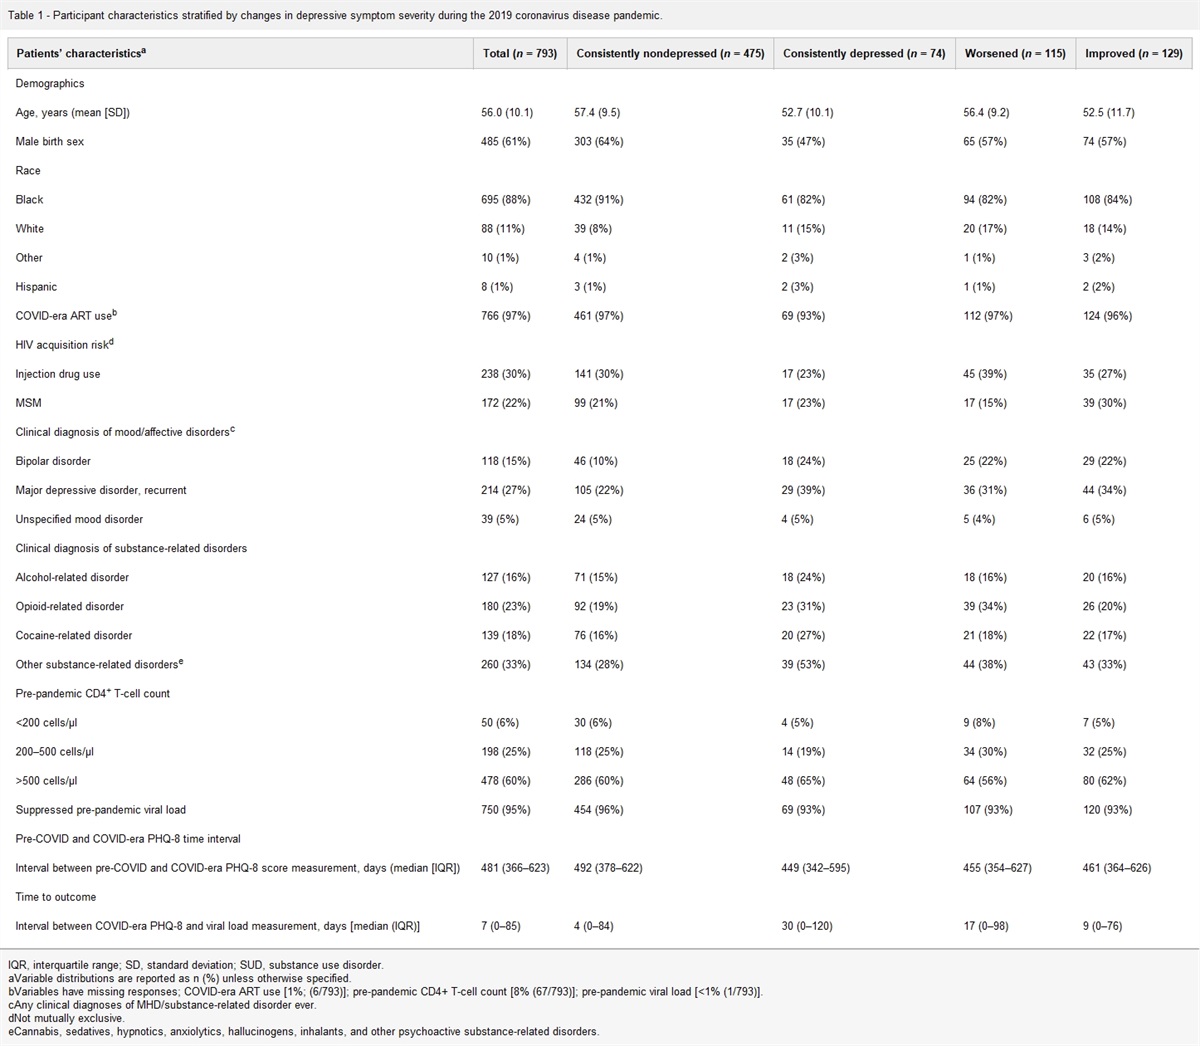
Results Demographic and clinical characteristic of study participantsFifteen ART-naive PWH were included in this study with a median age of 29 [interquartile range (IQR) 26–35] (Table 1). Fourteen participants were men, with the majority being MSM (N = 10, 66%). At week 0, the median plasma viral load was 4.82 log10 copies/ml (IQR 4.30–5.32), the median CSF viral load was 3.81 log10 copies/ml (IQR 2.48–4.50), the median CD4+ T-cell count was 333 cells/μl (IQR 204–433) and the median CD8+ T-cell count was 1070 cells/μl (IQR 816–1769) (Table 2). Participants were initiated on cART and assessed at week 24. All participants were on TDF/FTC/EFV, except two for which ARV regimen is missing. At week 24, four participants were lost to follow-up. After 24 weeks on cART, the absolute CD4+ cell count increased (P = 0.019), while the CD8+ cell count was unchanged (P = 0.330). Further, plasma viral load decreased (P = 0.001) and was undetectable in eight (73%) of the participants. In the CSF, the viral load was undetectable among all participants after cART initiation (Table 2). The median percentages of CD4dimCD8bright T cells in the blood and the CSF were not significantly different between week 0 and following 24 weeks of cART (P = 0.106 and P = 0.391, respectively). In contrast, the median percentage of CD4−CD8+ T cells significantly decreased in both the blood and the CSF (P = 0.001 and P = 0.049, respectively). Neurocognitive performance testing was performed at week 0 and week 24 to assess fine motor speed and dexterity, psychomotor speed, and executive functioning. No difference was found between week 0 and week 24 median NPZ-4 scores (P = 0.123) (Table 2).
Table 1 - Cohort characteristics at week 0 (N = 15). Baseline characteristics Median (IQR) Age (years) 29 (26–35) Gender [N (%)] Male 14 (93) Female 1 (7) Risk [N (%)] MSM 10 (66) Not MSM 5 (33)Select cohort characteristics including age (median, IQR), gender, and social risk factor are included. IQR, interquartile range.
Median paired differences for paired outcomes between week 0 and week 24 are reported for cytology, viral load, neuropsychological scores, and T-cell subtype. Wilcoxon Signed-Rank Test P values are reported for the median paired difference and corresponding interquartile ranges. IQR, interquartile range.
a25% and 75% quantile of 50% paired difference (median).
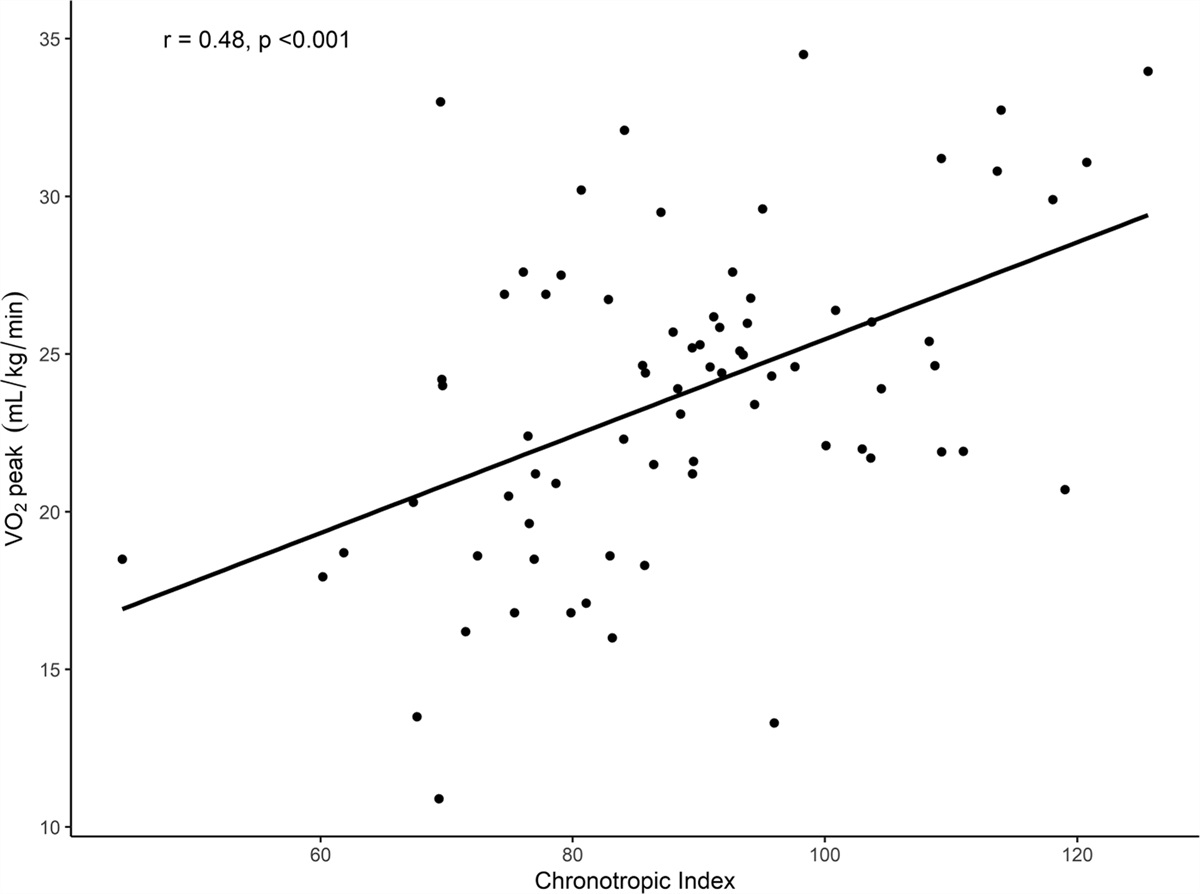
CSF neopterin is a biomarker of central nervous system (CNS) inflammation [17]. It has been found to be elevated in neuroinflammatory diseases and conditions, including HAND [18,19]. CSF CD4dimCD8bright T cells at week 0 (pre-ART) were significantly and inversely associated with week 0 CSF neopterin (Bootstrap r = −0.60, 95% CI −0.92 to −0.04) (Fig. 1a). Further, the percentage of blood CD4dimCD8bright T cells at week 0 was inversely and significantly correlated with MCP-1 (Bootstrap r = −0.61, 95% CI −0.89 to −0.06), IP-10 (Bootstrap r = −0.55, 95% CI −0.86 to −0.05), IL-8 (Bootstrap r = −0.75, 95% CI −0.94 to −0.30), IL-6 (Bootstrap r = −0.72, 95% CI −0.90 to −0.41), G-CSF (Bootstrap r = −0.63, 95% CI −0.87 to −0.07), and APRIL, a proliferation inducing cytokine also known as tumor necrosis factor ligand superfamily member 13 (TNFSF13) (Bootstrap r = −0.77, 95% CI −0.92 to −0.30) (Fig. 1b). Notably, positive and significant correlations were observed at week 0 between blood CD4dimCD8bright T cells and plasma RANTES (Bootstrap r = 0.57, 95% CI 0.14–0.81) and a metalloprotease, MMP1 (Bootstrap r = 0.65, 95% CI 0.15–0.90) (Fig. 1a). No correlations with CD4dimCD8bright T cells in the CSF were present after 24 weeks on cART. However, blood CD4dimCD8bright T cells were significantly and positively associated with IL-21 (Bootstrap r = 0.83, 95% CI 0.23–1.00) 24 weeks following cART initiation (Fig. 1b).
 Fig. 1:
 Correlations with CD4dimCD8bright T cells in cerebrospinal fluid and blood.
CD4−CD8+ T cells are positively associated with markers of both systemic inflammation and brain injuryWhile no significant association was noted between CSF CD4−CD8+ T cells and biomarkers of immune activation in the CSF at week 0 (Fig. 2a), CSF CD4−CD8+ T cells were significantly and positively associated with CSF S100β at week 24 (Bootstrap r = 0.77, 95% CI 0.28–1.00) (Fig. 2a). Further, blood CD4−CD8+ T cells at week 0 were significantly and positively associated with both plasma C-reactive protein (CRP) (Bootstrap r = 0.62, 95% CI 0.08–0.89) and B-cell-activating factor (BAFF) (Bootstrap r = 0.64, 95% CI 0.11–0.87) (Fig. 2b). There were no significant associations between blood CD4−CD8+ T cells and plasma markers of immune activation at week 24.
 Fig. 2:
 Correlations with CD4−CD8+ T cells in cerebrospinal fluid and blood.
DiscussionIn the era of cART, HIV-associated neuroinflammation still persists [4]. We assessed the relationship between CD4dimCD8bright and CD4−CD8+ T cells and markers of neuroinflammation in the CSF and blood of PWH, who initiated cART at study entry and were followed at 24 weeks post-cART. We performed bootstrap analysis with 10 000 resamples to better estimate the distribution of correlation coefficients without either large sample size or assumptions of normality. As a result, median bootstrap estimates are reported for each T-cell type and biomarker of inflammation with corresponding 95% CIs. All intervals not including rho = 0 are significant (P < 0.05 for H0: rho = 0).
We report a unique subset of CD8+ T cells termed CD4dimCD8bright T cells is negatively associated with some neuroinflammatory markers at week 0 prior to cART initiation, while CD4−CD8+ T cells are positively associated with some neuroinflammatory markers. Specifically, in the CSF, the frequency of CD4dimCD8bright T cells was negatively associated with neopterin, a marker of neuroinflammation [17]. Blood CD4dimCD8bright was negatively associated with MCP-1, IP-10, IL-8, IL-6, G-CSF, and APRIL. These chemokines/cytokines are associated with inflammatory responses, recruitment of immune cells to sites of injury, and early antiviral responses (e.g. IP-10).
Previous in-vitro and in-vivo studies demonstrated that CD4dimCD8bright T cells have anti-HIV responses [9,11]. In humans, peripheral CD4dimCD8bright T cells potently recognized MHC-I HIV tetramer and potently secreted polyfunctional cytokines and expressed CD107α, a marker of cytolytic activity, in response to HIV peptide challenge [9]. Further, animal studies [NOD/SCID/IL-2rcγ(-/-) mice reconstituted with human PBMCs] demonstrated that a higher frequency of brain CD4dimCD8bright T cell was negatively correlated with HIV gag mRNA transcripts in HIV-infected NSG-huPBMC brain [11]. A recent study demonstrated that CD4dimCD8bright T cells mediate HIV neuroinvasion [12]. Although we were unable to evaluate the percentage of CD4dimCD8bright T cells in relation to HIV load pre-ART initiation, as the viral set point is unknown among those chronically infected individuals, given the previous findings regarding the role of CD4dimCD8bright T cells in HIV immunity, it is likely that CD4dimCD8bright T cells contribute to lower HIV load and consequently lower markers of inflammation in the brain and the blood. We did find a negative trend between CD4dimCD8bright T cells and soluble CD30 in the CSF. CD30, in one study, was reported to be a surrogate marker of HIV infection in the CNS [20]. CD30 co-localizes with HIV RNA and DNA and is detected in the CSF of PWH under cART [20]. The trending association between CD4dimCD8bright T cells and CD30 may suggest that CD4dimCD8bright T cells are associated with HIV control in the brain, albeit, whether CD30 is a true marker of HIV infection in the CNS is still not clear [20].
CD4−CD8+ T cells did not inversely associate with neopterin levels in the CSF. However, they were associated with markers of inflammation, C-reactive proteins within the periphery, and brain injury (s100β) within the CSF [21]. Neither CD4dimCD8bright T cells nor CD4−CD8+ T cells were associated with neurocognitive performance, and this may be a reflection that the preinfection neurocognitive performance score of the participants was not known prior to initiation of cART, so if there was a change prestudy entry that change was not captured. This assessment is rather difficult to capture as participants would need to be evaluated at time of HIV seroconversion and followed up with neurocognitive testing pre-cART and post-cART.
Future studies with larger sample sizes are warranted to more confidently estimate effect sizes among reported neuro-biomarkers of inflammation and these T-cell subsets. Nonetheless, the contrast between CD4dimCD8bright T cells and CD4−CD8+ T cells relevant to the association with neuroinflammatory markers reported here suggest that CD4dimCD8bright T cells may be protective and anti-inflammatory in comparison to their single positive CD8+ T-cell counterpart. A greater appreciation of these CD8+ T-cell subsets in the context of HIV may inform a greater understanding of inflammatory responses among PWH in the era of cART and highlight potential means for therapeutic intervention to ameliorate or reduce persistent HIV-mediated inflammation.
AcknowledgementsWe thank the participants in this study for their time and support of research to benefit those living with HIV, and staff from the Thai Red Cross AIDS Research Centre, Chulalongkorn University and AFRIMS for their valuable contributions to this study. We are grateful to the Thai Government Pharmaceutical Organization (GPO), ViiV Healthcare, Gilead Sciences, and Merck for providing the antiretroviral medications for this study.
Author contributions: Y.A.A. and A.V. performed flow analyses with emphasis on CD4dimCD8bright T cells. T.S. summarized the data and performed all statistical analyses. C.S. performed experiments with emphasis on CD8+ T-cell population, J.M. analyzed data. S.S. designed the RV304/SEARCH013 study (NCT01397669) and C.S., N.R., N.P. coordinated the protocol. N.J., B.S., and S.J.K. performed soluble factor analysis. B.M.S., N.J., S.H.K., C.S., S.S. coordinated RV304. S.J.K. and D.C.H. checked statistical analyses and are part of SEARCH team. L.T. provided conceptual advice. L.A. designed the study, formulated the hypothesis, coordinated the multiteam collaborative study, checked the data, and wrote the manuscript. All authors had opportunities to edit the manuscript and provide conceptual comments and critiques.
Funding: this work is supported by R01MH113425 (L.A.) and R01MH106466 (L.T. and S.S.). The RV304/SEARCH 013 is supported by cooperative agreements (WW81XWH-18-2-0040) between the Henry M. Jackson Foundation for the Advancement of Military Medicine, Inc., and the U.S. Department of Defense. Additional funding was from an intramural grant from the Thai Red Cross AIDS Research Centre and, in part, by the Division of AIDS, National Institute of Allergy and Infectious Diseases, National Institute of Health (DAIDS, NIAID, NIH) (grant AAI20052001). Antiretroviral therapy for the participants was supported by the Thai Government Pharmaceutical Organization, Gilead Sciences, Merck and ViiV Healthcare.
Disclaimer: The views expressed are those of the authors and should not be construed to represent the positions of the U.S. Army or the Department of Defense, or the Department of Health and Human Services, or the National Institutes of Health, or the Henry M. Jackson Foundation for the Advancement of Military Medicine, Inc. The investigators have adhered to the policies for protection of human subjects as prescribed in AR 70-25.
Conflicts of interestThere are no conflicts of interest.
References 1. Robertson KR, Smurzynski M, Parsons TD, Wu K, Bosch RJ, Wu J, et al. The prevalence and incidence of neurocognitive impairment in the HAART era. AIDS 2007; 21:1915–1921. 2. Heaton RK, Franklin DR, Ellis RJ, McCutchan JA, Letendre SL, Leblanc S, et al. CHARTER Group, HNRC Group. HIV-associated neurocognitive disorders before and during the era of combination antiretroviral therapy: differences in rates, nature, and predictors. J Neurovirol 2011; 17:3–16. 3. Wang Y, Liu M, Lu Q, Farrell M, Lappin JM, Shi J, et al. Global prevalence and burden of HIV-associated neurocognitive disorder: a meta-analysis. Neurology 2020; 95:e2610–e2621. 4. Smail RC, Brew BJ. HIV-associated neurocognitive disorder. Handb Clin Neurol 2018; 152:75–97. 5. Rourke SB, Bekele T, Rachlis A, Kovacs C, Brunetta J, Gill MJ, et al. Asymptomatic neurocognitive impairment is a risk for symptomatic decline over a 3-year study period. AIDS 2021; 35:63–72. 6. Jassoy C, Johnson RP, Navia BA, Worth J, Walker BD. Detection of a vigorous HIV-1-specific cytotoxic T lymphocyte response in cerebrospinal fluid from infected persons with AIDS dementia complex. J Immunol 1992; 149:3113–3119. 7. Sethi KK, Näher H, Stroehmann I. Phenotypic heterogeneity of cerebrospinal fluid-derived HIV-specific and HLA-restricted cytotoxic T-cell clones. Nature 1988; 335:178–181. 8. Marcondes MC, Burdo TH, Sopper S, Huitron-Resendiz S, Lanigan C, Watry D, et al. Enrichment and persistence of virus-specific CTL in the brain of simian immunodeficiency virus-infected monkeys is associated with a unique cytokine environment. J Immunol 2007; 178:5812–5819. 9. Zloza A, Schenkel JM, Tenorio AR, Martinson JA, Jeziorczak PM, Al-Harthi L. Potent HIV-specific responses are enriched in a unique subset of CD8+ T cells that coexpresses CD4 on its surface. Blood 2009; 114:3841–3853. 10. Schenkel JM, Zloza A, Li W, Narasipura SD, Al-Harthi L. Beta-catenin signaling mediates CD4 expression on mature CD8+ T cells. J Immunol 2010; 185:2013–2019. 11. Richards MH, Narasipura SD, Seaton MS, Lutgen V, Al-Harthi L. Migration of CD8+ T cells into the central nervous system gives rise to highly potent anti-HIV CD4dimCD8bright T cells in a Wnt signaling-dependent manner. J Immunol 2016; 196:317–327. 12. Albalawi YA, Narasipura SD, Olivares LJ, Al-Harthi L. CD4(dim) CD8(bright) T cells home to the brain and mediate HIV neuroinvasion. J Virol 2022; 96:e0080422. 13. Trautmann L, Rimbert M, Echasserieau K, Saulquin X, Neveu B, Dechanet J, et al. Selection of T cell clones expressing high-affinity public TCRs within Human cytomegalovirus-specific CD8 T cell responses. J Immunol 2005; 175:6123–6132. 14. Heaps J, Valcour V, Chalermchai T, Paul R, Rattanamanee S, Siangphoe U, et al. Development of normative neuropsychological performance in Thailand for the assessment of HIV-associated neurocognitive disorders. J Clin Exp Neuropsychol 2013; 35:1–8. 15. Maj M, D’Elia L, Satz P, Janssen R, Zaudig M, Uchiyama C, et al. World Health Organization, Division of Mental Health/Global Programme on AIDS. Evaluation of two new neuropsychological tests designed to minimize cultural bias in the assessment of HIV-1 seropositive persons: a WHO study. Arch Clin Neuropsychol 1993; 8:123–135. 16. Efron B, Stein C. The Jackknife estimate of variance. Ann Stat 1981; 9:585–596. 17. Molero-Luis M, Casas-Alba D, Orellana G, Ormazabal A, Sierra C, Oliva C, et al. Cerebrospinal fluid neopterin as a biomarker of neuroinflammatory diseases. Scientific Reports 2020; 10:18291. 18. Brew BJ, Dunbar N, Pemberton L, Kaldor J. Predictive markers of AIDS dementia complex: CD4 cell count and cerebrospinal fluid concentrations of beta 2-microglobulin and neopterin. J Infect Dis 1996; 174:294–298. 19. Hagberg L, Cinque P, Gisslen M, Brew BJ, Spudich S, Bestetti A, et al. Cerebrospinal fluid neopterin: an informative biomarker of central nervous system immune activation in HIV-1 infection. AIDS Res Ther 2010; 7:15. 20. Peluso MJ, Thanh C, Prator CA, Hogan LE, Arechiga VM, Stephenson S, et al. Cerebrospinal fluid soluble CD30 elevation despite suppressive antiretroviral therapy in individuals living with HIV-1. J Virus Erad 2020; 6:19–26. 21. Rothermundt M, Peters M, Prehn JH, Arolt V. S100B in brain damage and neurodegeneration. Microscopy research and technique 2003; 60:614–632.
Comments (0)