
記住我

The human NSCLC cell line (H1299) was purchased from the American Type Culture Collection (ATCC, USA), the human monocytic cell line THP-1 and the murine macrophage line RAW264.7 were obtained from the laboratory of Dr. Dajun Yang, and the murine Lewis lung carcinoma (LLC) cell line and the HEK293 cell line were obtained from the laboratory of Dr. Liwu Fu. All cell lines were cultured with RMPI-1640 medium (Life Technologies) or high-glucose Dulbecco’s modified Eagle’s medium (Corning) supplemented with 10% fetal bovine serum (FBS) (Gibco, Australia) at 37 °C in 5% CO2. Cells were tested for mycoplasma and interspecies cross-contamination and were authenticated by isoenzyme and short tandem repeat (STR) analyses at Shanghai Biowing Applied Biotechnology Co., Ltd. (Shanghai, China) before the study and randomly during the research. APG-2575 was provided by Ascentage Pharma Group Inc. (Jiangsu, China). PMA and LPS were purchased from Sigma‒Aldrich. Mouse interleukin 4 (IL-4), mouse interferon gamma (IFN-γ), recombinant mouse macrophage colony-stimulating factor (M-CSF), mouse granulocyte-macrophage colony-stimulating factor (GM-CSF), human IL-4, human IFN-γ, human M-CSF, and human GM-CSF were purchased from PeproTech (Rocky Hill, NJ, USA). JSH-23, INF39 and the human drug pembrolizumab were purchased from Selleck Chemicals (Houston, TX, USA). For the in vivo experiments, a mouse anti-PD-1 antibody (clone CD279), anti-CD3 antibody (1452-C11), anti-CD4 antibody (GK1.5), anti-CD8 antibody (53-6.7) and isotype control (IgG) were purchased from Bio X Cell (West Lebanon, NH). The mouse anti-CCL5 neutralizing antibody was purchased from R&D Systems. The mouse anti-CXCL10 (IP-10) neutralizing antibody was purchased from PeproTech (Princeton, NJ, USA). The human anti-CCL5 and anti-CXCL10 antibodies were purchased from R&D Systems. The macrophage depletion reagent PLX3397 was purchased from Medkoo Biosciences (Chapel Hill, Cary, NC). The reagents used in this study are listed in Supplementary Table S1.
Animal experimentsAll animal protocols were performed following the National Institutes of Health (NIH) Guidelines for the Care and Use of Laboratory Animals and were approved by the institutional animal care and use committee of Sun Yat-Sen University Cancer Center. NSG mice with reconstitution of hematopoietic stem cells (HSCs) were purchased from Shanghai Model Organisms Center, Inc. (China) and housed under pathogen-free conditions. Female C57BL/6 and BALB/c nude mice (6–8 weeks old) were purchased from Vital River Laboratory Animal Technology Co., Ltd. (Beijing, China) and reared in a specific pathogen-free (SPF) barrier facility at the Animal Center of Sun Yat-sen University Cancer Center.
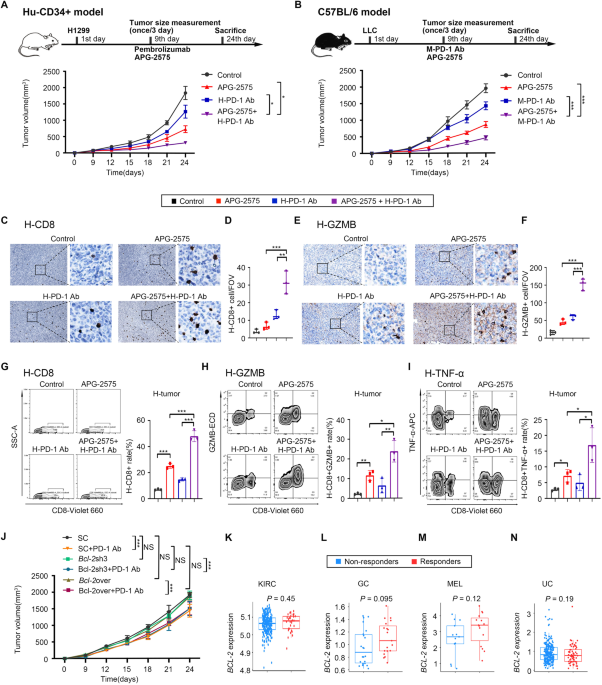
LLC and H1299 tumor cells were subcutaneously injected to establish tumor models in mice. The mice were treated with drugs when the tumor volume reached approximately 100 mm3. To generate subcutaneous H1299 non-small cell lung tumors in humanized mice, 5 × 10⁶ H1299 cells were subcutaneously implanted into the right flanks of female humanized NSG mice. The mice were randomly divided into four groups and treated with phosphate-buffered saline (PBS), APG-2575, an anti-PD-1 antibody, or APG-2575+the anti-PD-1 antibody. In the LLC subcutaneous C57BL/6 model, 5 × 10⁵ LLC cells were subcutaneously implanted into the right flanks of female C57BL/6 mice. One week later, the mice were randomly divided into groups and treated with PBS, APG-2575, an anti-PD-1 antibody, APG-2575+the anti-PD-1 antibody, an anti-CD3 neutralizing antibody, an anti-CD4 neutralizing antibody, an anti-CD8 neutralizing antibody, an anti-CCL5 neutralizing antibody, an anti-CXCL10 neutralizing antibody, isotype control, PLX3397, JSH-23, or INF39 at the indicated times. To generate subcutaneous H1299 or LLC tumors in BALB/c nude mice, 5 × 10⁶ H1299 cells or 5 × 10⁵ LLC cells, respectively, were subcutaneously implanted into the right flanks of female BALB/c nude mice. The mice were randomly divided into two groups and treated with PBS or APG-2575.
For the in vivo experiments, APG-2575 was formulated in 10% ethanol + 30% PEG 400 + 60% Phosal® 50PG. The human drug pembrolizumab, the mouse anti-PD-1 antibody (clone CD279) and mouse IgG1 (clone MOPC-21; BioXcell, Lebanon, NH, USA) were formulated in 1 × PBS. The drug administration strategy is described in Supplementary Table S2. Subcutaneous tumor growth was monitored by measuring the length (L) and width (W) of the tumors using Vernier calipers. The tumor volume (V) was calculated using the equation V = (L × W2)/2. Tumor growth in the subcutaneous tumor model was monitored every two days, and the survival of tumor-bearing mice was evaluated every day. When the experimental endpoints were met or the tumor volume reached 2000 mm3, all of the mice were euthanized according to NIH guidelines. The tumors were resected and stored in MACS Tissue Storage Solution on ice (Miltenyi Biotec, Auburn, CA, USA). The tumors from all experiments were then processed on the same day for FACS analysis or sorting. The remaining collected tumors and organs were fixed in 10% paraformaldehyde, embedded in paraffin, sliced into ~4 μm sections, and stained with hematoxylin and eosin (H&E).
Preparation of single-cell suspensions from tumorsThe isolation of tumor-infiltrating cells has previously been described [76], but the procedure was slightly modified for this study. Briefly, tumor tissues were collected and cut into small pieces in PBS. After centrifugation, enzymatic digestion was performed using a prepared enzyme mix from a tumor dissociation kit (Miltenyi Biotec, Auburn, CA, USA) with a gentle MACS dissociator (Miltenyi Biotec) for 1 h at 37 °C. Next, the cell suspensions were filtered through a 70-μm cell strainer (Becton Dickinson). Red blood cells were lysed with ACK lysis buffer prior to washing with FACS buffer. The cell suspensions were then subjected to centrifugation with Ficoll to harvest the mononuclear cells and/or sorted with anti-F4/80 microbeads (Miltenyi Biotec) to harvest the tumor-infiltrating macrophages.
Flow cytometric analysisFor surface marker analysis, live cells were resuspended in 1 × PBS and stained with antibodies at 4 °C for 30 min. The concentration of each antibody used was determined according to the recommended product protocol. In some cases, cells were pretreated with a mouse anti-CD16/32 antibody (BioLegend, #101320) to block nonspecific binding of immunoglobulin to macrophage Fc receptors. For intracellular cytokine staining, cells were fixed and permeabilized after stimulation with Cell Activation Cocktail (with Brefeldin A) (Biolegend, #423303) in an incubator for 6 h and labeled with antibodies. The cells were then fixed and permeabilized without stimulation. Data were analyzed with FlowJo software. The Abs used for flow cytometric analyses were purchased from eBioscience, BioLegend, and BD Biosciences (Supplementary Table S1).
Generation of mouse bone marrow-derived macrophages (BMDMs) and human macrophagesAs described elsewhere [77], bone marrow cells were isolated from the femurs of female C57BL/6 mice and cultured with 20 ng/ml recombinant M-CSF (PeproTech) for 5 days. On Day 6, naive BMDMs were collected and then stimulated for 24 h with 20 ng/ml IL-4 (PeproTech) or 100 ng/ml LPS (Sigma‒Aldrich) plus 20 ng/ml IFN-γ (PeproTech) to generate BMDM-M2s or BMDM-M1s, respectively. For human macrophage culture, monocytes were isolated from the blood of healthy donors by magnetic bead separation (Miltenyi Biotec) and cultured with 20 ng/ml recombinant human M-CSF (PeproTech) to induce differentiation into macrophages. Seven days later, 20 ng/ml recombinant human IL-4 (PeproTech) was added to induce M2 polarization of these macrophages.
T-cell proliferation and tumor cytotoxicity assaysT cells were isolated from the spleens of female C57BL/6 mice using a Pan T-Cell Isolation Kit (Miltenyi Biotec, CA, USA). Then, carboxyfluorescein succinimidyl ester (CFSE) (Sigma‒Aldrich, MO, USA)-labeled T cells were cultured with 10 ng/ml IL-2 (PeproTech, NJ, USA) in complete RPMI-1640 medium (10% FBS, 100 U/ml penicillin–streptomycin) and stimulated with CD3/CD28 T-Cell Activator (Stemcell Technologies, BC, Canada) in the presence or absence of conditioned medium from control or APG-2575-treated BMDM-M2 cells. After 72 h, CFSE was detected, and T cells were labeled with CD8 for specific measurement of T-cell proliferation. In some instances, macrophage-induced tumor cell apoptosis or APG-2575-induced macrophage apoptosis was measured by Annexin-V and PI staining (BD Pharmingen).
Reverse transcription qPCRFor quantitative reverse transcription polymerase chain reaction (qRT‒PCR) analysis, cells were harvested and processed for RNA extraction. Total RNA (1 μg) was extracted from cells or tumor tissues with TRIzol reagent (Invitrogen, USA) and reverse transcribed into cDNA using the ReverTra Ace Kit (Yishan Biotechnology Co., Ltd., Shanghai, China). cDNA was amplified using SYBR Green qPCR Master Mix (ROX2 plus) (EZBioscience, Roseville, USA) on a Real-Time PCR System (Roche Applied Science, Penzberg, Germany). The target mRNA levels were normalized to those of GAPDH or β-actin. The primer sequences are listed in Supplementary Table S3.
ELISAThe concentration of secreted IL-10 in culture medium from IL-4-activated CD14+ monocyte-derived macrophages and mouse BMDMs was measured using human and mouse ELISA kits (RayBiotech) according to the manufacturer’s protocol.
CBA assayQuantitative determination of the TNF-α, CCL5, and CXCL10 concentrations in samples was performed using the CBA Human Cytokine Kit and CBA Mouse Cytokine Kit (BD Biosciences; San Diego, CA, USA) according to the manufacturer’s protocol.
Western blot analysisTotal cellular protein in cell lysates and proteins in the prestained Protein Ladder (Thermo Fisher Scientific) were separated by 10% SDS-polyacrylamide gel electrophoresis and then transferred onto nitrocellulose membranes. After blocking with 5% bovine serum albumin (BSA) in Tris-buffered saline containing 0.1% Tween 20 for 1 h at room temperature, the membranes were incubated with different primary antibodies. For details, see Supplementary Table S1. Next, the membranes were washed and incubated with horseradish peroxidase-conjugated secondary antibodies. The Nuclear/Cytosol Fractionation Kit (Thermo Fisher, USA) was used according to the manufacturer’s protocol. In some instances, during the extraction of cytoplasmic and nuclear proteins, the proteins were visualized using electrochemiluminescence (ECL) western blotting reagent (Thermo Pierce).
Immunofluorescence and immunohistochemical stainingFor immunofluorescence staining, cells were seeded in a confocal dish for 24 h with or without APG-2575 treatment. In some cases, other compounds were added for pretreatment. Cells were fixed with 4% paraformaldehyde in PBS (pH 7.4) for 10 min at room temperature and then permeabilized with 0.5% Triton X-100 in PBS for 10 min. After blocking with 2% BSA in PBS containing 0.1% Tween 20 for 30 min, the cells were incubated with antibodies specific for NF-κB p65 (Cell Signaling Technology, #8242, 1: 100), NOD-like receptor family pyrin domain containing 3 (NLRP3) (Bioss Inc., Beijing, #bs-10021R, 1:100), and adaptor apoptosis-associated speck-like protein (ASC) (Bioss Inc., Beijing, bs-6741R, 1:100) in PBS containing 2% BSA and 0.1% Tween 20 overnight at 4 °C. After the cells were washed and stained with a secondary antibody for 1 h at room temperature, nuclei were stained with DAPI (4’,6-diamidino-2-phenylindole) (2 μg/ml). A fluorescence microscope (Olympus BX51, Tokyo, Japan) was used to observe the slides and acquire merged images.
For immunohistochemical staining, lung cancer tissues were isolated from tumor-bearing mice, fixed in 37% formalin and embedded in paraffin. The sections were then incubated with various primary antibodies, which are detailed in Supplementary Table S1. Subsequently, the sections were incubated with an anti-rabbit secondary antibody (ZsBio, China) after being washed with PBS, and staining was then visualized with DAB (ZsBio, China).
Chemotaxis assayThe chemotaxis of murine and human CD8+ T cells was assayed in 24-well plates (5-μm-pore-size Transwell inserts with polycarbonate membranes; Corning). Medium alone (RPMI 1640 plus 10% FBS) or macrophage culture supernatants were added to the bottom compartments of triplicate wells. Murine or human T-cell migration was assessed with medium, APG-2575-treated supernatant alone, supernatant plus 10 μg/mL anti-CCL5 neutralizing antibodies, and/or 10 μg/mL anti-CXCL10 neutralizing antibody (R&D Systems). CD8+ T cells (5 × 10⁵) from C57BL/6 mouse spleens or the blood of healthy donors were purified with mouse or human anti-CD8a beads (Miltenyi Biotec), placed in Transwell inserts and incubated at 37 °C for 8–12 h. Cells in the bottom compartments were enumerated by flow cytometry. The numbers of spontaneously migrated cells were subtracted from the total number of migrated cells under all conditions, and the data are reported as the chemotactic index. Chemotactic index = (migrated cells – spontaneously migrated cells)/total T cells plated in the Transwell insert × 100%.
Electrophoretic Mobility Shift Assay (EMSA)For the EMSA, we obtained the nuclear and cytoplasmic protein fractions using a cytoplasmic/nuclear protein extraction kit (Thermo Fisher, USA). The DNA–protein complexes were loaded onto 4% nondenaturing polyacrylamide gels. After 35 min of separation by electrophoresis in Tris borate-EDTA buffer, the products in the gels were transferred onto Hybond-N+ membranes. The signals were detected using the Bio-Rad ChemiDoc XRS+ system. The probe sequences are presented in Supplementary Table S4.
Luciferase reporter assayCells were transfected with 500 ng of luciferase reporter plasmids and 50 ng of the pRL-TK vector (an internal control with a Renilla luciferase gene). Transfection was performed using Lipo3000 according to the manufacturer’s protocol. After 24 h, luciferase activity was measured with a Dual Luciferase Reporter Assay System (Promega) according to the manufacturer’s instructions. The relative luciferase activity values in the treated cells were normalized to those in the control cells.
Chromatin immunoprecipitation (ChIP) assayChIP assays were performed as previously described [78]. ChIP assays were conducted using an Enzymatic Chromatin IP Kit (Magnetic Beads). Cells were cultured in 10-cm dishes and treated with APG-2575 (10 μM), the combination of APG-2575 and JSH-23, or DMSO. Cells were then subjected to crosslinking with 1% formaldehyde for 20 min at room temperature. After termination of crosslinking by the addition of glycine, DNA was digested with micrococcal nuclease, and chromatin was sheared and was then immunoprecipitated with an anti-NF-κB p65 antibody or normal rabbit IgG. Immunoprecipitated chromatin was decrosslinked at 65 °C for 4 h and purified using spin columns. Primer sequences:
NLRP3: Forward: 5′-GAGCCCTGAGGTTTCACTTTTTCCCATTG-3′
NLRP3: Reverse: 3′- GGTTAGGCAGAAACTGTCACTACGTTCGA-5′.
Flow cytometric analysis of apoptotic cellsLLC cells, H1299 cells, BMDM-M1s (induced by LPS + IFN-γ), BMDM-M2s (induced by IL-4) and BMDM-TAMs (induced by conditioned medium (CM) from tumor cells) were seeded at a density of 1 × 10⁶ cells/well in 6-well plates. After the cells were cultured for 24 h, APG-2575 was added to the culture plates, and the cells were then cultured under routine conditions. Twenty-four hours later, the cells were collected and washed with PBS. Annexin V/FITC and PI were added to the cells for staining 15 min. Subsequently, the stained cells were analyzed by flow cytometry (BD Biosciences, San Jose, CA, USA).
Biotinylated protein interaction pulldown assayBiotinylated APG-2575 (Bio-APG-2575) and biotin were purchased from Wayen Biotech (Shanghai, China). For the pulldown assay, we used PierceTM Biotinylated Protein Interaction Pull-Down Kits (Thermo Fisher). Lysates prepared from BMDMs and RAW264.7 cells were added to streptavidin-agarose beads with bio-APG-2575. Lysates prepared from BMDMs and RAW264.7 cells transfected with the wild-type NF-κB p65 or mutant NF-κB p65 construct were also added. The prepared samples were loaded onto a polyacrylamide gel for protein separation and subsequent Western blotting.
Evaluation of APG-2575 binding sites on the NF-κB p65 proteinThe plasmids pcDNA3.1-Flag-NF-κB p65 (mouse, WT) and pcDNA3.1-Flag-NF-κB p65 (mouse, Arg33A/Lys56A/Asp277A/Arg278A) were provided by Saisofi Biotechnology Co., Ltd. (Suzhou, China). BMDMs and RAW264.7 cells were transfected with these plasmids, and lysates were prepared for use in biotinylated protein interaction pulldown assays.
Macrophage migration assayMacrophage migration assays were conducted by using 24-well Transwell inserts (8 μm; BD Biosciences). Briefly, IL-4-activated BMDMs and RAW264.7 cells were starved overnight. Then, a suspension of 4 × 10⁴ cells was placed into the upper compartments. The macrophages were pretreated with or without APG-2575 for 24 h. After the macrophages were allowed to migrate for 24–36 h, methanol fixation (10 min) and crystal violet staining (15 min) were performed. Cells were enumerated using ImageJ (NIH, Bethesda, MD, USA).
Patients and non-small cell lung cancer samplesPrimary human NSCLC samples were obtained from 53 patients with advanced NSCLC who received immunotherapy during their course of anticancer therapy at Sun Yat-sen University Cancer Center (Guangzhou, China). This study was performed with permission from the Ethics Committee of Sun Yat-sen University Cancer Center’s Institutional Review Board.
Tissue multiplex immunohistochemistryNSCLC samples were stained with a multiplex fluorescence immunohistochemical kit, PDOne six-color TSA-RM-82758 (100 T) (cat 10234100100 Panovue, Beijing, China). After incubation with the primary antibody, the samples were incubated with an HRP-conjugated secondary antibody, and tyrosine signal amplification (TSA) was performed to label antigens. After each TSA labeling step, the primary and secondary antibodies were removed using a microwave for heat-induced antigen retrieval. After the sample was eluted, the next antigen was labeled, and this procedure was repeated for all five antigen markers. Nuclei were stained with 4′-6′-diamidino-2-phenylindole (DAPI, Sigma‒Aldrich) when immunohistochemical staining was complete. The antibodies used for staining were anti-NF-kB p65 (polyclone, dilution 1:600, Signalway Antibody), anti-NLRP3 (polyclone, dilution 1:800, Proteintech), anti-CD86 (clone E2G8P, dilution 1:1000, Cell Signaling Technology), anti-CD206 (clone E6T5J, dilution 1:200, Cell Signaling Technology), and anti-PANCK (clone C11, dilution 1:200, Cell Signaling Technology). Lung cancer samples were scanned, and fluorescence images were acquired at ×20 magnification with a PanoVIEW VS200 slide scanner (Panovue, Beijing, China) and an Olympus 20× lens. Image recognition and analysis were performed with QuPath image analysis software (Version 0.3.0, Queen’s University of Belfast, Northern Ireland, UK). The images were quantized into data by tissue segmentation and cell segmentation using the positive threshold settings and phenotypic recognition. The quantitative data were assembled by an R script (Version 4.1.2), and basic data such as the positive cell number, positive staining rate and density were obtained for analysis.
RNA-seq and gene enrichment analysesGene expression analysis was performed by RNA-seq for the conditions shown in the relevant figures. Cells subjected to different treatments were harvested for RNA extraction using TRIzol. The sequencing library was established after high-quality RNA was quantified and was subsequently sequenced on an Illumina NovaSeq platform. To demonstrate the differential gene expression between the control and treated samples, the expression level of each transcript was determined based on the fragments per kilobase of exon per million mapped reads method. Differential expression analysis was conducted using the R statistical package software EdgeR (http://www.bioconductor.org/packages/2.12/bioc/html/edgeR.html). Functional enrichment analyses involving Gene Ontology (GO) terms and KEGG pathways, as well as gene set enrichment analysis (GSEA), were also performed.
Bioinformatic analysis of a public dataset and statistical analysisImmune cell infiltration scores were systematically evaluated using the CIBERSORT [79] method based on a TCGA-LUAD cohort and RNA-seq data downloaded from the Tumor IMmune Estimation Resource 2.0 (TIMER 2.0 [80], http://timer.comp-genomics.org/) database. The clinical data were collected from the University of California Santa Cruz (UCSC) [81]. Xena browser (https://xenabrowser.net). Patients without survival information or immune cell infiltration scores were removed from further analyses. Correlation analysis of gene expression and immune infiltration was performed with TIMER 2.0.
Differences between continuous variables were analyzed with the Wilcoxon test. Correlation coefficients were calculated by Spearman correlation and distance correlation analyses. For corresponding survival analysis of patients based on immune cell infiltration, survival curves were generated using the Kaplan–Meier method. The log-rank (Mantel‒Cox) test was used to determine the statistical significance of differences. All P values were two-tailed, and a P value of < 0.05 was considered to indicate a statistically significant difference. All data analysis and image presentation tasks were carried out using R (version 4.1.0) and R Bioconductor packages.
Molecular dockingMolecular docking was conducted in MOE v2018.01011. The 3D structure of the mouse RELA protein was downloaded from the RCSB PDB Data Bank (PDB ID 1IKN) [82]. The 2D structures of small molecules were converted to 3D structures in MOE through energy minimization. The binding sites of the native ligands in the protein structures were set as binding pockets for small molecules [83]. The protonation state of the target and the orientation of the hydrogen atoms were optimized using the QuickPrep module at a pH of 7 and a temperature of 300 K. Prior to docking, the AMBER10:EHT force field and the reaction field (R-field) implicit solvation model were selected. The position of the native ligand in the X-ray structure of each receptor was defined as the binding site. The docking workflow followed the “induced fit” protocol, in which the side chains of the receptor pocket were allowed to move according to the ligand conformations with a constraint on their positions. The weight used for tethering side chain atoms to their original positions was 10. All docked poses of molecules were ranked by London dG scoring, and force field refinement was then carried out on the top 30 poses, followed by rescoring with the GBVI/WSA dG scoring function. The top-ranked pose was selected as the final binding mode. The binding mode was visualized using PyMOL (www.pymol.org).
Molecular dynamics (MD) simulationMD simulation was performed in GROMACS (version 2020.6), with 1 simulation for each of the 20 complexes of APG-2575 with the mouse RELA protein. For the AMBER14SB2 force field and general AMBER force field (GAFF), 3 parameters were used for the protein and APG-2575 molecule. The partial atomic charges of APG-2575 were calculated with the restrained electrostatic potential (RESP)4 charges following the optimization of the molecule at the B3LYP/6-31 G(d) level using the Gaussian165 package. The complex was then neutralized by adding chlorine counterions and solvated in a box of TIP3P6 water molecules with solvent layers located at a distance of 1.2 nm between the box edges and solute surface. The particle mesh Ewald (PME)7 method was used to treat the long-range electrostatic interactions. The calculated radius of van der Waals interactions was 1.2 nm.
Before the production run, the systems were relaxed with 1000 steps using the steepest descent algorithm followed by another 1000 steps using the conjugate gradient method. For the equilibration phase, the temperature and pressure were controlled using the Berendsen coupling algorithm with time constants of 0.1 and 1.0 ps, respectively. For the production run, an integration time step of 2 fs was employed to integrate the equations of motion. The Parrinello-Rahman coupling algorithm was used to keep the pressure constant. The simulated temperature was set to 298.15 K, and 100 ns MD simulation was performed in the NPT ensemble. The binding free energy of each receptor–ligand complex was calculated with gmx_MMPBSA (version 1.4.3)10 based on MMPBSA.py11 in the AmberTools20 suite.
The molecular visualizations of the receptor–ligand complexes were created with VMD v1.9.4 (Visual Molecular Dynamics) software12. 2D diagrams of the receptor–ligand complexes were created with PoseView13.
Single-cell RNA sequencing (scRNA-seq)Sample collectionH1299 tumor cells (5 × 10⁶) were transplanted into humanized CD34+ model mice. Two weeks later, the tumors were harvested, and 0.1 g of tumor tissue from each tumor was collected. Single-cell suspensions were generated following the methods described below in the “Preparation of single-cell suspensions from tumors” section. A total of 5 × 10³ viable human CD45+ immune cells were sorted by flow cytometry.
scRNA-seqCell capture and cDNA synthesis were carried out using a single-cell 5′ Library and Gel Bead Kit (10x Genomics, 1000006) and a Chromium Single Cell A ChIP Kit (10x Genomics, 120236). The cell suspension (300-600 viable cells per microliter, as measured with a Countstar system) was loaded onto the Chromium single-cell controller (10x Genomics) to generate single-cell gel beads in emulsion according to the manufacturer’s protocol. In brief, single cells were suspended in PBS containing 0.04% BSA. Captured cells were lysed, and the released RNA was barcoded through reverse transcription in individual gel beads in emulsion (GEMs). Reverse transcription was performed on an S1000TM Touch Thermal Cycler (Bio-Rad) with the following thermal cycling program: 53 °C for 45 min, followed by 85 °C for 5 min and holding at 4 °C. cDNA was generated and then amplified, and the quality was assessed using an Agilent 4200 system (performed by CapitalBio Technology, Beijing).
Single-cell RNA-seq library preparationScRNA-seq library preparation was conducted according to the manufacturer’s instructions. ScRNA-seq libraries were constructed using a Single Cell 5’ Library and Gel Bead Kit, a Single Cell V(D)J Enrichment Kit, Human T Cells (1000005) and a Single Cell V(D)J Enrichment Kit, Human B Cells (1000016). The libraries were finally sequenced using the Illumina NovaSeq 6000 platform with a sequencing depth of at least 100,000 reads per cell with a paired-end 150 bp (PE150) strategy (performed by CapitalBio Technology, Beijing).
Data preprocessing Cell Ranger pipelineCell Ranger software was obtained from the 10x Genomics website https://support.10xgenomics.com/single-cell-gene-expression/software/downloads/latest. Alignment, filtering, barcode counting, and UMI counting were performed with the Cell Ranger count module to generate a feature-barcode matrix and to identify clusters. Dimensionality reduction was performed using PCA, and the first ten principal components were used to generate clusters via the K-means algorithm and a graph-based algorithm.
Seurat pipelineThe other clustering pipeline used was Seurat 3.0 (R package). Cells containing fewer than 200 genes, ranked in the top 1%, or containing more than 25% mitochondrial DNA were regarded as abnormal and filtered out. Dimensionality reduction was performed using PCA, and data were visualized on TSNE and UMAP plots.
Cell type annotationClusters were annotated using manual analysis of cell type-specific gene markers obtained from the literature (Supplementary Table S5) in combination with automatic cell type identification using CellAssign [84] (http://bio-bigdata.hrbmu.edu.cn/CellMarker/). Cell type recognition from single-cell RNA sequencing data was performed by leveraging reference transcriptomic datasets of pure cell types to independently infer the cell of origin of each single cell. For annotation of human cell types, Blueprint_Encode or HPCA was used.
Statistical analysesAll statistical analyses were performed using SPSS 22.0 (IBM, Armonk, USA) or GraphPad Prism (version 8.0). All experiments were carried out at least three times, and the data from one representative experiment are shown. The data are shown as the means ± SDs. The statistical tests used for data analysis were two-tailed Student’s t test, one- and two-way ANOVA, Fisher’s exact test, the chi-square test and the log-rank test. Differences with P values < 0.05 were regarded as statistically significant. *P < 0.05, **P < 0.01, ***P < 0.001, ****P < 0.0001. NS indicates a nonsignificant difference.
留言 (0)