
記住我


This study was conducted as a single-center, prospective, randomized, partly blinded, controlled trial in a tertiary, university affiliated hospital between May 15, 2019 and January 30, 2021 in accordance with the principles of the 2013 Declaration of Helsinki. All experimental protocols were approved by a named institutional was approved by the Institutional Review Board of Beijing Tong Ren Hospital (TR-IRB no:20170828) and was registered at ClinicalTrials.gov (www.clinicaltrials.gov, NCT03940144) on 07/05/2019. Written informed consent forms were obtained from all included subjects. The reporting of the trial adheres to the Consolidated Standards of Reporting Trials (CONSORT) guidelines [16].
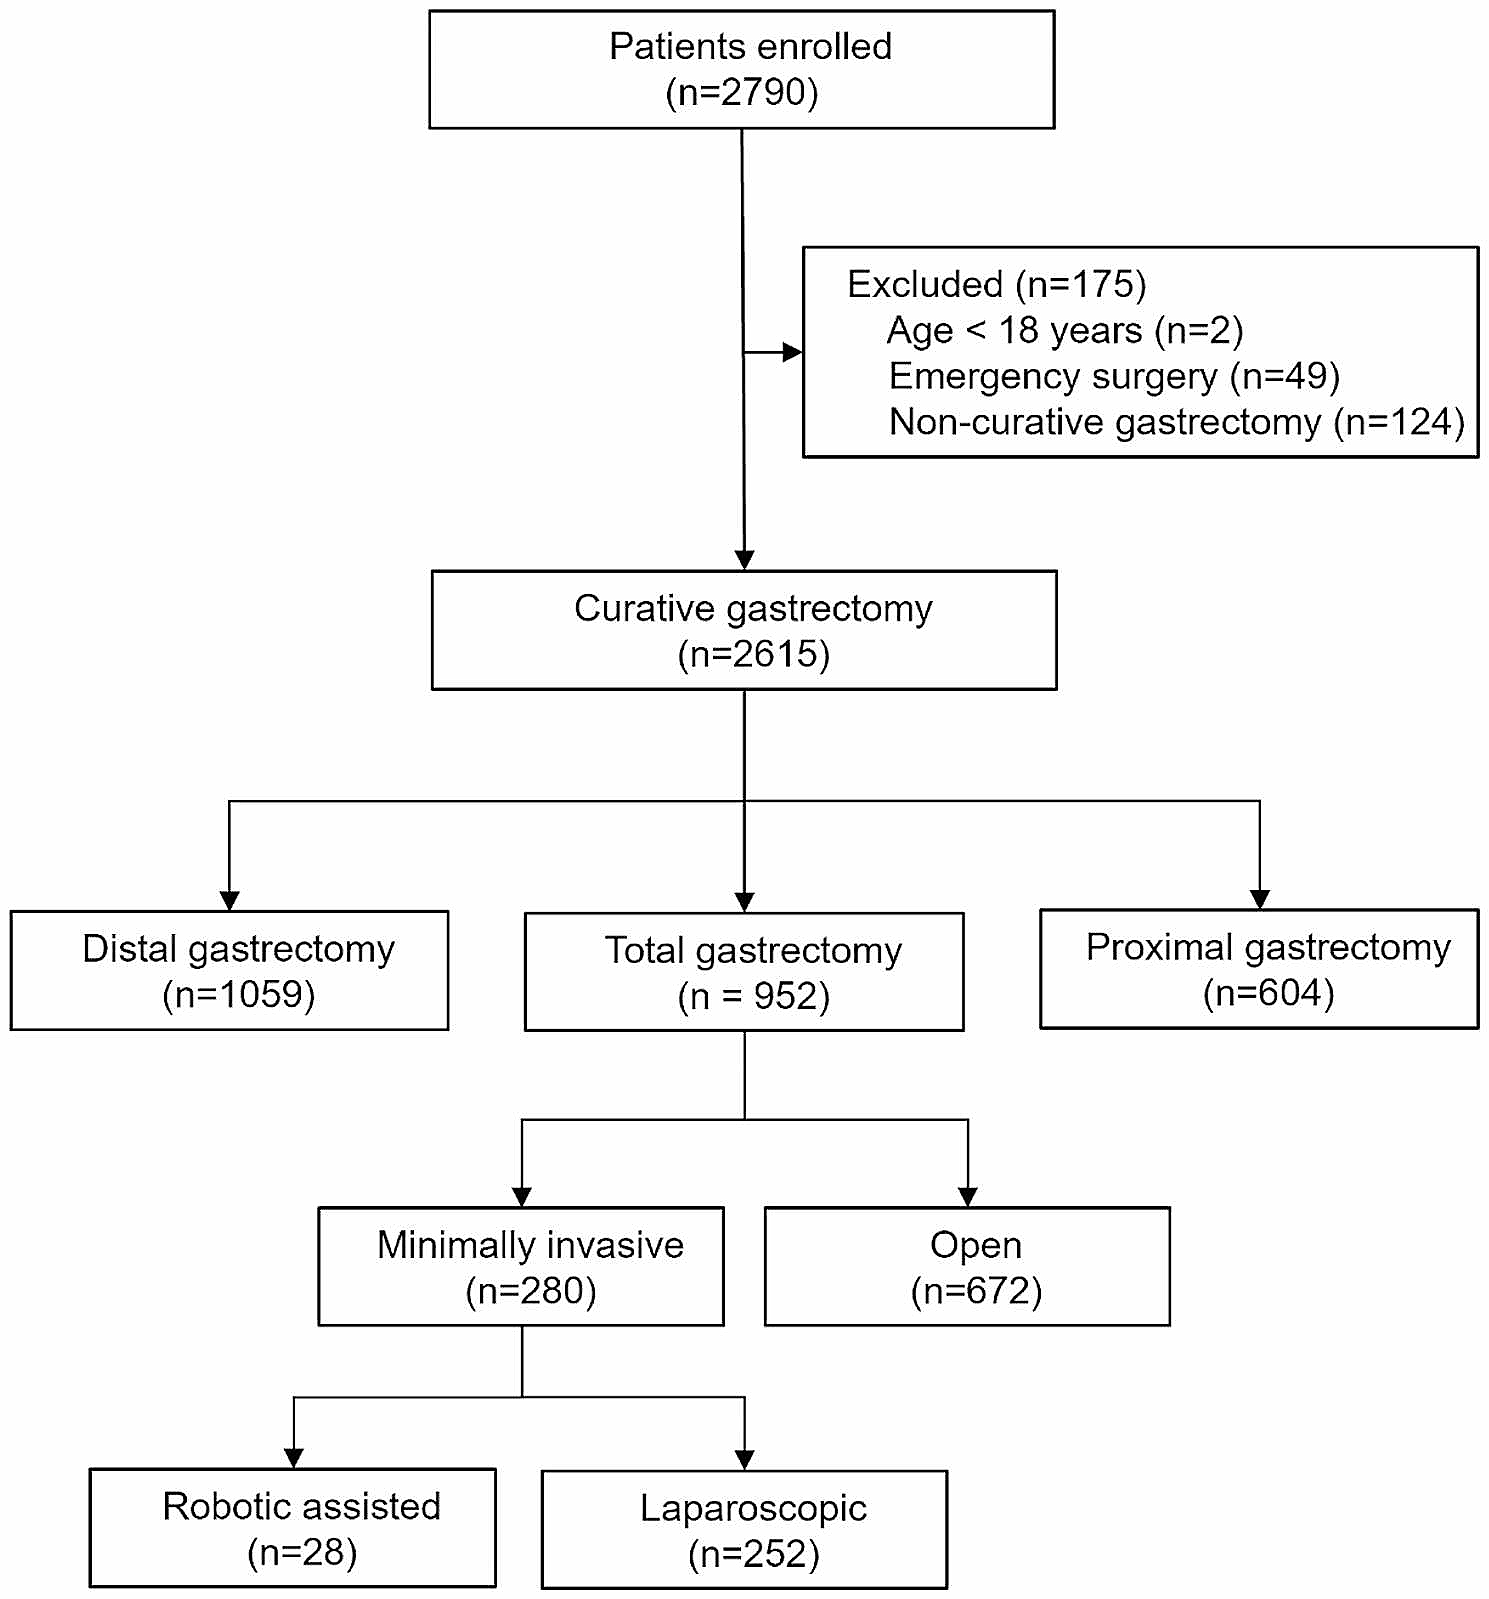
Study populationPatients undergoing elective major abdominal surgery were recruited. Procedures were considered major if listed for resection of gastrointestinal, gynecologic, and urologic cancer with tumor debulking, staging or reconstruction with a risk for significant surgical blood loss.
Exclusion criteria included co-existing congestive heart failure; chronic lung disease; or renal or hepatic dysfunction (creatinine > 50% or liver enzymes > 50% of normal values), and cardiac arrhythmias. Patients under 18 years, pregnant or lactating woman, patients with esophageal or gastric surgical history, and patients undergoing emergency surgery were also excluded from the study.
Patient characteristics, current diagnosis, and a measure of physiologic and surgical risk (Portsmouth physiologic and operative severity score for the enumeration of mortality and morbidity score: P-POSSUM [17, 18]) were collected.
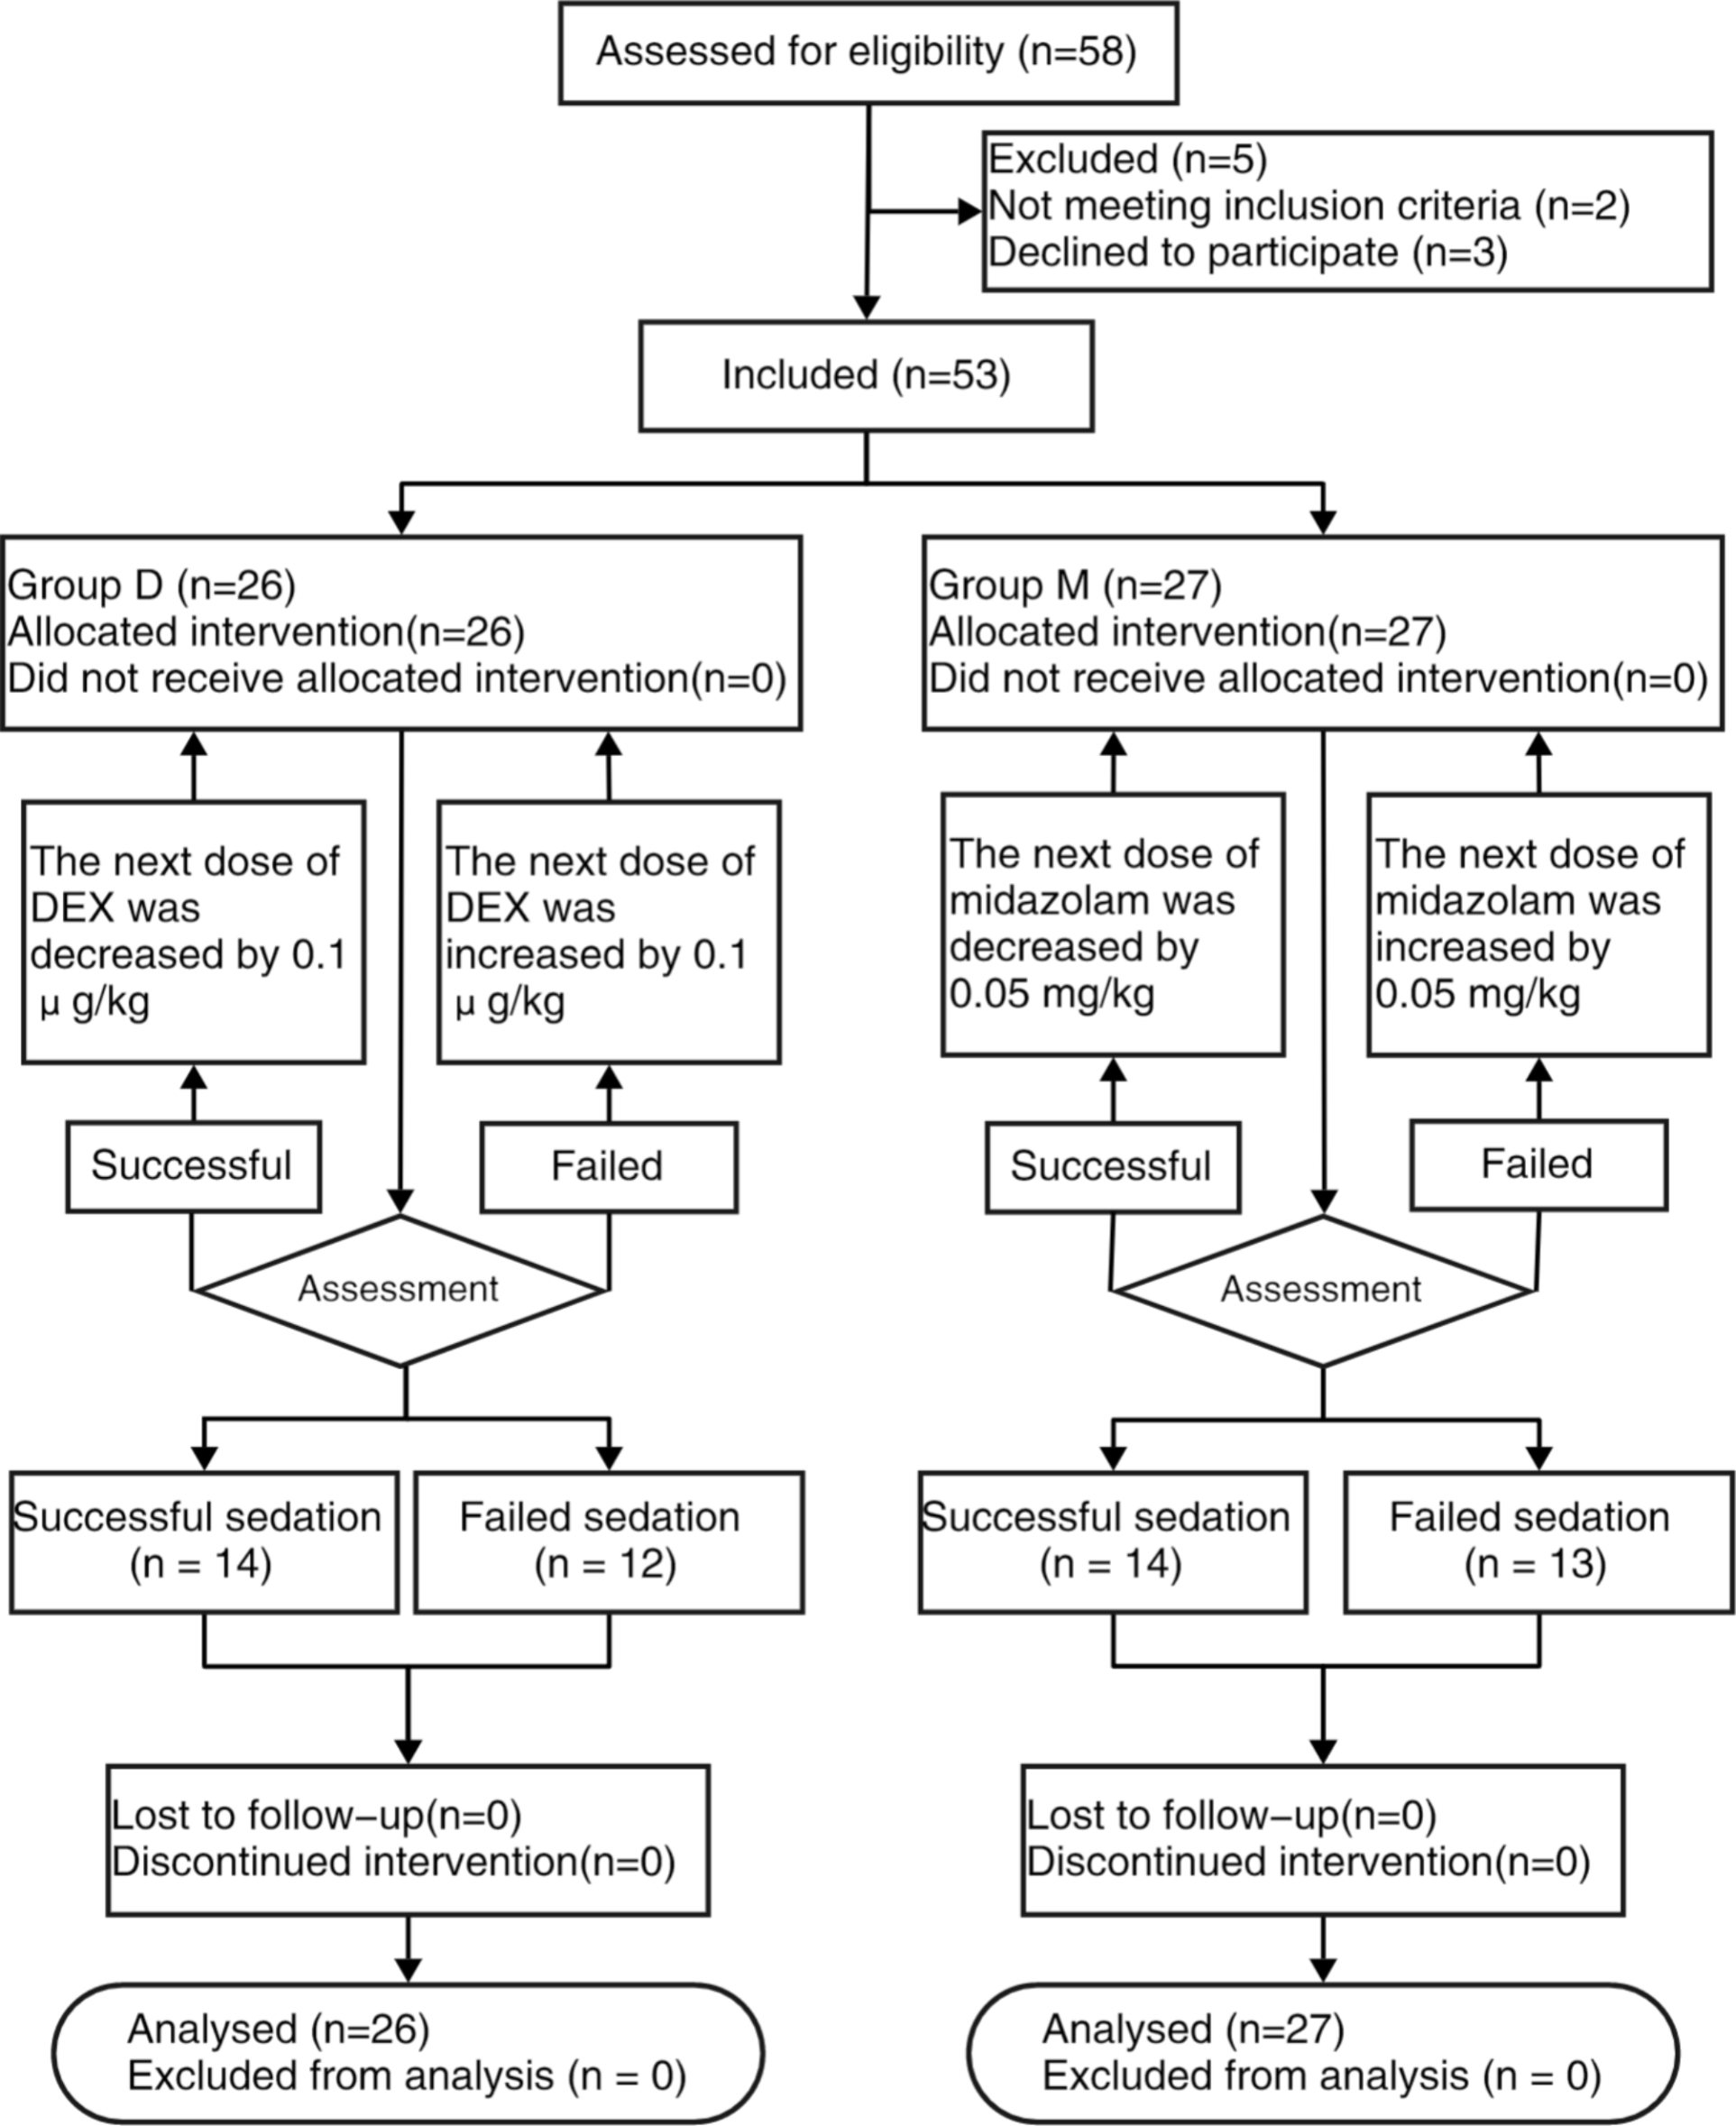
Enrollment, randomization, and blindingPatients were randomized allocated on one-to-one basis to either into a standard conventional fluid therapy group (group C) or GDFT group (group G) using a closed envelope system. A research personnel otherwise not involved in the study prepared and sealed the opaque, consecutively numbered envelopes. Patients were blinded to group allocation. Care providers and investigators in the operating room who supported to fluid strategy administration and recorded intraoperative data could not be blinded due to the presence of the cardiac index trending monitor. The postoperative assessors were blinded to the allocation.
Perioperative careAll patients in this study were treated with a standard enhanced recovery after surgery (ERAS) program (Supplementary file: Appendix 1). All patients received standard fasting protocol. Solid food was allowed up to 6 h before surgery, and clear fluids up to 2 h before surgery. A liquid diet during the 24 h preceding surgery was prescribed if patients received mechanical bowel preparation.
Intraoperative managementAll patients received basic anesthetic monitoring by five-lead-electrocardiogram, pulse oximetry, blood pressure cuff and bispectral index (BIS), at least one peripheral i.v., a central venous catheter and invasive radial arterial blood pressure monitoring. All patients received bilateral quadratus lumborum muscle block with 0.375% ropivacaine 40 ml 30 min before induction under sedation with midazolam (0.02 mg/kg). In both groups, standard general anesthesia was induced with sufentanyl 0.4–0.5 μg/kg, propofol 1.5-2 mg/kg and cisatracrurium 0.15 mg/kg. After intubation of the trachea, the lungs were ventilated with tidal volume of 8 ml/kg of ideal body weight and positive end expiratory pressure (PEEP) of 4 mmHg, respiratory rate was set to maintain normocapnia using a constant fresh gas flow of 2 L/min. Maintenance of anesthesia was performed with 0.9–1.8% end tidal sevoflurane, remifentanyl and propofol to maintain the BIS value of 40%-60% and cisatracrurium boluses were given as needed.
In group G, the arterial line was connected to the Vigileo monitor (software version 1.14; Edwards Lifesciences, Irvine, CA, USA) via the FloTrac pressure transducer and all intravascular pressure measurements were referenced to mid-axillary line level. The shape of the arterial curve was checked visually for damping throughout the study period. SVV and cardiac index (CI), as indicators for fluid responsiveness during mechanical ventilation and sinus rhythm, were continuously measured. SVV ≤ 12% and CI of at least 2.5L/min/m2 were required. 500 mL of crystalloids was infused during induction, followed by a 4 ml/kg/h continuous infusion. If SVV was higher than 12% for over 5 min, a 250 mL bolus of crystalloid was given. Another 250 ml bolus of colloid was administrated if SVV was still higher than 12% or SVV decreased over 10%. If CI value was below 2.5 L/min/m2, inotropes were applied to reach this minimum CI, serving as a safety parameter to prevent patients from low cardiac output. If SVV and CI were within the target range but mean arterial pressure (MAP) was below 65 mmHg, vasopressor was started. After the initial assessment, patients were reassessed every 5 min intraoperatively to maintain values according to the study algorithm as illustrated in Fig. 1. Changes in SVV caused by external factors such as pneumoperitoneum, changes in body position, alternation in ventilator settings, or the administration of vasopressor or inotropic drugs did not initiate fluid administration but were noted in the data file.
Fig. 1
Algorithm for fluid therapy in the operating room in the goal-directed fluid therapy group; CI: cardiac index; MAP: mean arterial pressure; IBW: ideal body weight; PEEP: positive end expiratory pressure; SVV: Stroke volume variation
In group C, MAP was kept between 65 and 90 mmHg, and central venous pressure (CVP) between 8 and 12 mmHg. 500 ml of crystalloids was infused during induction, followed by a continuous infusion of crystalloids (4 ml/kg/h). If the MAP decreased below 65 mmHg, or if the CVP decreased below 8 mmHg, a 250 mL bolus of crystalloids was given. Another 250 ml bolus of colloid was administrated after waiting 5 min if CVP still decreased below 8 mmHg. If the MAP decreased below 65 mmHg and remained unresponsive to fluids, vasopressor or inotrope was given to maintain the MAP above 65 mmHg (Fig. 2).
Fig. 2
Algorithm for fluid therapy in the operating room in the control group; CVP: central venous pressure; MAP: mean arterial pressure. * The goal did not reach after 500 ml colloid administration, consider inotropes or vasopressors
Normothermia was achieved during surgery with a forced-air warming blanket. Intermittent pneumatic leg compression devices were applied to all patients. No nasogastric tube was given. All patients were given a single intravenous dose of 4 mg of ondansetron as prophylaxis against postoperative nausea and vomiting at the end of surgery. Blood loss was substituted with fluids according to the protocols and a hemoglobin value below 8 mg/dL was considered to be a trigger for transfusion of packed red blood cells. At the end of surgery total catecholamine administration, estimated blood loss, urine output and infused fluids were recorded.
Postoperative managementPatients in both groups were postoperatively treated with patient-controlled intravenous analgesia (PCIA) with standard analgesic regimens. All patients were transported to the post anesthesia care unit (PACU) unless the intensive care unit (ICU) was indicated because of intraoperative events. The protocol fluid administration continued in the PACU, with all patients in the conventional fluid therapy arm receiving 1 ml/kg/h of balanced crystalloid solution and those in group G receiving 1 ml/kg/h of maintenance and any additional boluses given based on GDFT protocol. All patients were encouraged to early mobilization and early oral nutrition. All patients were follow-up for at least 30 days after surgery by blinded research team members.
OutcomesPrimary outcomes: GI function and length of hospital stayLength of hospital stay was determined by the period from completion of surgery to discharge. Standardized discharge criteria were used in this study (Supplementary file: Appendix 2) [19]. Postoperative GI function was evaluated daily after surgery by Intake, Feeling nauseated, Emesis, physical Exam, and Duration of symptoms (I-FEED) scoring system (Table 1) [20]. I-FEED score was calculated at 72 h after surgery. The incidence of POGD (defined as I-FEED score ≥ 6), and the incidence of postoperative gastrointestinal intolerance (POGI) (defined as I-FEED score 3–5) were recorded. Time to first tolerate of an oral diet and time to first flatus were also recorded.
Table 1 I-FEED scoring systemSecondary outcomesSerum lactate level and blood glucose level were measured at induction and two hours after surgery initiate. Quality of recover score (QoR) based on a previously validated questionnaire (Supplementary file: Appendix 3: QoR-40) [21] was calculated on 1st day, 3rd day, and 5th day after surgery. Time to first postoperative mobilization was recorded. The total number of patients with postoperative complication (except POGD) and the incidence of mortality during study period were recorded from the patient record and by visiting patients on the ward by the investigators. Complications were defined as any deviation from the normal postoperative course, guided by the European Perioperative Clinical Outcome (EPCO) definitions [22].
Statistical analysisOur sample size was calculated based on the length of hospital stay using PASS 15.0 software (NCSS, LLC. Kaysville, Utah). According to the findings of our previous meta-analysis [23] and the pilot study of 16 patients, 45 patients needed to be recruited in each group to detect a 3-day mean difference in length of hospital stay between the two groups with standard deviation of 5 in each group, with probabilities of two-sided alpha and beta errors of 0.05 and 0.20, respectively. Sample size was increased to 110 patients to accommodate losses to follow-up and protocol violations. We assumed that a similar sample size would be needed to detect similar difference of postoperative GI function recovery.
All analyses were performed in a modified intention-to- treat population, which included all patients who had undergone both randomization and anesthesia with advanced hemodynamic monitoring for eligible surgery. Continuous data were presented as mean with standard deviation (SD) or median with interquartile ranges (IQR) and binomial data as absolute number (percentage). All data were tested for normality and normal variances and parametric or non-parametric tests were used as appropriate. Fisher’s exact test was used to analyze binomial data. Student t-test or Manne Whitney U-test was used to analyze continuous data as appropriate. Neither multivariable analyses to adjust for preoperative risk nor preplanned subgroup analyses were planned or performed in this study. All tests were two-tailed, and a value of P < 0.05 accepted as significant. Statistical analysis was performed using Stata/SE software 16.0 (College Station, TX, USA).
留言 (0)