
記住我

Several CVOTs using sodium-glucose co-transporter inhibitors (SGLT2is) have demonstrated the significant superiority of these agents to placebo in not only cardiovascular outcomes [1–3] but also renal outcomes [1–4]. Furthermore, dapagliflozin and empagliflozin showed superiority to placebo with regard to renal outcomes in patients with chronic kidney disease with or without diabetes mellitus (DM) [5,6]. Based on such robust evidence concerning SGLT2is, their use is now increasing in clinical practice. Dipeptidyl peptidase-4 inhibitor (DPP4i) and Glucagon-like peptide 1 receptor agonist (GLP1Ra) are incretin-related hypoglycemic agents that stimulates insulin secretion on β cells. According to the 2019 national report by the Ministry of Health, Labour and Welfare, DPP4i is the most frequently prescribed drug in Japanese patients with type 2 DM (T2DM) due to its efficacy in decreasing the plasma glucose level and relatively low frequency of adverse effects [7]. However, DPP4is have shown only non-inferiority to placebo with regard to major adverse cardiac outcomes in several cardiovascular outcome trials (CVOTs) [8–11]; further, concerns remain regarding the increased heart failure associated with the use of saxagliptin [10]. In contrast, GLP1Ras showed their superiority to placebo with regard to cardiovascular outcomes by CVOTs [12–15]; however, evidence of their superiority concerning renal outcomes is limited to CVOTs including GLP1Ras [12,16]. Based on the above evidence, the use of GLP1Ras is also widespread in Japan, although the extent of their expansion is less than that of SGLT2is [7].
Furthermore, most CVOTs using GLP1Ras were performed mainly in the USA and Europe, and the cardiovascular or renal events by GLP1Ras in Asian patients with T2DM have not been adequately studied. In addition, in Japan, liraglutide was only available at doses lower than the world standard when it was released, and only low dose of dulaglutide is currently used. Therefore, whether the results of CVOTs using GLP1Ras can be applied to Japanese patients with T2DM are not enough discussed.
Our retrospective survey showed the renoprotective effects of SGLT2is in clinical practice in Kanagawa Prefecture, Japan; however, the effects of long-term GLP1Ra usage on the renal function in clinical practice have not yet been sufficiently discussed or reported. Therefore, we also conducted the retrospective survey to evaluate the influence of GLP1Ras on the renal function in Japanese patients with T2DM. In our survey, approximately half of the included patients were treated with SGLT2i and GLP1Ra in combination, therefore, the analysis that considers the concomitant use of SGLT2i which has already been shown to be renoprotective was needed.
Hence, the present study aimed to clarify the influence of GLP1Ras on the renal function with or without SGLT2i on Japanese patients with T2DM.
Materials and methodsThis study was approved by the special ethics committee of the Kanagawa Medical Association, Japan (approval Krec202005 on 23 March 2020 for the GLP1Ra survey and this comparison survey, and approval Krec304401 on March 6, 2018, for the SGLT2i survey).
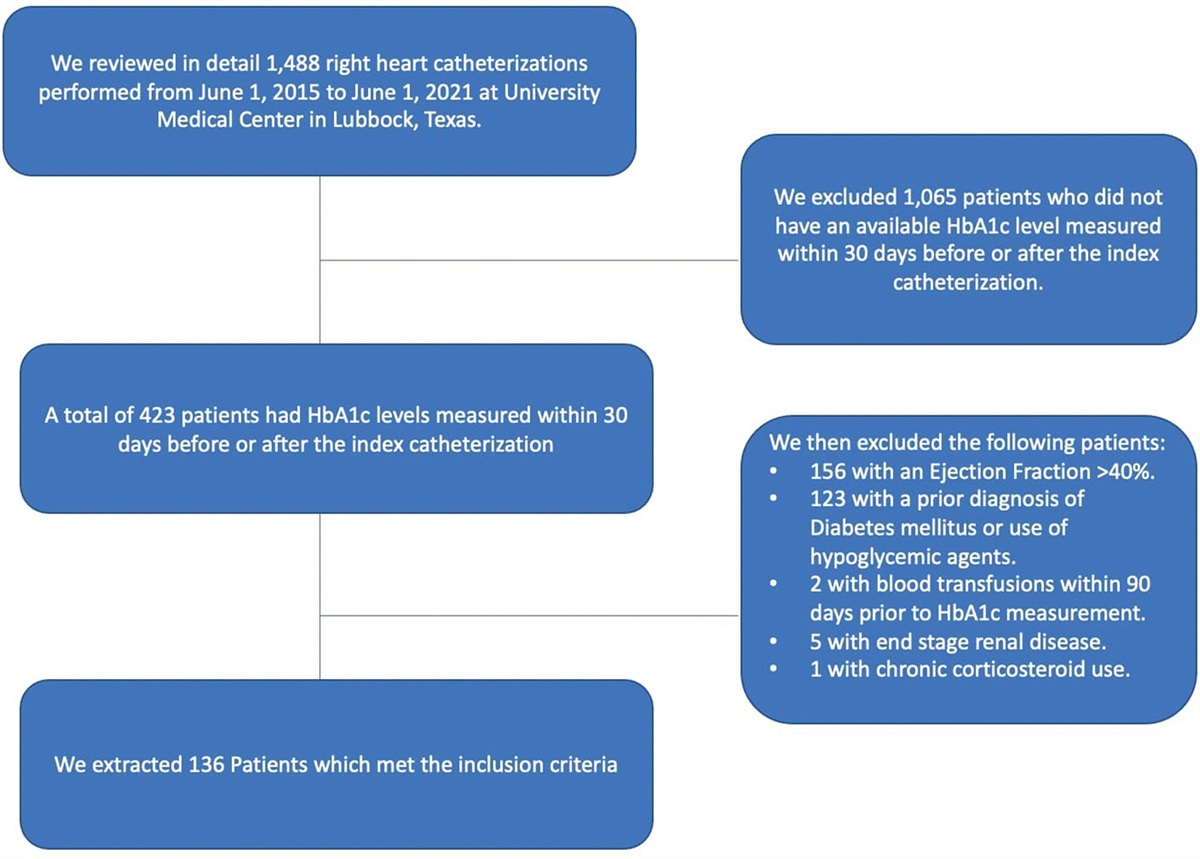
Study subjects and data collectionWe conducted a retrospective survey of patients with T2DM using GLP1Ra agents. A schematic illustration of the study design is provided in Supplementary Figure S1, Supplemental digital content 1, https://links.lww.com/CAEN/A43. Kanagawa Physicians Association, that consisted of approximately 1600 general physicians in Kanagawa prefecture, conducted this retrospective study. We invited all members to participate in this survey and asked to collect the data of the study subjects who visited their clinics between July and October 2020 and matched to the inclusion criteria as follows; study subjects were (i) patients with T2DM, and (ii) treated with GLP1Ras between July and October 2020, (iii) treated with GLP1Ra continuously for more than 1 year, and (iv) ≥20 years old in 2022. The exclusion criteria were (i) type 1 DM; (ii) requirement for chronic dialysis; (iii) severe liver dysfunction (e.g. liver cirrhosis or severe infection), (iv) terminal-stage malignancy, (v) pregnancy, (vi) irregular use of GLP1Ras (suggested by poor adherence), and (vii) intent to opt out during the study.
Twenty-two medical facilities participated in this study, and totally the data of 637 patients were collected. Based on these criteria, 34 patients were excluded. The median and average duration of GLP1Ra treatment was 47 and 52 months, respectively (range, 12–126). Therefore, in the case of the patients who have used GLP1Ra for the longest time, the data from 2009 was included in this study as baseline data. To evaluate renal outcomes, the following parameters were recorded, both at the time of the initiation of GLP1Ra treatment and at the time of the survey: age, sex, height, BW, BP [systolic BP (SBP), diastolic BP (DBP)], serum creatinine level, glycated hemoglobin A1c (HbA1c) level, and results of urinary tests (urine albumin-to-creatinine ratio [ACR] [mg/g Cr] or qualitative proteinuria). The estimated glomerular filtration rate (eGFR) was calculated using the following formula: eGFR (mL/min/1.73 m2) = 194 × age-0.287 × serum creatinine-1.094 × (0.739 for women) [1]. Qualitative proteinuria values were converted to albuminuria values using the formula reported by Sumida et al. [2]. Due to missing ACR data at the time of initiation or during the survey, 56 patients in the GLP1Ra survey were excluded, with 547 GLP1Ra-treated patients ultimately included.
Among all included GLP1Ra-treated patients, 282 with the concomitant use of SGLT2i and 265 without it were compared to assess the influence of the concomitant use of SGLT2is on the renal outcomes.
BP measurements at the officeBP measurements’ method that was utilized in this study were written in our previous report [3]. Office BP measurements were measured at each institution using their own validated cuff oscillometric devices. According to the JSH 2014 guidelines [4] (11), general practitioners measured office BP in a quiet environment after resting for a few minutes in the seated position on a chair with the legs uncrossed.
OutcomesTo determine the influence of the concomitant use of SGLT2is, the progression of the ACR status and/or a ≥ 15% decrease in eGFR per year was set as the renal composite outcome, as with our previous reports [5,6]. Second, the change in clinical findings included the logarithmic value of the ACR (ΔLnACR) and the annual change in the eGFR (annualΔeGFR) after GLP1Ra treatment were evaluated.
Statistical analysesData that showed a normal distribution were reported as the mean±SD, while those that showed a skewed distribution were reported as the median (25th percentile, 75th percentile). The IBM SPSS Statistics 28.0 software program (IBM Inc., Armonk, NY, USA) was used for the statistical analyses, and P values <0.05 were considered significant.
Adjusting for factors that might influence the outcome (confounding factors) is necessary for a retrospective cohort survey to evaluate the differences in the renal composite outcomes. In the present study, we performed a propensity score (PS) analysis to balance the confounding factors between the two groups. PSs for GLP1Ra-treated patients administered SGLT2is were calculated using a logistic regression model with the following variables: age, sex, BW, HbA1c, SBP, DBP, and eGFR and LnACR at baseline, as well as the concomitant use of other glucose-lowering agents and statins.
To compare the difference in the effects of GLP1Ra in patients with the concomitant use of SGLT2i and without it, we performed a PS matching analysis to adjust the confounding factors at baseline. In this study, PS for the concomitant use of SGLT2i was calculated using logistic regression analysis. PS matching was done at the initiation of GLP1Ra treatment. The algorithm of PS matching was a 1:1 nearest neighbor match with a caliper value of 0.040, calculated as 0.2-fold of the SD of PS [7] with no replacement. Comparisons between two groups for the clinical characteristics were performed using an unpaired t-test for the parametric variables, the Mann–Whitney rank-sum test for non-parametric variables, and the chi-square test for the categorical data in the unmatched cohort model. The paired t-test for parametric variables, Wilcoxon’s signed-rank test for non-parametric variables, and McNemar’s test for categorical data were used in the PS-matched cohort model.
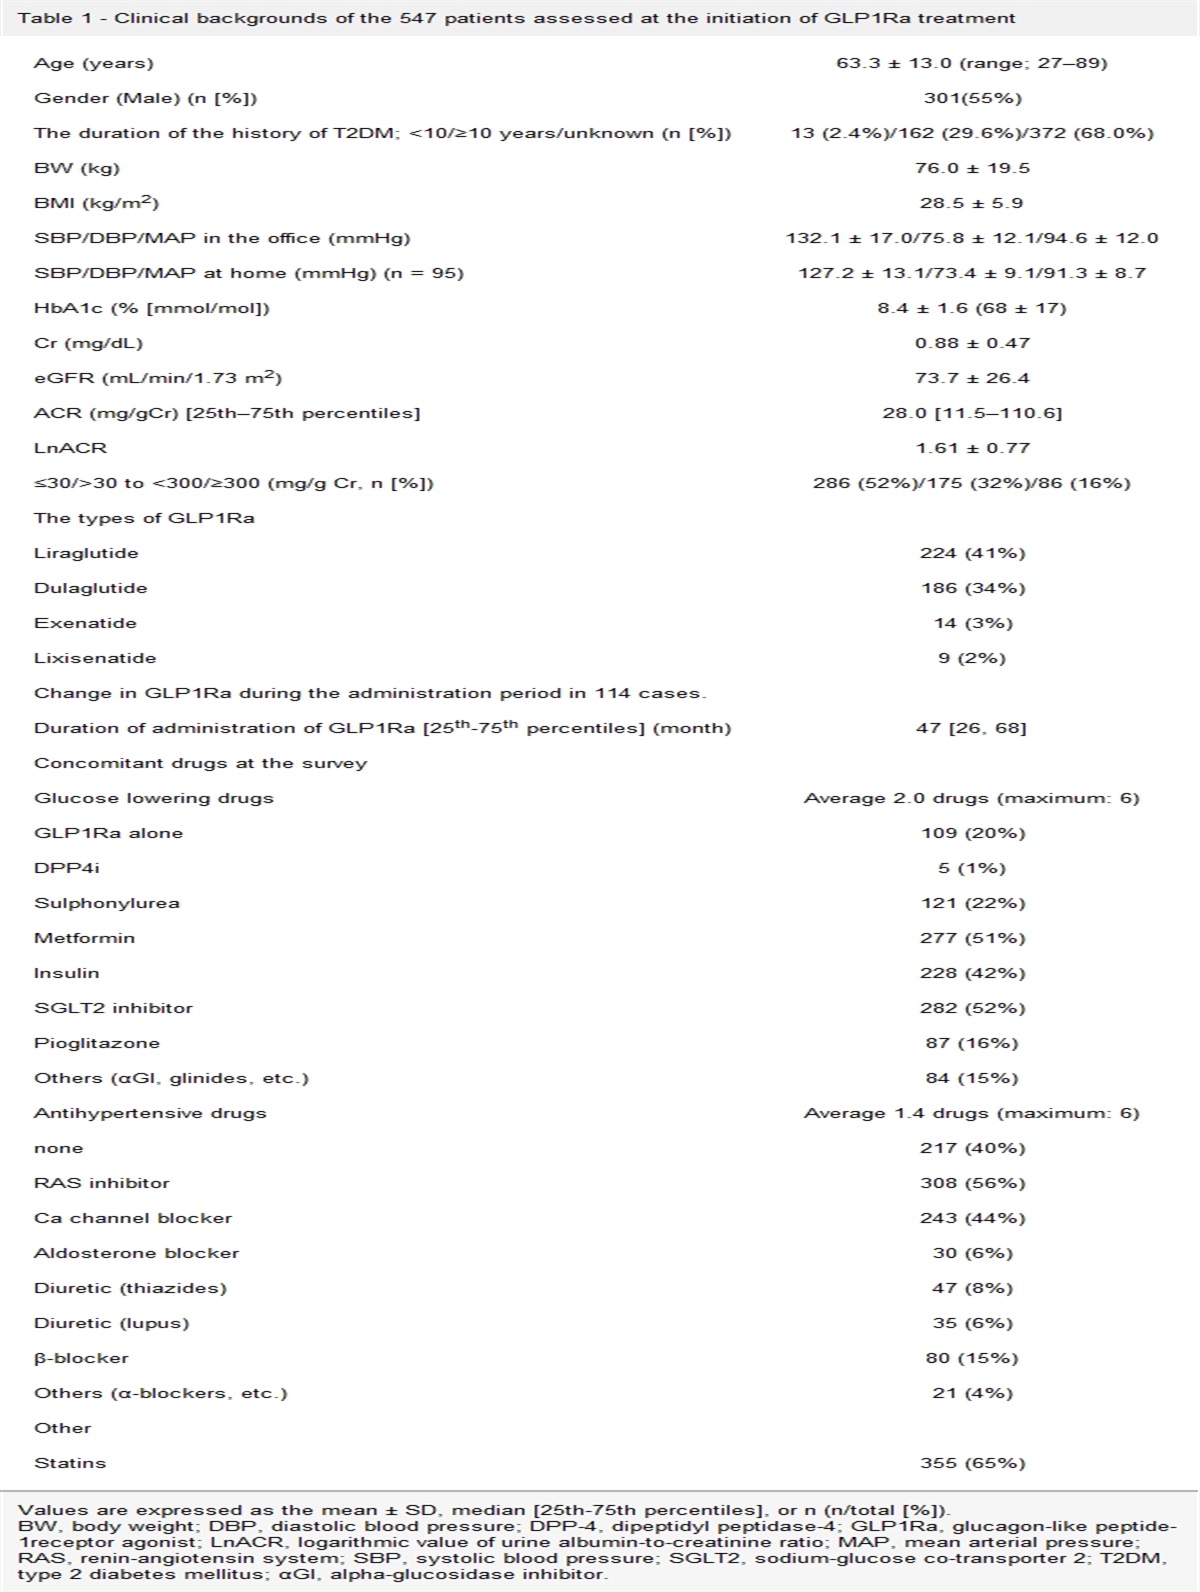
Results Changes in the clinical characteristics after GLP1Ra treatmentIn this retrospective study, the median duration of GLP1Ra treatment was 47 (26–68) months. The clinical backgrounds of the 547 patients at the initiation of GLP1Ra treatment are shown in Table 1. Concomitant medications, including glucose-lowering drugs, antihypertensive drugs, and statins, at the time of the survey are also listed in Table 1.
Table 1 - Clinical backgrounds of the 547 patients assessed at the initiation of GLP1Ra treatment Age (years) 63.3 ± 13.0 (range; 27–89) Gender (Male) (n [%]) 301(55%) The duration of the history of T2DM; <10/≥10 years/unknown (n [%]) 13 (2.4%)/162 (29.6%)/372 (68.0%) BW (kg) 76.0 ± 19.5 BMI (kg/m2) 28.5 ± 5.9 SBP/DBP/MAP in the office (mmHg) 132.1 ± 17.0/75.8 ± 12.1/94.6 ± 12.0 SBP/DBP/MAP at home (mmHg) (n = 95) 127.2 ± 13.1/73.4 ± 9.1/91.3 ± 8.7 HbA1c (% [mmol/mol]) 8.4 ± 1.6 (68 ± 17) Cr (mg/dL) 0.88 ± 0.47 eGFR (mL/min/1.73 m2) 73.7 ± 26.4 ACR (mg/gCr) [25th–75th percentiles] 28.0 [11.5–110.6] LnACR 1.61 ± 0.77 ≤30/>30 to <300/≥300 (mg/g Cr, n [%]) 286 (52%)/175 (32%)/86 (16%) The types of GLP1Ra Liraglutide 224 (41%) Dulaglutide 186 (34%) Exenatide 14 (3%) Lixisenatide 9 (2%) Change in GLP1Ra during the administration period in 114 cases. Duration of administration of GLP1Ra [25th-75th percentiles] (month) 47 [26, 68] Concomitant drugs at the survey Glucose lowering drugs Average 2.0 drugs (maximum: 6) GLP1Ra alone 109 (20%) DPP4i 5 (1%) Sulphonylurea 121 (22%) Metformin 277 (51%) Insulin 228 (42%) SGLT2 inhibitor 282 (52%) Pioglitazone 87 (16%) Others (αGI, glinides, etc.) 84 (15%) Antihypertensive drugs Average 1.4 drugs (maximum: 6) none 217 (40%) RAS inhibitor 308 (56%) Ca channel blocker 243 (44%) Aldosterone blocker 30 (6%) Diuretic (thiazides) 47 (8%) Diuretic (lupus) 35 (6%) β-blocker 80 (15%) Others (α-blockers, etc.) 21 (4%) Other Statins 355 (65%)Values are expressed as the mean ± SD, median [25th-75th percentiles], or n (n/total [%]).
BW, body weight; DBP, diastolic blood pressure; DPP-4, dipeptidyl peptidase-4; GLP1Ra, glucagon-like peptide-1receptor agonist; LnACR, logarithmic value of urine albumin-to-creatinine ratio; MAP, mean arterial pressure; RAS, renin-angiotensin system; SBP, systolic blood pressure; SGLT2, sodium-glucose co-transporter 2; T2DM, type 2 diabetes mellitus; αGI, alpha-glucosidase inhibitor.
Table 2 shows a comparison of the clinical findings in the 574 patients at the time of the initiation of GLP1Ra treatment and at the survey. GLP1Ra treatment did not significantly change the median ACR value, which increased only slightly from 28.0 (11.5–110.6) to 28.7 (10.9–120.6) mg/g Cr, but the eGFR significantly decreased from 73.7 ± 26.4 to 67.1 ± 26.8 mL/min/1.73 m2 (P < 0.001). The HbA1c, BW, and SBP/DBP/MAP at the office also decreased significantly (P < 0.001) after GLP1Ra treatment (all P-values were <0.001).
Table 2 - Comparison of the clinical findings of the 547 patients at the initiation of GLP1Ra treatment and at the survey At the initiation of GLP1Ra treatment At the survey P value ACR (mg/gCr) [25th-75th percentiles] 28.0 [11.5, 110.6] 28.7 [10.9,120.6] 0.13 Ln ACR 1.61 ± 0.77 1.63 ± 0.79 0.54 eGFR (mL/min/1.73 m2) 73.7 ± 26.4 67.1 ± 26.8 P < 0.001 HbA1c (% [mmol/mol]) 8.4 ± 1.6Values are expressed as the mean ± SD or median [25th–75th percentiles].
BW, body weight; DBP, diastolic blood pressure; DPP-4, dipeptidyl peptidase-4; GLP1Ra, glucagon-like peptide-1receptor agonist; LnACR, logarithmic value of urine albumin-to-creatinine ratio; MAP, mean arterial pressure; RAS, renin-angiotensin system; SBP, systolic blood pressure; SGLT2, sodium-glucose co-transporter 2; T2DM, type 2 diabetes mellitus; αGI, alpha-glucosidase inhibitor.
Two groups that consisted of 186 PS-matched patients were compared. Table 3 and supplementary Figure S2, Supplemental digital content 2, https://links.lww.com/CAEN/A44 shows the clinical characteristics at baseline and the distribution of PS for the PS-unmatched and PS-matched cohort models. The largest standardized difference in background covariates in the PS-matched cohort model with 186 patients in each group was 0.08, showing no significant difference between the two groups and confirming that the PS-matched model was well-balanced.
Table 3 - Clinical characteristics at the initiation of GLP1Ra treatment in patients with and without the concomitant use of SGLT2is in the unmatched and matched cohort models Unmatched cohort (n = 547) P-value Matched cohort (n = 372) SGLT2i (-)Values are expressed as the mean ± SD or n (n/total [%]), and the analysis was performed using an unpaired t-test or chi-square test
ain the unmatched model and a paired t-test or McNemar’s test
bin the matched model.
BW, body weight; DBP, diastolic blood pressure; DPP-4, dipeptidyl peptidase-4; GLP1Ra, glucagon-like peptide-1receptor agonist; LnACR, logarithmic value of urine albumin-to-creatinine ratio; MAP, mean arterial pressure; RAS, renin-angiotensin system; SBP, systolic blood pressure; SGLT2, sodium-glucose co-transporter 2; T2DM, type 2 diabetes mellitus; αGI, alpha-glucosidase inhibitor.
The incidence of the renal outcomes and the clinical characteristics after GLP1Ra treatment in the matched cohort model are shown in Table 4. No significant differences were observed in the renal composite outcomes; however, the annual decrease in the eGFR was significantly smaller and the decrease in the LnACR larger in the GLP1Ra-treated patients with the concomitant use of SGLT2i than in those without it (−1.1 ± 5.0 vs. −2.8 ± 5.1 mL/min/1.73 m2, P = 0.001; and −0.08 ± 0.61 vs. 0.05 ± 0.52, P = 0.03, respectively). The changes in the BW, SBP, DBP, and MAP after GLP1Ra treatment did not show significant differences between the two groups.
Table 4 - Renal outcomes and clinical characteristics after GLP1Ra treatment in the matched cohort model SGLT2i (-) n = 186 SGLT2i (+) n = 186 P-value Renal outcomes and the function a) Incidence of renal composite outcome 38 (20%) 32 (17%) 0.50 progression of ACR worsening 29 (16%) 26 (14%) 0.77 ≥15% decrease in the eGFR per year 10 (5%) 6 (3%) 0.45 b) ΔeGFR Change rate of the eGFR (%) −13.6 ± 19.5 −5.6 ± 21.0 <0.001a Annual change in the eGFR (mL/min/1.73 m2/year) −2.8 ± 5.1 −1.1 ± 5.0 0.001a c) Changes in the LnACR 0.05 ± 0.52 −0.08 ± 0.61 0.03 Clinical characteristics after GLP1Ra treatment eGFR (mL/min/1.73 m2) 64.0 ± 23.7 69.5 ± 26.6 0.03a LnACR 1.66 ± 0.84 1.53 ± 0.76 0.14a BW (kg) 71.9 ± 17.8 72.1 ± 16.4 0.89a SBP (mmHg) 130.9 ± 15.6 128.3 ± 15.9 0.10a DBP (mmHg) 73.7 ± 12.3 73.2 ± 11.1 0.68a MAP (mmHg) 92.7 ± 11.7 91.5 ± 11.3 0.30a HbA1c (% [mmol/mol]) 7.6 ± 1.3Values are expressed as the mean ± SD or n (n/total [%]), and the analysis was performed using a paired t-test or McNemar’s test
ain the matched model.
BW, body weight; DBP, diastolic blood pressure; DPP-4, dipeptidyl peptidase-4; GLP1Ra, glucagon-like peptide-1receptor agonist; LnACR, logarithmic value of urine albumin-to-creatinine ratio; MAP, mean arterial pressure; RAS, renin-angiotensin system; SBP, systolic blood pressure; SGLT2, sodium-glucose co-transporter 2; T2DM, type 2 diabetes mellitus; αGI, alpha-glucosidase inhibitor.
In the present study, we retrospectively collected a relatively large population of Japanese patients with T2DM (n = 547) to whom GLP1Ras had been continuously prescribed for long periods in clinical practice (median treatment period: 47 months). Furthermore, as in our previous study of SGLT2i-treated patients [8], this study included detailed clinical findings, unlike other database studies using only the International Statistical Classification of Diseases and Related Health Problems-10 (ICD10) code or medical and pharmaceutical claims. To our knowledge, no research on GLP1Ras like the present study has previously been conducted.
As GLP1Ras treatment decreased not only the glucose level but also the BW or BP, potential renoprotective effects were speculated; however, any marked improvement in the ACR or decrease in the eGFR was not observed in total GLP1Ra-treated patients in this study. In contrast, on the PS-matched model in this study, there was no significant difference of the incidence of the renal composite outcomes (17% in GLP1Ra-treated patients with SGLT2i vs. 20% in those with it, P = 0.50), however, GLP1Ra-treated patients with the concomitant administration of SGLT2i showed renoprotective effects, including a smaller decrease in the annual ΔeGFR and larger decrease in the LnACR than GLP1Ra-treated patients without SGLT2i (−1.1 ± 5.0 vs. −2.8 ± 5.1 mL/min/1.73 m2, P = 0.001; and −0.08 ± 0.61 vs. 0.05 ± 0.52, P = 0.03, respectively).
GLP1 and the decrease in ACRAlbuminuria is the most important surrogate marker for the progression of DM nephropathy [9] and an independent factor for not only end-stage kidney disease but also cardiovascular events [10]. Several experimental models have demonstrated the renoprotective effects of GLP1Ras without lowering the blood glucose level [11]. In clinical practice, a small study of 23 patients receiving liraglutide treatment for 1 year showed a 27% decrease in the mean ACR (from 25.5 to 18.6 mg/day) [12]. In addition, a small study of 31 patients receiving 1.8 mg/day liraglutide demonstrated a 7-mmHg reduction in the 24-h SBP (P = 0.11) and reduction in the ACR by 30% (95% confidence interval (CI): 12–44%, P = 0.003) [13].
Regarding GLP1Ras and SGLT2is, several CVOTs were performed to evaluate the cardiovascular outcomes. The LEADER trial with liraglutide [14], SUSTAIN-6 trial with semaglutide [15], REWIND trial with dulaglutide [16], HARMONEY trial with albiglutide [17], and AMPLITUDE-O trial with efpeglenatide [18] demonstrated the superiority of the respective agents to placebo with regard to major adverse cardiovascular events, with hazard ratios (95% CI) of 0.87 (0.78–0.97), 0.74 (0.58–0.95), 0.88 (0.79–0.99), 0.78 (0.68–0.90), and 0.73 (0.58–0.92), respectively.
The renal outcomes were additionally analyzed as a secondary outcome in the LEADER trial, SUSTAIN-6 trials, REWIND trial, and AMPLITUDE-O trial. These outcomes included the progression of the ACR, decrease in the eGF
留言 (0)