
記住我

Diabetes mellitus (DM) is a major global health threat with the prevalence of the disease rapidly expanding over the past four decades. This expanding prevalence and various individuals living with diabetes and its comorbidities with increased life expectancy have brought about new multilevel burdens and socioeconomic challenges [1]. DM is associated with serious complications that threaten human life; even in its earlier stages non-diabetic hyperglycemia. Severe cases can cause blindness, kidney failure, heart attacks, stroke, and lower limb amputation [2].
The target of DM management is ideally preventing or delaying the development of its complications and remission of diabetes in some circumstances [3]. Diabetes care model is a method of optimizing health care services through interactions between health care disciplines aiming at diabetes control [4].
Multiple studies have shown that multidisciplinary, team-based, coordinated care has been associated with improved measures of quality care and reduced healthcare utilization [5,6]. This treatment landscape evolution was a new opportunity for the diabetologist and cardiologist, in the setting of a multidisciplinary approach, to concomitantly improve glycemic control and reduce the risk of cardiovascular (CV) events in individuals with type 2 DM (T2DM) [7].
Challenges faced were dealing with a diverse population of patients and doctors with different ethnicities, genetic predispositions and clinical approaches and having no standardized clinical care plan for the Diabetes clinic with a subsequent potentially missed screening for diabetes complications and diagnosis in a late stage for several cases.
Understanding the need to improve outcomes for known individuals with diabetes, we developed a systematized Five-structured visits Multi-disciplinary Clinical care Approach (FMCA) for known individuals with diabetes. The team’s 5-stage systematized approach was adopted from international guidelines and adapted to the served patient population in our hospital with the intent of optimizing diabetes care and early detection of the anticipated preventable complications [8].
To assess the effect of application of the 5-stage approach implementation on each of T2DM control and T2DM complications and comorbidities.
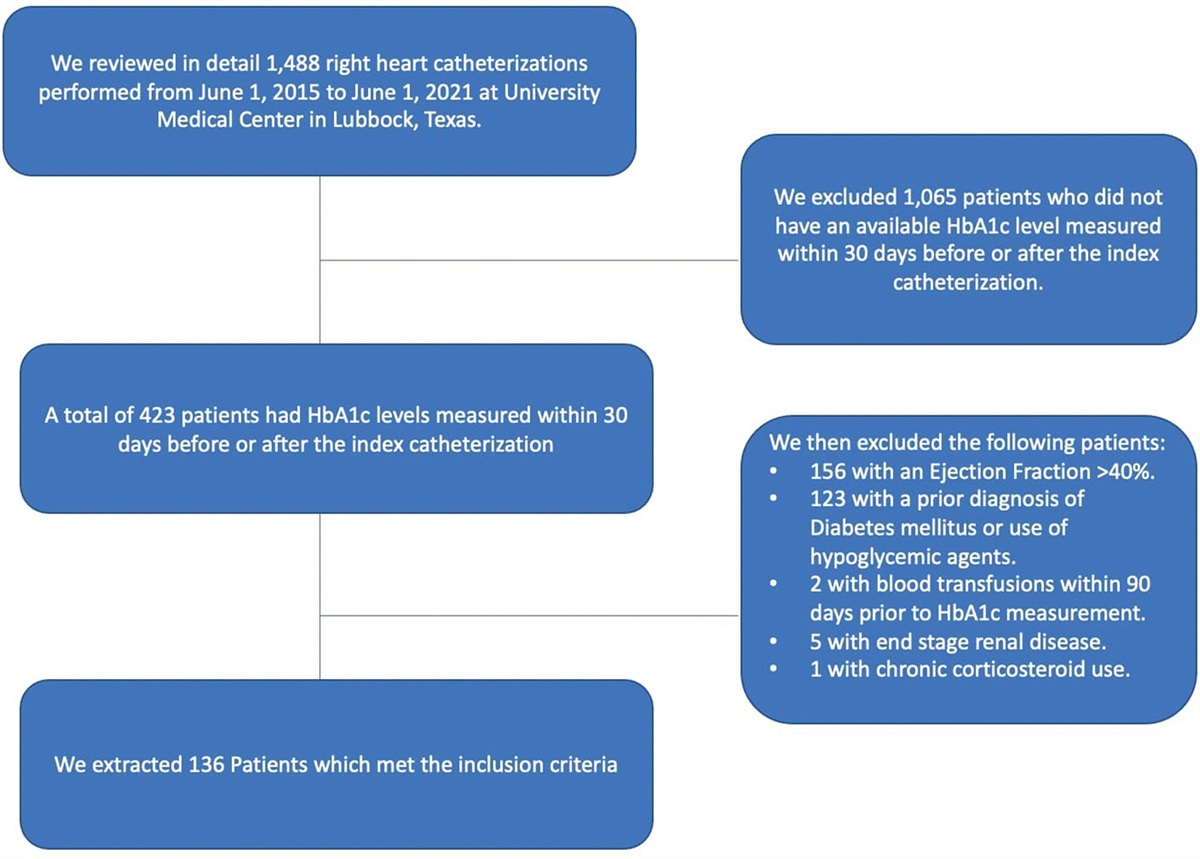
Patients and methodsWe conducted a retrospective cohort analysis using the records of individuals with T2DM who received one year of regular care followed by a year (30th of December 2020 to 30th of December 2021) after implementation of FMCA for patients attending the Diabetes Clinic at Zulekha hospital. To distinguish between the 2 types, individuals with T1DM should have low C-peptide levels and at a minimum one elevated immune markers (glutamic acid decarboxylase [GAD] autoantibodies),or islet autoantibodies [9]. We conducted retrospective subgroup analyses of diabetes control based on HbA1c (≤7%) one year after applying the FMCA aiming to analyze the factors associated with control of diabetes [10]. The patients were subdivided into a group of controlled and another group of uncontrolled diabetes designated CDM and UCDM, respectively.
The targeted patients for the FMCA were > 18 years old, with uncontrolled DM (HbA1c ≥ 7%). We excluded patients based on the following criteria: History of bariatric surgery, Long-term use (>60 days) of steroids or other hyperglycemic drugs in the year prior to baseline, organ failure (heart, renal, or liver), and patients who missed more than 2 visits during follow-up. Also, pregnant/lactating females were excluded.
FMCA comprised an interactive close collaboration between members of different departments: Endocrinology, Laboratory, ophthalmology, cardiology, nephrology, Critical care medicine, diabetes educator/lifestyle modifier, vascular surgery, bariatric surgery, gastroenterology, dentistry, psychology and pulmonology teams. The approach is in the form of five stages for every patient over the year; each stage includes a battery of history taking, clinical examinations, score (s) assessments, laboratory investigation and consultations by other members of the clinical team. Some parameters are fixed for all patients; others are tailored as per the data retrieved for the patient from the previous visit collectively forming a personalized multidisciplinary clinical approach (suppl1, Supplemental digital content 1, https://links.lww.com/CAEN/A45).
We collected baseline covariates from records at the first visit including demographic characteristics, history including type and duration of DM treatment, and physical examination. The regular care was implemented according to ADA standards of care [11]. The laboratory workup was conducted according to FMCA including tests related to glycemic control: Fasting blood sugar, glycated hemoglobin (HbA1C), complete blood count (CBC), lipid profile [including total cholesterol (TC), low-density lipoprotein cholesterol (LDL-C), high-density lipoprotein cholesterol (HDL-C), triglycerides (TG) and non-HDL Cholesterol], serum creatinine, thyroid stimulating hormone (TSH), vitamin B12, alanine transaminase (ALT), urine routine analysis and urine albumin creatine ratio (UACR) and other biochemical assays which were followed from the first visit till the end of a one year of regular care and one year follow up on FMCA. The patient adherence to treatment was assessed by collecting the empty medication strips every three months and by measuring a 6-item patient self-efficacy scale for managing chronic diseases at the start and end of one year of FMCA [12].
Using the Cobas 6000, Roche Diagnostics, modular autoanalyzer, most of the tests were analyzed. LDL-C was directly measured, blood glucose was tested by enzymatic hexokinase method, serum creatinine concentrations were determined by kinetic Jaffe method and serum TSH and vitamin B12 were determined by electrochemiluminescence immunoassay. HbA1c concentrations were measured by turbidimetric inhibition immunoassay using the COBAS INTEGTRA 400 plus machine, Roche Diagnostics. The final result was expressed as HbA1c percent and is calculated from the HbA1c/hemoglobin (Hb) ratio as follows: HbA1c% = (HbA1c/Hb) × 91.5 + 2.15. UACR was determined by immunoturbidimetry and kinetic Jaffe methods for urine albumin and urine creatinine, respectively, on the same machine. Complete Blood count was done using UniCel DxH 800 Coulter Cellular Analysis System. Urine routine analysis was done by urine strip dip analysis and reader (COBAS U 411, Roche) plus light microscopy.
Statistical analysisDescriptive statistics were used to summarize the data. Repeated-measures ANOVA was applied to compare both periods of regular care and FMCA. Differences between CDM, and UCDM groups characteristics in baseline and after FMCA implementation were studied using an independent t-test (normally distributed data) or Mann–Whitney test (non-normally distributed data). Multivariate regression models were specified to identify significant factors associated with the development of diabetes complications and control of diabetes after adjustments for age, gender, smoking, and BMI. All analyses were conducted using SPSS version 25 (SPSS Inc., an IBM company; Chicago, IL). The level of significance was <0.05.
Results Demographic data of the enrolled patientsOut of 669 type 2 diabetes patients, the medical records of 476 patients fulfilled the inclusion criteria. Forty-nine percent of patients were males and the mean age was 44.22 years (Table 1).
Table 1 - Comparison between the regular care and after implementation of multidisciplinary care Pre-regular care (A) End regular/pre-FMCP care (B) After FMCP care (C) DiffALT, alanine transaminase; ASCVD, atherosclerotic cardiovascular disease; DBP, diastolic blood pressure; FMCP, 5-stage multi-disciplinary clinical care pathway; HbA1C, hemoglobin A1c; HDL, high-density lipoprotein; LDL, low-density lipoprotein; SBP, systolic blood pressure; TG, triglycerides; TSH, thyroid stimulation hormone; UACR, urinary albumin creatinine ratio; vitb12, vitamin B 12.
Regarding medical history pre-FMCA, the mean diabetes duration is 4.28 years, and the number of anti-diabetic medications was significantly higher by the end of FMCA versus regular care (P = 0.04).
No significant differences in the SBP, DBP, and BMI were detected between basal and one year of regular diabetes care. After application of FMCA, the SBP and DBP had significantly decreased compared to regular diabetes care period (by 11.19 and 4.44 versus 4.11 and 1.28 mmHg, P = 0.001 and 0.02 vs. 0.06 and 0.42, respectively). Moreover, the BMI had significantly decreased after the application of FMCA by 7.47 vs. 3.89 kg/m2 (P = 0.001).
HbA1c levels showed a marked decrease among the patients after implementation of FMCA (0.88 vs. 0.01%, P = 0.02). Also, a significant reduction in the LDL (22 mg/dL vs. 13.2 mg/dL, P = 0.043 vs. P = 0.254, respectively), and triglycerides (27.50 vs. 5.39 mg/dL, P = 0.04) was achieved in the FMCA period versus the regular period. Moreover, the creatinine and urinary albumin/ creatinine ratio were significantly decreased in the FMCA period versus the regular care period (-0.09 mg/dL, 18.84 mg/g, P = 0.003 and 0.04, respectively). Despite the descent of levels, no significant differences were found in non-HDL levels between the two periods (P = 0.758). The changes in TSH and vitamin B 12 levels between the two periods (P = 0.12, and P = 0.05, respectively) were also not statistically significant. Regarding the liver enzyme (ALT), it was significantly lower after implementation of FMCA versus regular care (- 10.69 mg/dL, P = 0.004). Also, the pus cells in urine, indicative of urinary tract infections, were lower after application of FMCA versus regular care (P = 0.01)
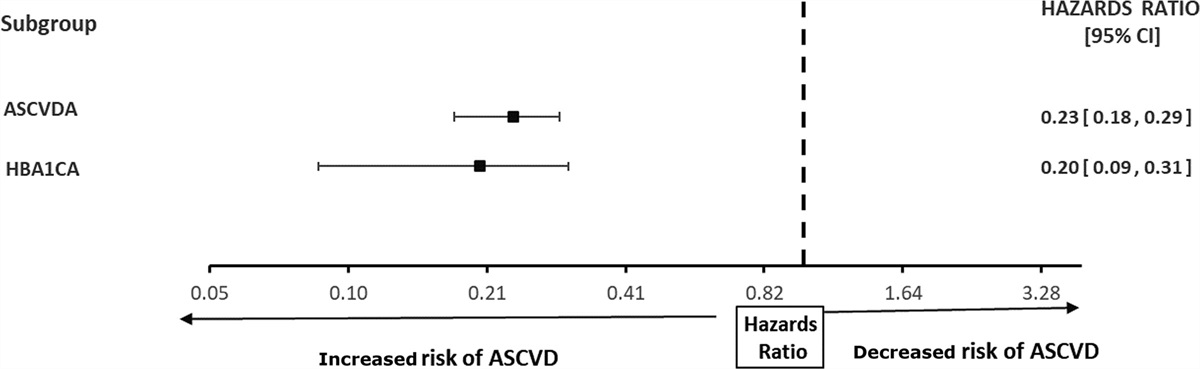
Improvement of diabetes-related complicationsCompared to an increase in ASCVD during the regular period, exposure to FMCA significantly decreased the CV risk score (0.17%, 11.41%, P = 0.001, respectively) (Table 2). The univariate analyses of the CV atherosclerotic diseases entailed the age, sex, smoking, duration of DM, BMI, SBP/ DBP, LDL, non-HDL, TG, and ACR. The most significant predictors for ASCVD were baseline HbA1C and ASCVD (Fig. 1).
Table 2 - Comparison of the safety outcome between the regular care and after implementation of multidisciplinary care Mean (SD)/% (N) Pre-regular care (A) End regular/pre-FCMP care (B) After FCMP care (C) DiffASCVD, atherosclerotic cardiovascular disease; FCMP, 5-stage multi-disciplinary clinical care pathway.
 Fig. 1:
 Forest plot of factors associated with A atherosclerotic cardiovascular risk score. ASCVD A, basal atherosclerotic cardiovascular disease; HbA1C A, basal hemoglobin A1c.
The detection rate of the microvascular complications neuropathy, Diabetic foot infection (DFI), retinopathy, and nephropathy was significantly increased at the start of FMCA period (314.10%, 396.43%, 246.43% and 183.78%, P = 0.005, 0.04, 0.02, and 0.012, respectively). Implementation of FMCA has led to decreased microvascular complications including neuropathy by 73.37% (P = 0.01); however, no significant change was found in nephropathy, DFI, and retinopathy. Multivariable regression analysis revealed that the main predictor for neuropathy risk is baseline ASCVD and neuropathy and that for nephropathy is baseline nephropathy, DFI, and controlled diabetes and those for retinopathy are baseline retinopathy, controlled diabetes and TSH (Fig. 2).
 Fig. 2:
 Forest plot for microvascular complications associated with diabetes ASCVD A, basal atherosclerotic cardiovascular disease.
Severe hypoglycemia rate increased at the initial implementation of FMCA (by 162.50%, P = 0.006) contrary to the hospital admission rate which was significantly decreased at the end of the regular care period (by −65.66%,P = 0.04). Conversely, severe hypoglycemia rate significantly decreased after implementation of FMCA (by 97.67%, P = 0.02), however, no significant change was noted in hospital admission rate.
Controlled and uncontrolled diabetes after implementation of FMCAAfter subgroup analysis, there was no significant difference between age, sex, diabetes duration, and medication number (Table 3).
In comparison to UCDM, a significant reduction in the LDL and TG levels were detected in the CDM group (P = 0.016, 0.022, respectively). Moreover, TSH was significantly lower in the CDM group versus the UCDM group after the application of FMCA. Despite a significant decrease in ASCVD in both groups, it was significantly lower in the CDM compared to UCDM after the implementation of FMCA. Moreover, urinary albumin/ creatinine ratio and hospital admission were significantly lower in CDM group after FMCA period (P = 0.004. 0.017, respectively). The self-management score has significantly increased in both groups; however, it was significantly higher in the CDM group. No significant differences were found in the detection rates of neuropathy, nephropathy, DFI, retinopathy and hypoglycemia between the two groups (Table 4).
Table 3 - Comparison between the controlled and uncontrolled diabetes after implementation of multidisciplinary care Uncontrolled diabetes Controlled diabetes P-value Mean SD Mean SD AGE (yrs) 44.41 10.10 44.22 10.73 0.516 Sex (male) 47.12% (49) 50.3% (67) 0.891 Smoker 32.7% (34) 33.82% (45) 0.735 Diabetes Duration (yrs) 4.73 3.75 4.48 3.47 0.783 Number of drug 3.11 0.92 3.11 0.93 .901 Drug type MET & 1. Insulin 10.0% 8.2% 0.534 2.SU (A Glimpride, Gliclazide) 16.4% 15.8% 3.DppIV (Sita- and Vilda-) gliptin 72.8% 78.5% 4.SGLTI (Dapa-, Empa-) gliflozin 51.8% 63.2% 5.GLP1 (Dula-, Sema-) glutide 21.7% 40.0%ALT, alanine transaminase; ASCVD, atherosclerotic cardiovascular disease; DBP, diastolic blood pressure; DPPIV, dipeptidyl peptidase-4 inhibitor; FMCP, 5-stage multi-disciplinary clinical care pathway; GLP1, glucagon-like peptide-1 agonist; HbA1C, hemoglobin A1c; HDL, high-density lipoprotein; LDL, low-density lipoprotein; Met, Metformin; N, number of patients; SBP, systolic blood pressure; SGLTI, sodium glucose cotransporter -2 inhibitor; Su, Sulfonyl-urea; TG, triglycerides; TSH, thyroid stimulation hormone; UACR, urinary albumin creatinine ratio; vitb12, vitamin B 12.
aData are mean ± SD.
The self-management score, baseline HbA1c, TSH, LDL, TG, UACR, ASCVD and hospital admission rate appeared to be significantly correlated with Diabetes control by univariate analysis of variables. After a Multivariate regression analysis of factors affecting DM control, we detected that baseline HbA1c, UACR, self-management score and hospital admission rate were the most important factors to predict diabetes control (Fig. 3).
 Fig. 3:
 Forestplot for factors associated with controlling of diabetes. HbA1C A, basal hemoglobin A1c; UACR A: basal urinary albumin creatinine ratio.
DiscussionBased on current results, the implementation of 5-stage approach enhanced the control of T2DM. Also, it decreased the development of T2DM complications.
The current study retrieved a significant reduction in mean HbA1c levels after the FMCA. A systematic review comprising similar studies has shown significantly improved HbA1c, compared to standard care or other approaches by as much as 0.8% in individuals with T2DM, at least in the short term (≤ 12 months) [13]. Moreover, a two-arm cluster randomized trial found that the use of the IDT (interdisciplinary team) was significantly associated with improvements in HbA1c [14]. On other hand, a systematic literature review and meta-analysis of seven randomized controlled trials evaluated the effectiveness of chronic integrative care programs for T2DM; two of the trials reported no significant differences in HbA1c levels between intervention groups and control groups after 1 year. Considering the mean HbA1c values at baseline were smaller for participants in this study than in other studies [15].
The lipid profile significantly improved after implementation of FMCA; a significant reduction in the LDL (P = 0.043), and triglycerides (P = 0.04) were achieved over our FMCA period versus the regular period. Bain et al. found that their Multidisciplinary Approach to Management and Care of Patients with T2DM was also significantly associated with improvements in LDL-cholesterol (P = 0.0004) [12]. This finding is different from the results of a previous research that reported no significant differences in lipid profile levels of patients participating in an integrated care program [16]. In a multidisciplinary therapy conducted by Angela et al., LDL levels were 94.4 mg/dl ± 5.4 in the team-approach group and 88 mg/dl ± 5.3 in the conventional group, P = 0.4. However, there was a significant reduction in the triglyceride levels achieved with multidisciplinary team care: 148 mg/dl ± 12 in the team-approach group and 222 mg/dl ± 20 in the conventional group; P = 0.002. The controversy of results is related to different demographic data [
留言 (0)