
Remember me
Fifty-six participants between the ages of 18 and 50 were recruited in Oslo, Norway. Each participant was assigned to one of three experimental groups. Group 1 consisted of 24 participants, divided into six quartets. They responded to the experimental task together and were allowed to use vocal communication during the sessions. Hereafter, group 1 is referred to as the vocal group (VG). In group 2, nine participants responded alone and independently to the same task. Hereafter, group 2 is referred to as the individual group (IG). Group 3 consisted of 23 participants, divided into five quartets and one triad. Participants in group 3 were not allowed to communicate vocally during sessions. Hereafter, group 3 is referred to as the nonvocal group (NVG). The participants had no previous knowledge of behavior analysis and did not know each other before the experimental sessions. No compensation was offered for participation.
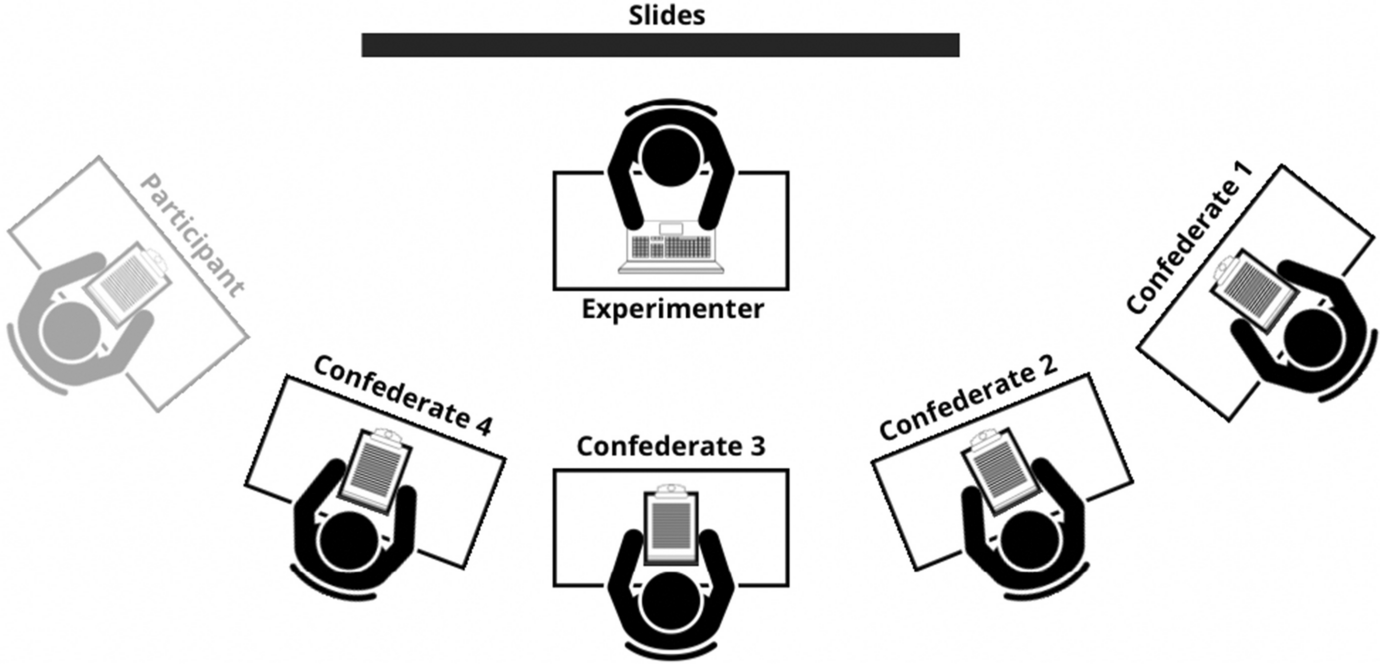
Setting and MaterialExperimental sessions were conducted in a conference room (8 m × 7 m) at the Institute of Behavioral Science, Oslo Metropolitan University, Oslo, Norway. The conference room contained a large table with up to four chairs for participants (one for IG and four for VG and NVG) along one side and two chairs for experimenters on the other side (see Fig. 1). Three HP EliteBook 840 laptop computers were used to conduct the experimental task. One computer was connected to the projector screen that was placed to the left of the participants. The presentation slides that were used in each trial were created using Microsoft PowerPoint. The slides were displayed on the screen, connected to a projector. The second and third computers were connected via Google slides and showed participants a shared screen. The first computer also included a feedback screen (scoreboard and signals of correct/incorrect) that was visible to the participants on a 24-inch Samsung monitor that was connected to the second computer. The numbered cards were used by the participants to show their choices in each trial. Figure 1 depicts the experimental room and apparatus that was used during the experimental sessions.
Fig. 1
Top view of the experimental room. (1) Two experimenters. The first computer (2) controlled a central screen (3) where task slides were displayed to the four participants (4). The second and third computers (5 and 6) controlled feedback and points that were displayed on a monitor (7) that faced the participants. Each participant had access to four answer cards, numbered 1 to 4 (8)
ProcedureInstructionsAt the onset of each experimental session, the participants were seated along one side of the conference table, and the two experimenters sat on the opposite side of the table. The participants then signed an informed consent form and read instructions that were displayed on the projector screen. The instructions were the following:
Hello, Thank you for your participation! Now, you are going to work on an activity together. You will have access to slides. You are to choose the alternative that best represents the slide. There will be four cards with the numbers 1 to 4 on the table and for each slide there will be four alternatives. You must agree on the answer that represents your impression of the picture and hold up the number that corresponds with the chosen alternative. The experimenter will check your answer and give you a community point if it is in accordance to the answers given by groups that went through the same experiment previously.
Guidelines:
1)You should choose the alternative that you think best represents the slide.
2)Do not think too much when choosing. Make it as fast as possible.
3)You are allowed to talk to each other at any time.
4)Avoid talking to the experimenter.
5)You must all agree on one alternative. All participants must choose the same.
6)The answers must be the same, but each participant should show his/her own answer card.
7)The answers will be checked after the trial time is over, and if they are compatible to the previous groups’ answers you will receive community points.
8)Try to score as many points as possible.
After reading the instructions, the experimenters clarified the participant's question but did not provide any additional information beyond what was specified in the instructions. Note that the instructions above were given to the VG. The information that was displayed was adapted for the IG and NVG.
Experimental TaskUpon beginning the experimental sessions, the participants were presented with the first of 65 slides. Each slide displayed a picture of a person in an everyday situation alongside four text alternatives (Fig. 2). The text alternatives included four descriptions of the picture, numbered 1–4 and displayed on the projector screen. The text alternatives were divided into two arbitrary categories, defined for scoring purposes as “person” or “environment.” For the “person” category, the alternatives described the physical characteristics or behavior that was expressed in the picture (e.g., “cute baby” and “playing with water”). For the “environment” category, the alternatives described the environmental surroundings (e.g., “pleasant park” and “pink sticks”). The same set of 65 slides was used for all experimental sessions, but the pictures and order of alternatives were randomized across sessions.
Fig. 2
Example of slide, with the picture on the left and text alternatives that described the picture on the right. Two text alternatives described the person (1 and 2), and two described the environment (3 and 4)
The participants were instructed to choose the alternative they “considered to best represent the slide.” Participants in the IG responded to the task individually and only in the presence of both researchers. Participants in VG and NVG had to agree on the same alternative (IBCs) and subsequently show their own laminated numbered card at the same time (AP). As participants showed their choice concomitantly, no order was recorded—only the alternative that was picked by the group was recorded. Participants in the VG could talk freely amongst themselves at all times. Participants in the NVG had to use nonvocal gestures to agree on their choices. The slide was displayed a maximum of 60 seconds. If the participants did not make a choice within 60 seconds, then the picture was replaced by the text “Your time is up,” in which case the participants were requested to make an immediate decision. In the instructions, the participants were told, “The experimenter will check your answer and give you a community point if it is in accordance with the answers given by groups that went through the same experiment previously.” However, points were actually delivered according to a criterion that was set by the experiments for each phase (i.e., alternative that described “person” behavior or “environment”).
The 65 slides were divided into a baseline (A) that consisted of five trials and four intervention phases with 15 slides each (A-B1-C1-B2-C2). During baseline trials, participants’ choices were recorded, Feedback B (Figure 3; “You did not score any points in this phase. Please wait for the next.”) was delivered, and no points were added to the scoreboard. By the end of the baseline, experimenters evaluated participants’ preference for one of the two categories. Next, the experimenters set the criterion to earn points in phase B1 as the opposite of the preferred category. For example, if participants chose the “person” category three or more times during baseline, then the reinforced choice in B1 was set as “environment.” Next, the reinforced choices would be “environment” in C1, “person” in B2, and “environment” in C2. During the four intervention phases, responses within the targeted category resulted in Feedback A (“You scored 10 points,” alongside a smiley face), and 10 points were added to the scorecard. Responses in the nontargeted category resulted in Feedback B (“You did not score any points. Please wait for the next”), with no points added to the scoreboard.
Fig. 3
Feedback A and B. Feedback A was given following correct answers in accordance with the contingency. Afterward, 10 points were added to a cumulative point counter on the right side of the screen. Feedback B was given following incorrect answers in accordance with the condition criteria. Following incorrect answers, no points were added to the cumulative point counter
Experimental DesignThe three experimental groups (VG, IG, and NVG) were designed to emulate two strategies to perform the same experimental task. Participants in the VG discussed the alternatives using vocal and nonvocal communication (IBCs) and agreed on a choice (AP). Participants in the NVG used only nonvocal communication to discuss the alternatives (IBCs) and agree on a choice (AP). Feedback messages and points were delivered contingent on VG and NVG agreed upon choices. Participants in the IG performed the same task alone and received feedback messages and points contingent on their individual choices. The VG and NVG emulated a population in which individual interaction (IBCs) operates in the environment (i.e., metacontingency). The IG emulated a population in which the behavior of multiple individuals, occurring independently and according to similar operant contingencies, operates in the environment. Thus, a macrocontingency was emulated by summing the performance of IG participants. An A-B-C-B-C design was used to evaluate the performance of groups to chance within groups.
Data AnalysisThe intervention phases consisted of 15 trials with a shift in the criterion (environment/person) in an A-B-C-B-C reversal design. As choices in each trial were made between four alternatives that belonged to two categories, a random choice would be correct at a 50% level of chance (cf. Iversen, 2016). To evaluate whether correct responses were significantly better than chance, we divided each intervention phase into three blocks of trials. The first block consisted of trials 1 to 5. The second block consisted of trials 6 to 10. The third block consisted of trials 11 to 15. We then used a single-sample t-test to compare the sum of agreed choices for the VG and NVG and individual choices for the IG in each block of trials to chance. Comparisons of choices and chance were performed by testing the discrimination of categories in blocks of trials with a hypothetical trial block with means set at 50%, with sample size standard deviation values kept equal to the block that was compared. Comparing means to chance allows the evaluation of significance levels in discrimination tasks without the need for baseline conditions or control groups (Iversen, 2016). This data analysis was adequate for the present experimental design, which consisted of four intervention phases.
Comments (0)